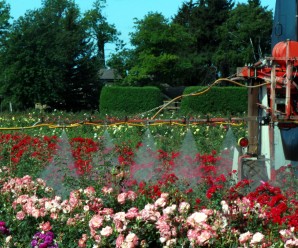
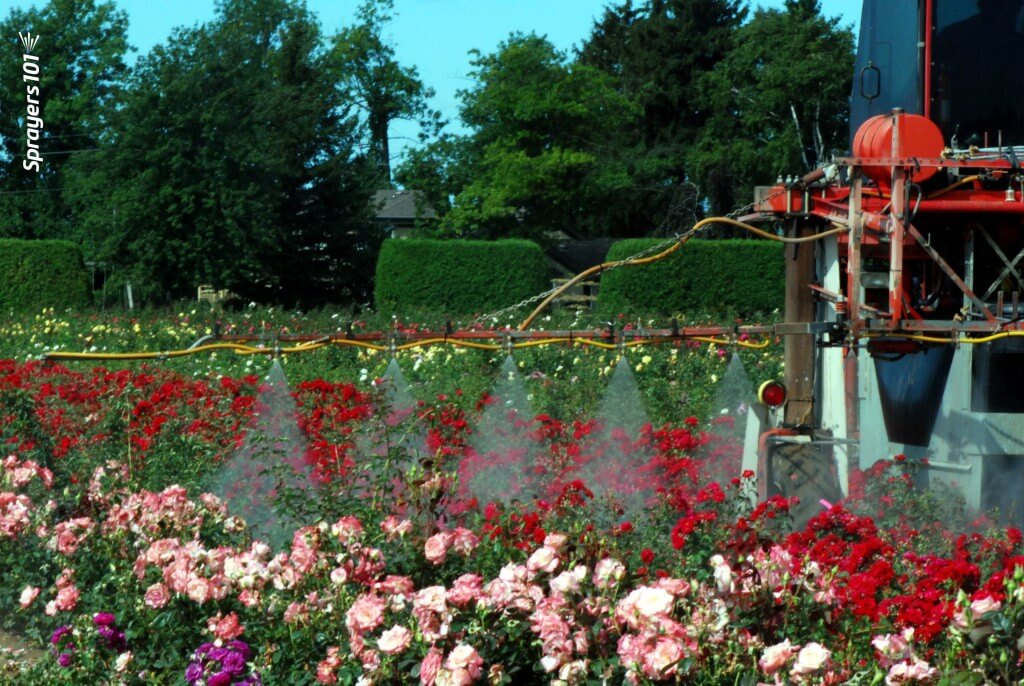
We always admire the photos of sprayers in tulips produced by the Netherlands. Rose protection in Ontario is equally beautiful.
Nursery growers apply pesticides to a diverse range of plant species. In a perfect world, sprayer operators would adjust their sprayer set-up to match each crop, but this is rarely done because of time constraints and a lack of guidance. Adjustments in product rate and spray distribution should reflect the plant size, row spacing and developmental stage of the crop and pest. Any such adjustments should be performed using a reference point for coverage and a strong history of efficacy.
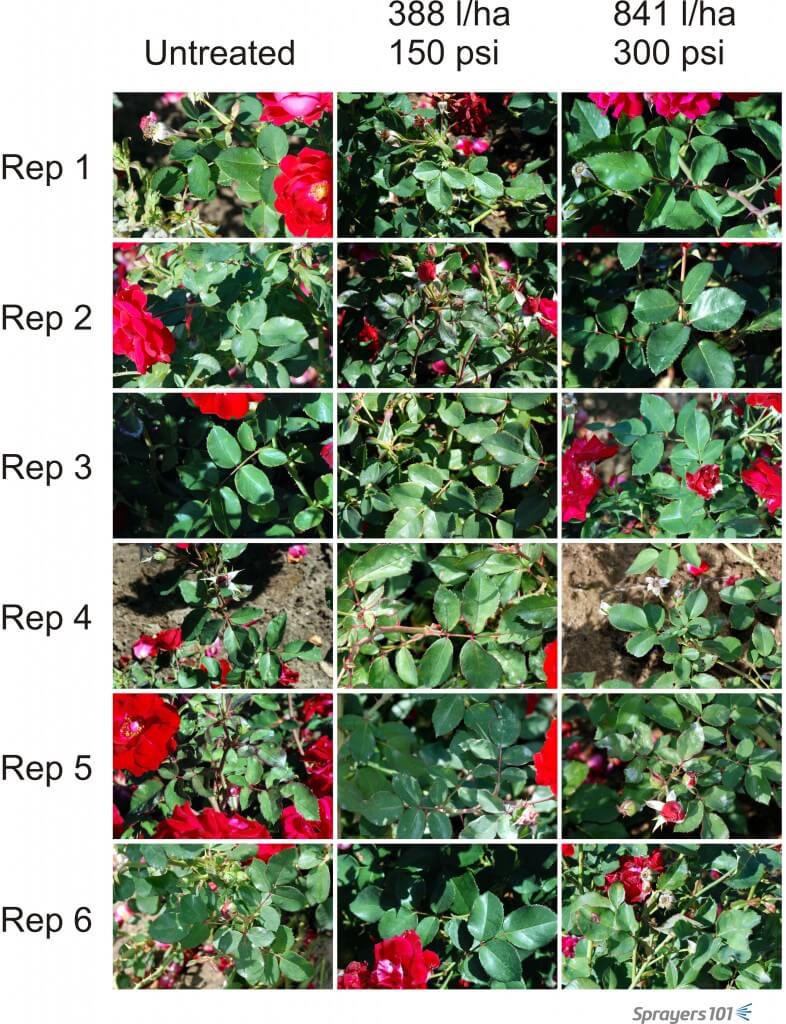
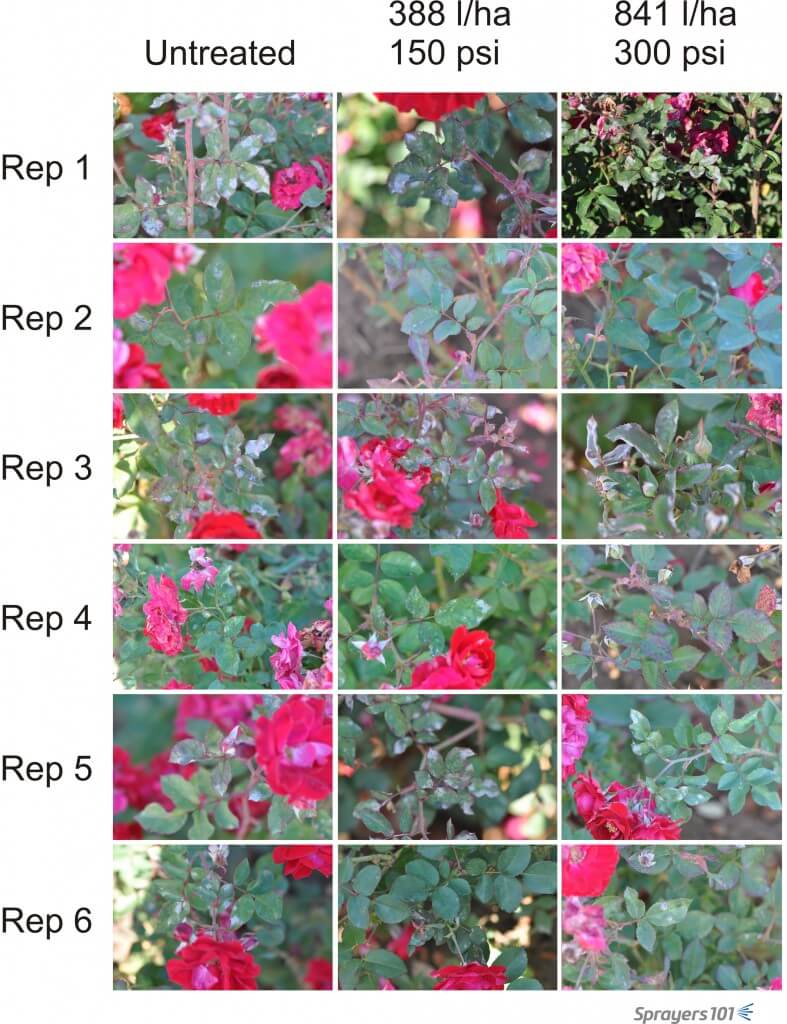
To demonstrate the value of sprayer optimization, we marked out three, 65m x 6.5m blocks in a field of roses. One block was an untreated control. One block was the grower’s traditional set up of hollow cones (D4D45) on 50 cm centres at 300 psi and 3.0 mph (841 L/ha). The third block was the experimental condition where we used an optimized set up of hollow cones (D3D45) on 50 cm centres at 150 psi and 3.0 mph (388 L/ha). We validated this condition using an iterative process to dial in the coverage indicated by water-sensitive paper.
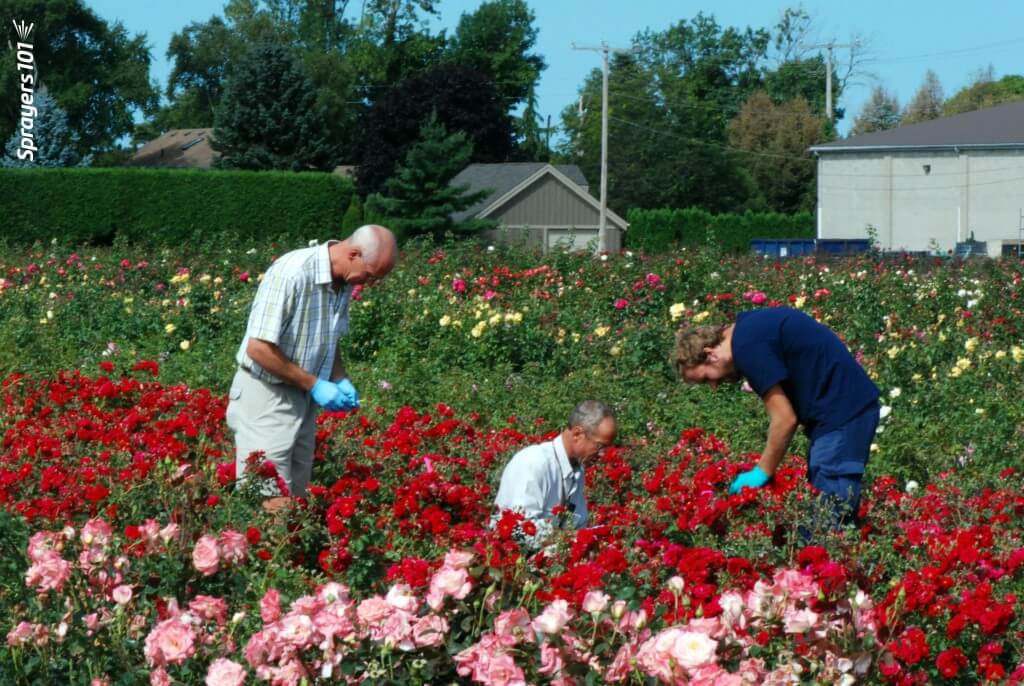
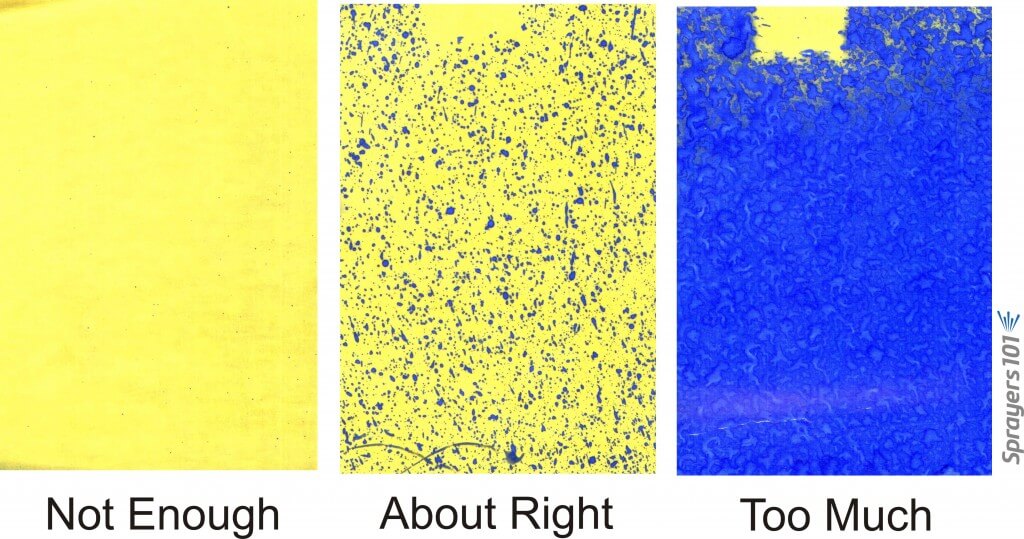
Setting up water-sensitive papers in the rose blocks.Rule-of-thumb fungicide coverage on water-sensitive paper.
One application of Folpet + Nova was made on Sep 19, 2011. Roses were photographed before and after the treatment. The photographs were digitized and the amount of powdery mildew appearing on the upper surfaces was determined as a percent of the total visible leaf area. Six replications were randomly selected from each block.
Visual record of randomly selected roses prior to treatment (September 9).Visual record of randomly selected roses immediately following treatment (September 20).
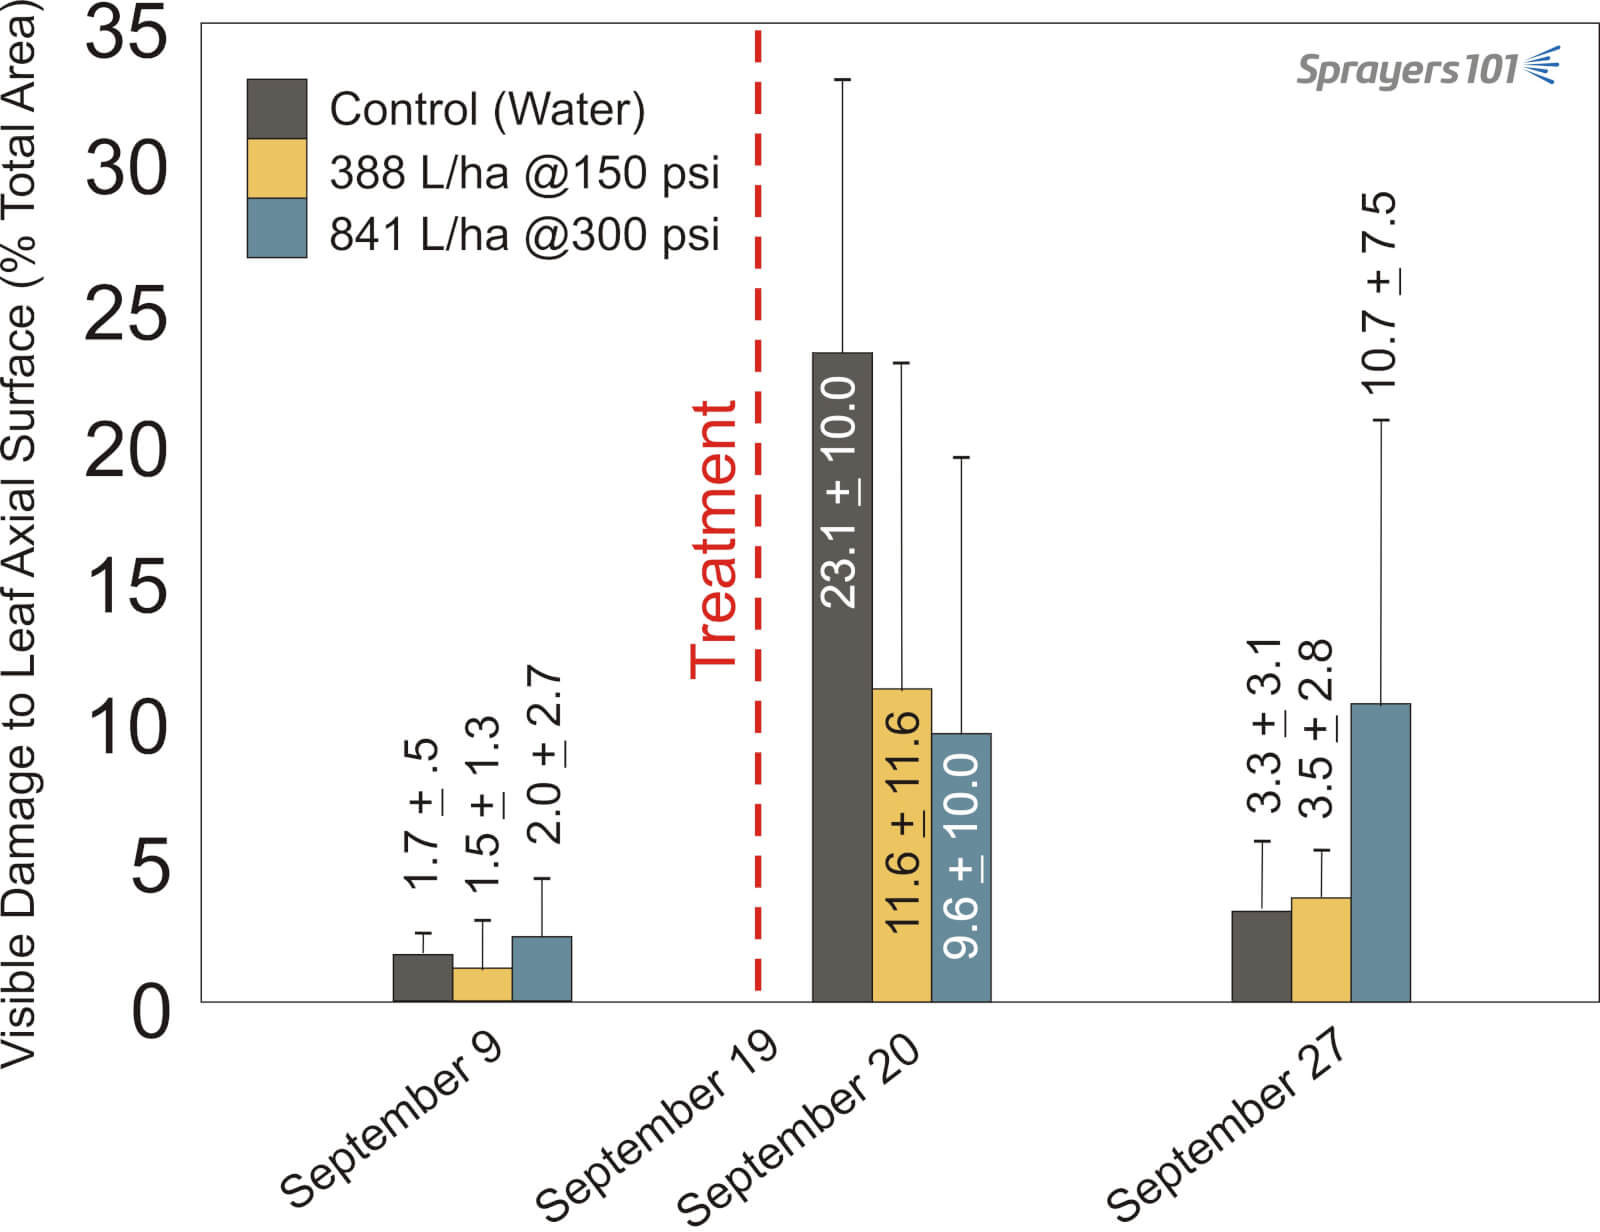
There was no significant difference in the amount of mildew presented in the two sprayed blocks one day after the application (September 20). Eight days after application (September 27), there appeared to be better control in the optimized sprayer set up condition versus the grower’s standard set up. The large standard error bars in the grower’s condition made this statistically insignificant. It is unclear why the untreated block presented with the least visual mildew at this point. This preliminary work demonstrates the value of customized application settings and their potential to conserve pesticide, water, and fuel without compromising pesticide efficacy.
Results of optimizing sprayer set up on the visual occurrence of powdery mildew on rose leaves. Bars represent standard error of the mean. Unclear why control block presented less mildew on Sept 27.
The Ontario Farm Innovation Program and the grower co-operator are gratefully acknowledged for making this research possible.
The Fundamental Relationship, a concept by Professor D. Ken Giles (Emeritus), UC Davis Biological and Agricultural Engineering Department, is a way of talking about calibration without numbers and formulas. It is valuable for teaching concepts important to calibration. Since it is a relationship, it describes the variables needed and how they relate to each other.
We see here that land rate is inversely proportional to application rate. Thus, when land rate (either speed or swath width or both) are increased (and no other factors change), application rate is decreased. Likewise, flow rate is directly proportional to application rate. Thus, when flow rate is increased (and no other factors change), application rate is also increased. When flow rate is decreased (and no other factors change), application rate is also decreased.
The Fundamental Relationship is also a good way to do the math of calibration because nothing needs to be memorized. As long as the units are checked, you can’t go wrong. The Fundamental Relationship works for any sprayer calibration, as long as the units are tracked correctly and the flow rate correlates to the land rate, i.e., the land rate used is the swath that the nozzles (flow rate) are covering.
So, if the flow rate (GPM) used in the formula is for ½ of an airblast set up, the swath width in the land rate calculation would be ½ of the row width. If, for example, it is for a weed sprayer with 2 nozzles, the swath width would be the width the 2 nozzles are covering. Remember to think about this as what area is being covered by the spray:
Flow rate units are straight forward: gallons/minute.
Land rate can be a bit tricky because no one thinks in terms of acres covered per minute.
Land rate is tractor speed × swath width covered by the nozzles used to calculate flow rate.
Land rate in the above needs to be calculated in the units “ac/min”. Since there are 43,560 ft2 in an acre, the easiest way to calculate is to use the swath width in feet, and the speed in ft/min. Multiplied, this then will give you land rate in ft2/min, which can then be converted to ac/min.
Using MPH as Speed
When you measure speed in the field, those who have a speedometer on their tractor will tell you their speed in MPH. To go from a land rate with speed as MPH to ac/min, the following unit conversion is used when multiplying the speed in MPH times the swath width in feet:
Note: speed should always be measured and verified. Speedometers are notoriously incorrect!
Calculating nozzle flow rate (GPM):
You can also use the Fundamental Relationship to calculate the flow rate needed for a desired spray volume (application rate) when you have a set land rate (speed and swath width). This is necessary to help you choose your nozzles. Tractor speed is first determined by checking the coverage-using water sensitive paper or another coverage indicator like kaolin clay, and the fan (using ribbons in the canopy), to go as fast as safely possible while still getting adequate coverage. Swath width for any given field is set. What is left then is to calculate the GPM needed to achieve that application rate at that speed and swath width. This will allow you to select your nozzles based on individual nozzle GPM for a certain pressure.
To get the required GPM for one side of the sprayer, you multiply by ½:
GPM (one side of sprayer) = GPA × [(Miles/Hour × swath width (ft)) ÷ 495]× 1/2
GPM (one side of sprayer) = GPA × [(Miles/Hour × swath width (ft)) ÷ 495]
I’ve seen some folks round up the 990 to 1,000, which makes the above formula easier to remember.
Why I think the “495 formula” is bad for calibration
In my experience of teaching calibration math, folks often want to fall back on the formula they have used instead of trying the Fundamental Relationship. The problem I have with the “495 or 990” formulae, is that with using ground speed in MPH, often the step of measuring speed, a critical step for optimizing spray coverage, is eliminated.
Ground speed is assumed, the speedometer is assumed to be correct, and the entire step of measuring and setting speed is omitted-big mistake! Setting speed using flagging tape in the canopy and looking at the “Fan : Speed : Canopy” interaction is probably the most important step of calibration and optimizing coverage. So, if you must use the “495 formula”, please actually measure your ground speed!
Measuring speed manually
Typically, at least 100 feet are marked off to measure actual speed with a stopwatch. If you measure actual tractor travel time for a 100 foot length, you will likely find most common spraying speeds are timed in seconds. These can be converted to minutes, and then used in the formula for speed as ft/min which is then multiplied by the swath (or row) width in feet to obtain ft2/min, which can then be converted to ac/min.
If swath width is 6 feet, the land rate (or area the nozzles are covering) is calculated as:
264 ft/min × 6 ft = 1,584 ft2/min
In acres covered per minute, we divide by 43,560 ft2/ac to obtain a land rate of 0.036 ac/min. To travel 100 feet at this speed, it takes 0.37 minutes or 22.7 seconds. So, it is not uncommon to time 100-foot tractor runs in 21-23 seconds (which is why you need a good stopwatch). These runs are best done on the type of terrain to be sprayed; and it’s always good to take several times and average.
Remember that the speed is written as distance travelled/time. Sometimes when measuring speed, I’ve noticed that it will be written as time/distance travelled, which gives the wrong number. Track units!
Establishing an airblast nozzling solution is an involved process. We must first define the working parameters and flush out any special circumstances. Then we use an iterative approach to identify suitable nozzle combinations that require minimal changes to the sprayer.
This article outlines my process step-by-step and then applies it to a hypothetical orchard scenario. If readers wish to delve deeper into the variables or the reasoning, several links to supporting articles are provided. Be aware that nozzling the sprayer is the penultimate step in establishing optimal sprayer settings. Operators should first adjust air settings, which includes identifying a suitable travel speed. The last step in setting up any sprayer is to verify you are achieving threshold spray coverage.
Step One: Establish sprayer parameters
Is there more than one sprayer available? In diverse plantings, it may be more efficient to assign a sprayer to blocks that require the same nozzling solution.
How many nozzle positions are there on one side of the sprayer? If the nozzle bodies are roll-over style the operator can alternate between two different nozzles in each position. Some designs have twice as many nozzle bodies as needed. The intent is to assign two unique nozzle solutions in an alternating A-B set-up. This additional capacity gives us some flexibility if needed.
Is this a tower or a low-profile axial sprayer? Generally, we distribute nozzle flow evenly over a tower boom but distribute ½ the flow in the top 1/3 of the boom on a low-profile axial sprayer (depending on canopy shape and density). Air-shear and one-sided sprayers are special cases that are not addressed in this article.
What is the average travel speed, and can the operator easily change it? This process assumes the selected speed achieves a reasonable work rate while optimizing the interaction between sprayer air and the canopy.
What is the average operating pressure, and can the operator easily change it? For sprayers with positive displacement pumps, pressure is easily changed via the regulator. Not so for sprayers with centrifugal pumps. Pressure-based rate controllersempower an operator to dial in their desired volume and are easiest of all .
Step Two: Establish target parameters
What is the row spacing (or spacings)? Some operations include a variety of canopy morphologies and planting architectures.
What is the target volume (or volumes)? Operators often use a range of volumes to reflect the product being applied and the canopy area-density. This process assumes the volume will provide threshold, uniform coverage without misses or excess.
Step Three: Are there any environmental, geographical or adjacency concerns?
Each operation is unique, including conditions that may influence nozzling. For example, open water, sensitive crops, or residential areas adjacent and downwind of the planting may warrant drift-reducing nozzles or require the operator to only spray inward from one side of the sprayer. In another example, dry and windy conditions may require nozzles that produce a coarser spray quality will improve their survivability. Rolling hills and uneven alleys may cause sway that prevents the upper-most nozzles from consistently reaching the target.
Step Four: Find out why the operator is re-nozzling
The answer may reveal the operator’s willingness and ability to make changes to sprayer settings. For example, if their objective is to improve the match between sprayer and canopy it implies a willingness to take a more active role in spraying. Conversely, a less experienced operator might be satisfied with a more robust (i.e., wasteful) set up that does not require many changes between blocks.
Step Five: Determine the highest and lowest boom flow requirements
The following formulae relate travel speed, row spacing, and the desired volume sprayed per planted area to the output from a single boom. I recommend downloading this Excel-based calculator to make the process easier.
US Imperial Formula Output from single boom (gpm) = [(Sprayer Output (gpa) × Travel Speed (mph)) ÷ 990] × Row Spacing (ft)
Metric Formula Output from single boom (L/min) = [(Sprayer Output (L/ha) × Travel Speed (km/h)) ÷ 1,220] × Row Spacing (m)
Using the formula with the appropriate units, enter the highest desired volume, the fastest travel speed and the longest row spacing. This will give the highest rate of flow the boom must satisfy.
Repeat this process using the lowest desired volume, the slowest travel speed and the shortest row spacing. This will give the lowest rate of flow the boom must satisfy.
The ultimate objective is to select a combination of nozzles that can produce these two flows, distributed sensibly along the boom, with no gaps or excessive flow relative to the target. Ideally, the operator should be able to alternate between these two flows with as few changes as possible.
Step Six: Satisfy the highest flow
This step requires a nozzle manufacturer’s catalogue and a calculator (or the downloaded Excel spreadsheet). We must assume the range of available nozzle positions are oriented to span the target canopy with no over- or under-spray.
Divide the highest flow requirement by the number of available nozzles. Hypothetically, a nozzle size that produces this flow would satisfy the highest flow requirement while providing an even distribution along the boom.
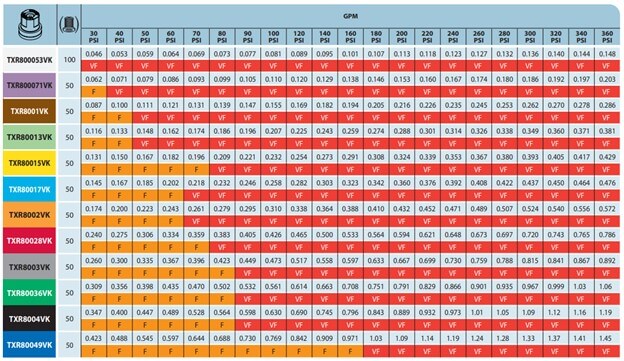
Using the nozzle manufacturer’s catalog, find the flow table for the nozzle you want. Generally, a molded hollow cone nozzle is the preferred choice (e.g., TeeJet’s TXR ConeJet or Albuz’s ATR). If drift is a concern, there are also air induction (AI) hollow cones available. AI nozzles are most effective in the top two or three nozzle positions where drift potential is highest. However, they may require higher flow than calculated to compensate for a reduced droplet count.
Find the operating pressure (it may be in either the column or row heading) and find a flow rate in the body of the table that is as close as possible to your calculated ideal. It’s almost never an exact match, so choose the option that is less than the target rate – not higher.
Imagine placing that nozzle in every available position. Add up all the rates to determine how close you are to the ideal flow. It will likely be less. To compensate, replace the top nozzle on the boom with a higher rate and re-calculate the total flow. Repeat this process, substituting for nozzles with a higher rate, moving top-down along the boom until the flows match.
You have now satisfied the demand for the highest flow.
It is important to note that this process assumes the flow distribution along the boom should be relatively even, perhaps skewed towards the top. However, it is sometimes appropriate to distribute the flow differently to reflect each nozzle’s distance-to-target and the density of the corresponding portion of canopy it needs to spray. This tends to be the case when pairing low-profile radial sprayers with large or trellised canopies, and you can read more about that process in this article.
Step Seven: Satisfy the lowest flow
This is the art-and-compromise part of the nozzling process.
Confirm that the range of available nozzle positions still corresponds to the target. Quite often, the lowest flow is intended for smaller canopies. If so, we may no longer have as many nozzle positions to work with.
Imagine the sprayer is still nozzled for the highest flow per the last step. Leaving the highest effective nozzle on, imagine turning off every second nozzle. Add up the flows and determine how close you are to the lowest rate of flow. It is often still too much. Do not turn off any more nozzles or you may create gaps in the swath.
Instead, return to the nozzle catalogue and re-calculate the flows for the same nozzles, but using a lower operating pressure. Can you make that work? If not, you may have to go back further in the calculation (Step five) and recalculate the lowest flow required using a faster travel speed. This will reduce the demand for flow.
If none of those options are viable you will have to consider re-nozzling. Perhaps that’s swapping a few nozzles to lower rates. Hopefully this only requires the operator to flip a roll-over position, but it may mean using a wrench to remove caps and swap nozzles.
Once you’ve satisfied the lowest flow, the hardest part of the process is complete.
Step Eight: Satisfy the other permutations
The last step is no different than what we’ve already done. Go back to Step Five and calculate the flow for each spraying situation. That is, each unique combination of row spacing, travel speed and target volume. Using the nozzles already on the sprayer, adjust the pattern of nozzles in use (and pressure and/or travel speed if required) until each unique flow requirement is satisfied.
Step Nine: Record the setups, nozzle the sprayer and test the coverage
Be sure to clearly record the sprayer settings required to achieve each flow. Purchase the nozzles and take the time to test each set up using water sensitive paper to ensure coverage is achieved.
A working example
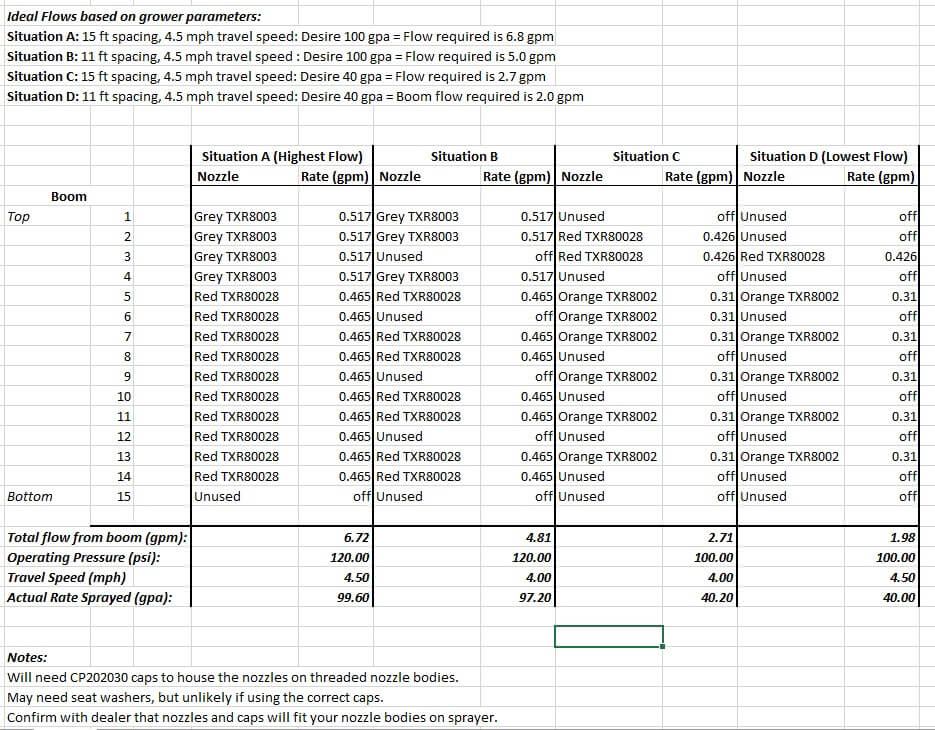
Let’s apply this process in a hypothetical orchard. I’ve included a screenshot of the spreadsheet I use to record the final nozzling solution (below) but feel free to design your own. It includes the nozzling solution for this example.
Our orchard is a 50 acre operation with both 11 and 15 foot row spacings. They have one tower sprayer with 15 nozzle positions on one side and they are not roll-over bodies. The operator wants to apply a 40 gpa volume (concentrated) and a 100 gpa volume (dilute). Their preferred travel speed is 4.5 mph and preferred operating pressure is 140 psi, but they are willing to change them if required.
We use the Excel calculator to work out the ideal highest and lowest demands for flow:
I usually shut off the lowest nozzle position because it almost never aims at the target. Let’s divide the high flow of 6.8 gpm by 14 available positions to give us an average output of 0.48 gpm per nozzle. This operator wants to use TeeJet TXRs, so using their table (below) we see that at 140 psi the Orange ’02 is too low and the Red ‘028 is too large. If we drop the operating pressure to 120 psi, the Red ‘028 is much closer at 0.465 gpm, so let’s do that.
A quick check gives us our current boom flow: 14 positions × 0.465 gpm per nozzle is 6.51 gpm of boom flow. We wanted 6.8 gpm, so let’s go up to the Grey ’03 in the top three positions. Now it’s 4 × 0.517 gpm + 10 × 0.465 gpm = 6.72 gpm. That’s close to our ideal 6.8 gpm, so let’s lock that down. If you want to see what this is in gpa, you can plug the value into the Excel calculator to discover it’s 99.6 gpa. Pretty darn close to our target 100 gpa.
Now using that nozzling arrangement, let’s see if we can satisfy the lowest flow requirement by shutting off every second nozzle position, leaving the highest position on. Doing so reduces us to two Greys and five Reds, totaling 3.36 gpm. That boom flow is much too high compared to the 2.0 gpm we need. However, in our hypothetical orchard, this block has shorter trees so we don’t need the highest nozzle. That drops us to only one Grey and a new total of 2.84 gpm. Good try, but it’s still too much.
Let’s reduce the operating pressure from 120 psi to 100 psi, which is as low as I like to go. According to TeeJet’s table, the Grey produces 0.473 gpm and the Red produces 0.426 gpm at this pressure. This gives us a new total of 2.60 gpm. Still too high! Well, let’s raise our travel speed from 4.5 mph to 5.0 mph and recalculate the lowest flow for Situation D:
This still won’t do it, and driving that fast (even if it’s possible) would change our air settings too drastically. Having exhausted all the easy options we have no choice but to re-nozzle the sprayer for the original lowest flow requirement.
Returning to the TeeJet table we see the best fit is to spray at 100 psi using one Red TXR80028 and five Orange TXR8002s. It’s a lucky break that our 1.98 gpm has come so close to the 2.0 gpm of flow we wanted.
Now let’s work out the best arrangement for the other permutations, Situation B and C. We need 5.0 gpm and 2.7 gpm, respectively. For Situation B, let’s use the nozzling solution from Situation A. We see that shutting off four nozzles gets us very close at 4.81 gpm or 97.3 gpa where we wanted 100 gpa. As for Situation C, let’s work from the nozzling for situation D. By adding a few more nozzles from that set, we can manage 2.71 gpm or 40.2 gpa.
Finally, we record all the settings (refer back to the spreadsheet image). We will need four Grey TXR8003s, ten Red TXR80028s and six Orange TX8002s per side, so 40 nozzles in total (plus a few spares for each rate). We will need to spray at 120 psi for Situation A and be prepared to shut off a few nozzles for Situation B. Situation C will require 100 psi and an entirely different nozzling and we will have to shut a few of them off for Situation D. Not only have we determined a nozzling solution, but we have revealed an efficient order for spraying the blocks that will require as little manual change to the sprayer as possible.
Summary
There is no one right answer to the question “which nozzles do I need” but there are certainly wrong answers. Bear this in mind when you buy a sprayer and the dealer offers you a factory-standard nozzle setup. Apply this process to your operation and be sure to use water sensitive paper to confirm the coverage and to make informed changes where required.
We’ve identified and discussed shortcomings in the content and design of today’s pesticide labels in an earlier article. From the perspective of the spray applicator, the information needed most often can be difficult to locate, anachronistic, contradictory, subjective or even missing from the label altogether. To truly encourage an applicator to read and follow the label we need a consistent, concise and clear format that summarizes critical content.
To that end, we have worked with growers, university/government extension and industry to develop a prototype we’re calling the “Label Summary Sheet”, or LSS for short. We presented the concept in a series of public presentations in western Canada as part of the RealAgriculture TechTour Live event in 2018. You can watch a recording of part of that event at the end of this article.
The LSS does not replace or interpret the current label, which is a legal document. It is a summary intended to accompany it. At this stage the LSS is simply a proposal. These documents are not intended for use right now; we hope they will grow and change for the better as they stimulate discussion.
Consider this metaphor: You have just purchased a laptop. When you unbox it, you get an in-depth instruction guide that covers everything from operation to trouble shooting and includes all the legal riders. It’s a daunting technical document that you likely won’t read unless something goes wrong. Knowing that, manufacturers include a graphic and accessible quick start-up guide that summarizes the most common and critical issues. It doesn’t replace the instruction manual, it just augments it. If you can’t find what you need in the quick start-up guide, you are referred to the more fulsome description in the instruction manual. Think of the pesticide label as the instruction manual and the LSS as the quick start-up guide.
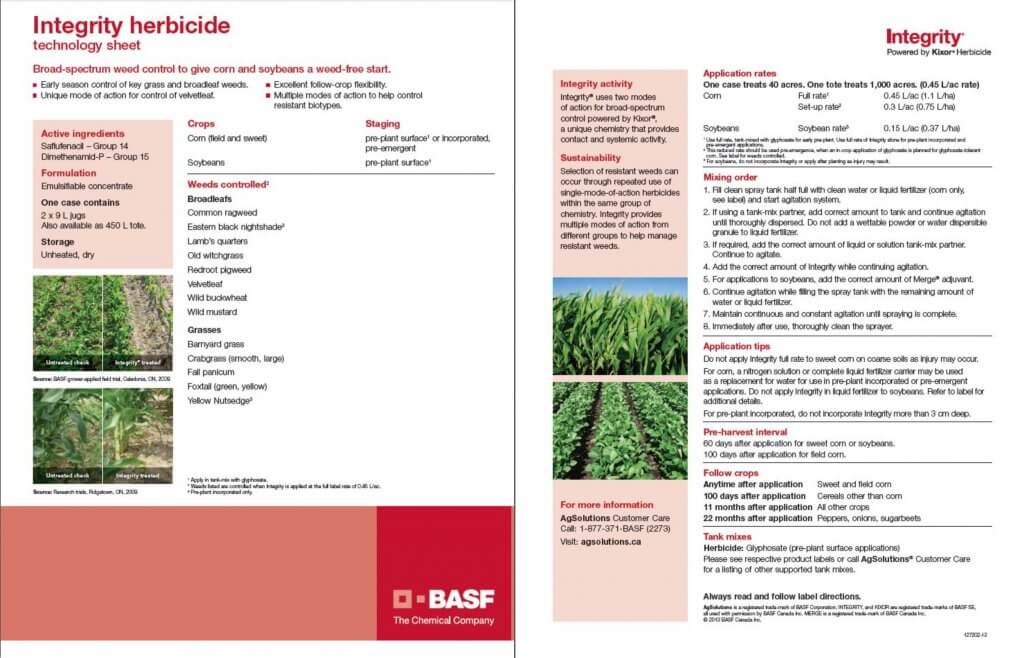
Some agrichemcial companies recognize this need and have developed short documents to summarize key aspects of the label, but they are inconsistent and brand-specific marketing documents that do not always contain the information we are proposing. Here, for example, is the technology sheet for Integrity herbicide.
We tested the versatility of our LSS format by summarizing four diverse pesticide labels. Our selections are not intended to imply that these labels are particularly deficient. Only that they are commonly used, somewhat complicated and represent the spectrum of pesticide categories and application methods.
Download and look at the variety of labels we have summarized as examples. They are available here:
Note that each LSS features the same section headings and a relatively consistent layout, no matter the manufacturer. Generic icons are used to illustrate content and make it easier for users to navigate without language barriers. The LSS are black and white to facilitate reproduction and refer back to their respective pesticide labels (i.e. the online PDF, not the booklets that come with the pesticides).
LSS Sections
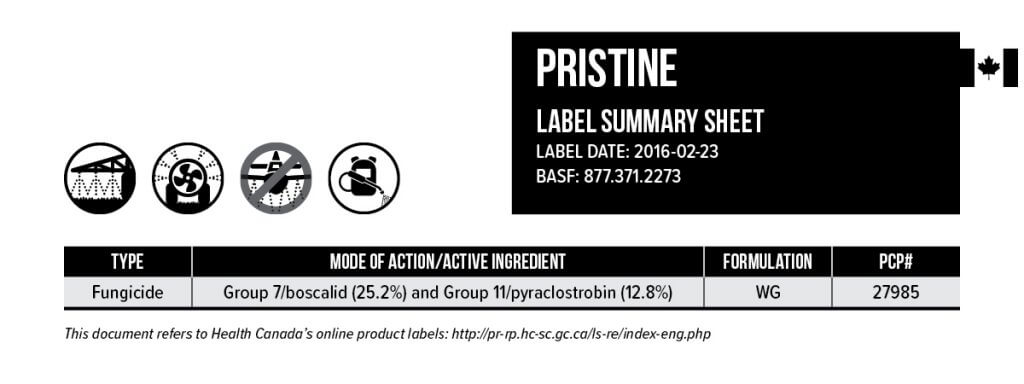
Here is the Pristine LSS broken down by section to highlight the key features.
1. Banner Section
The banner is at the top of every LSS. It gives the commercial product name and the date to ensure the LSS reflects the current pesticide label. Four icons represent the most common application technologies: Horizontal boom sprayer, airblast, aerial and handheld. If an application method is prohibited, a banned symbol appears (such as aerial in this case). Note we have left room for RPAAS (UAV’s) anticipating the day we have products registered for that technology. The table notes the type of pesticide (e.g. fungicide, insecticide, adjuvant, etc.). The mode of action and active ingredient(s) are noted, as well as the formulation and the Pest Control Product number.
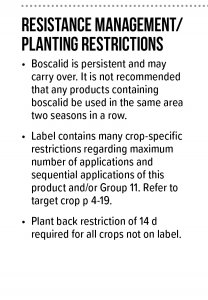
2. Resistance Management / Planting Restrictions
Intended to provide key information on managing pesticide resistance, this section reflects label content about carry over and the rotation of active ingredients. Further, to aid in application decisions, it reflects any restrictions around maximum number of applications, sequential applications or plant back issues following use.
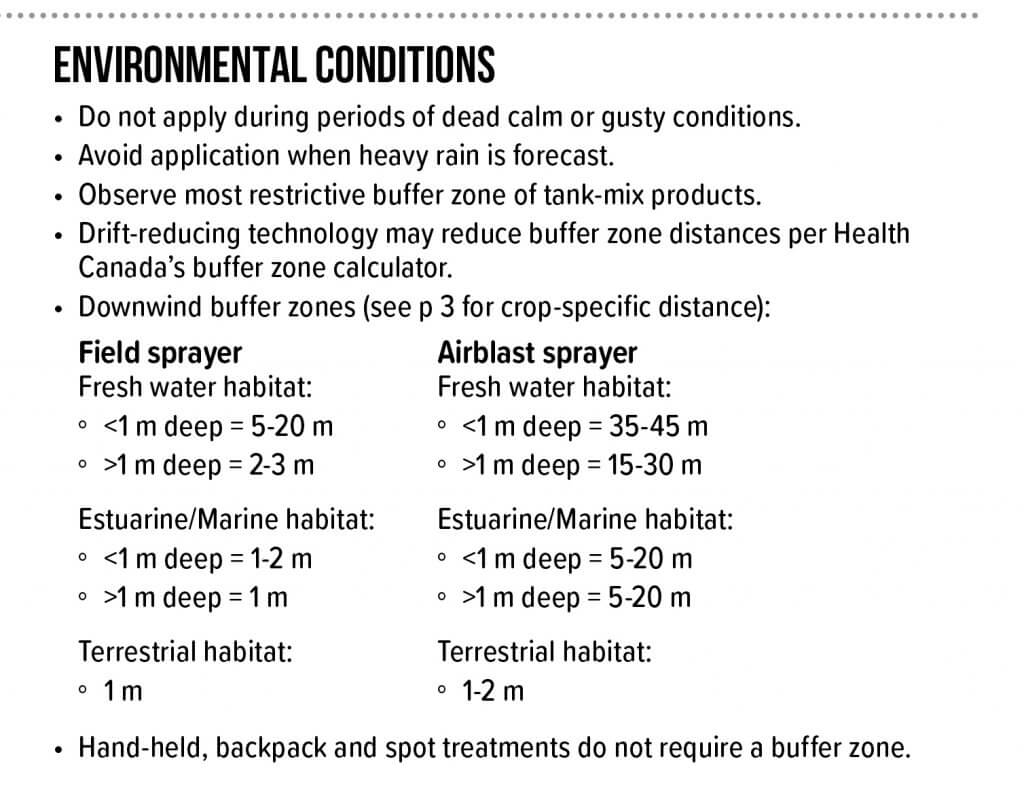
3. Environmental Conditions
Any restrictions regarding weather conditions during or after application are noted here. This includes set-backs or buffer zones that reflect method of application and the nature of the adjacent or downwind area in question.
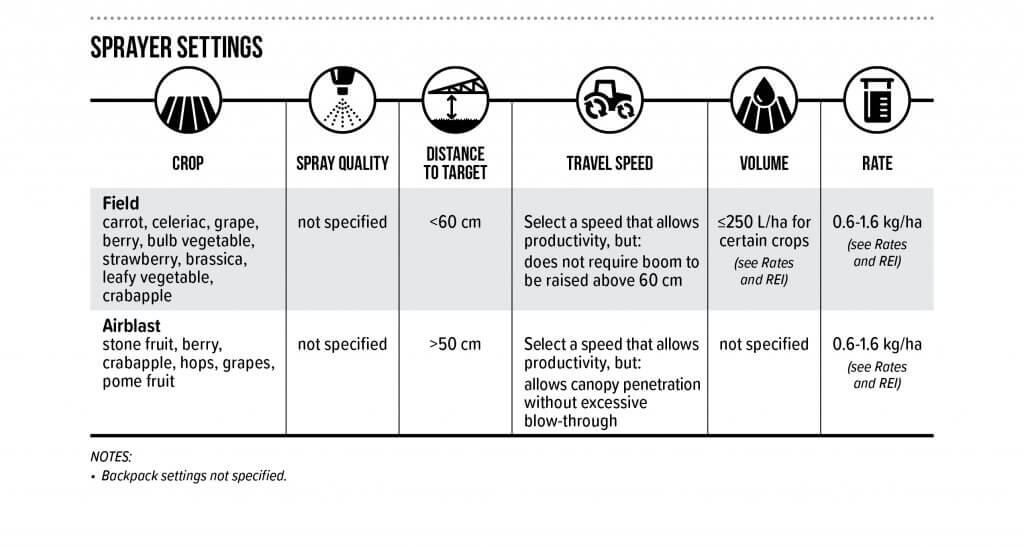
4. Sprayer Settings
This section includes the six most commonly asked questions an applicator has when calibrating or adjusting their sprayer prior to use. It is organized by target crop and method of application. When the label provides a high level of detail, the user is referred to the correct page. Note the use of graphics to quickly direct the reader to the information they need. Any additional qualifications found in the label relating to sprayer settings are indicated in the notes beneath the table.
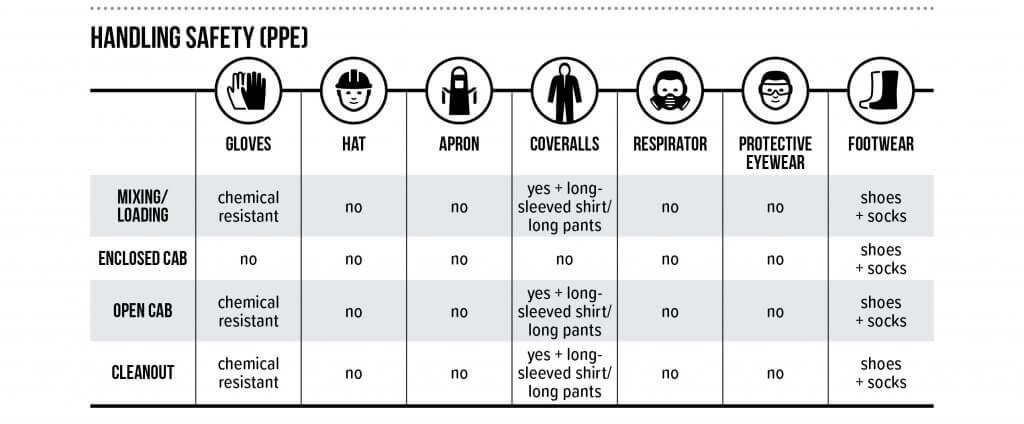
5. Handling Safety (PPE)
The concept for this simple and graphic table originated in France, and was communicated to us by Dr. Carol Black of Washington State University. This unambiguous format encourages the use of PPE while ensuring the handler uses the appropriate level of protection for each activity.
6. Mixing
As operators tank mix more products to curtail resistance, improve efficacy or improve productivity, there is a greater chance of chemical or physical incompatibility. This section summarizes any restrictions noted in the label. Learn more by downloading Purdue Universities’ publication “Avoid Tank Mixing Errors“.
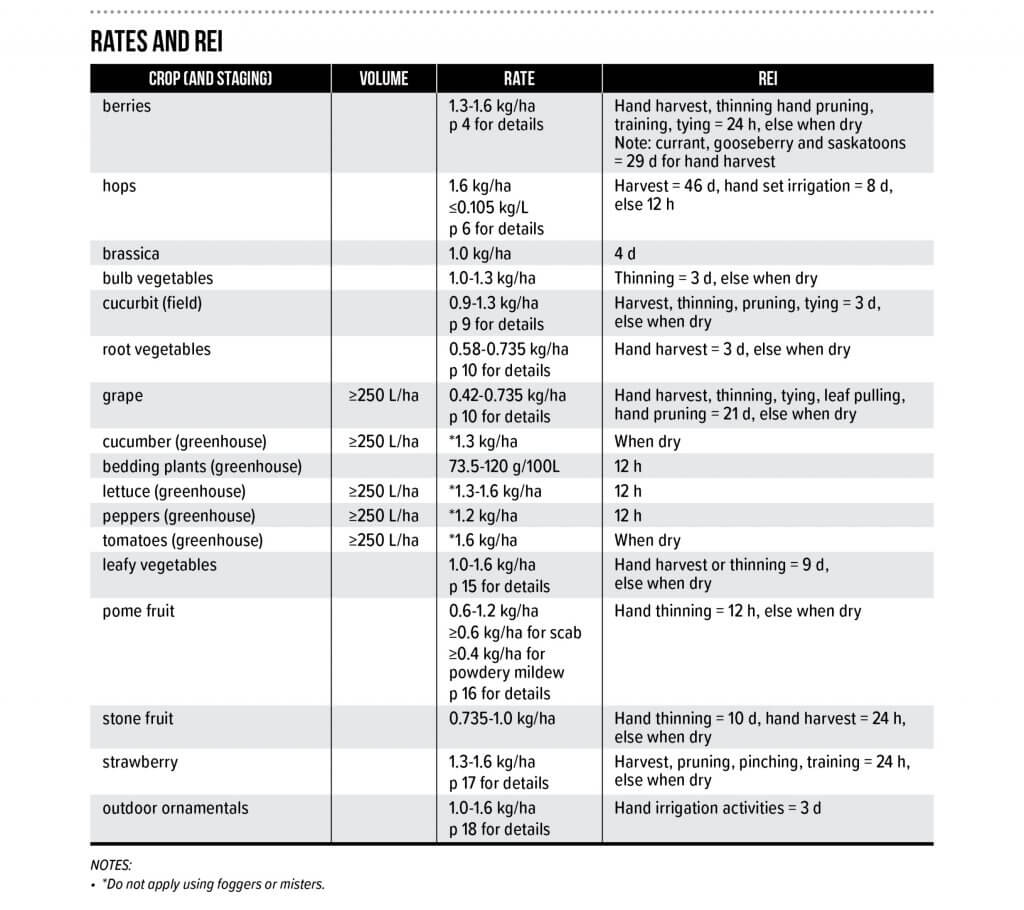
7. Rates and Restricted Entry Intervals
This table can be quite complicated depending on the pesticide label. It summarizes the rates, volumes and restricted entry intervals by crop. It reflects the broadest range of product rates listed in the label. Restricted entry duration is affected by the post application activity, and this is captured in the REI column. If more detail is required, the user is referred to the appropriate page(s) of the label. Any additional qualifications found in the label relating to rates, volumes or REI are indicated in the notes beneath the table.
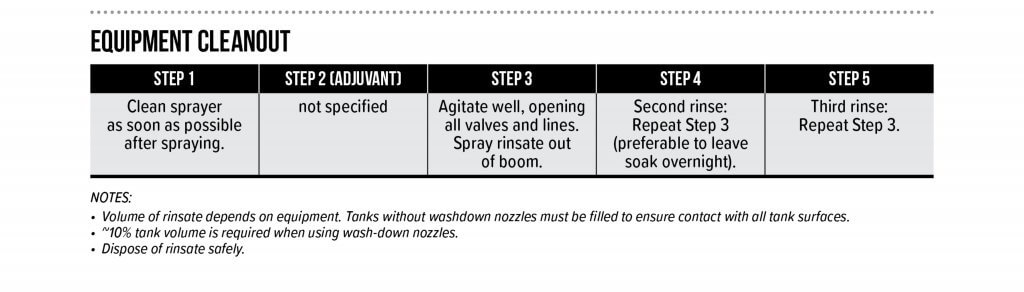
8. Equipment Cleanout
Finally, equipment cleanout is summarized (where possible) in a sequence of steps. When the pesticide label is silent on the cleanout procedure, the user is provided with the triple rinse protocol, which is generally held to be the industry best-practice.
Adoption
To date, this proposal has been made to Croplife Canada, the American Society of Agricultural and Biological Engineers (ASABE), an International Organization for Standardization (ISO) mirror committee (Equipment for crop protection) and more than 1,400 growers and stakeholders across Canada.
Our suggestion for adoption of the LSS (in its current form or something similar) is that regulatory agencies commission a working group comprised of representatives from grower groups, industry and government to oversee the process. The working group would support registrants as they populate (or update) the LSS template when a new product is submitted for registration, or as part of the natural review cycle.
Should the registrant encounter duplicate, missing or contradictory information while completing the LSS, it should be considered an opportunity to remedy the problem on the pesticide label. This will clarify the safest and most effective use of the pesticide for the applicator, who is currently forced to selectively ignore or interpret such errors. To our minds, this was the intent of the original labelling system, and the inclusion of the LSS is a simple and effective way to achieve that goal.
The Confusicol Sketch
In 2018 we participated in Real Agriculture’s TechTour Live event that toured four major cities in Western Canada in four days. We presented the “Confusicol sketch” as a light-hearted way to open a discussion with the audience on the strengths and weaknesses of Canadian pesticide labels and how the Label Summary Sheet might be a viable supplement. Here’s one of the live takes, warts and all. Turns out live sketch comedy is tricky…