“Sprayer calibration is an important part of any crop protection program.” Everyone says so, so it must be important. But what exactly are they asking you to do, and why?
When delivering presentations I often take the opportunity to ask audiences to define airblast sprayer calibration. Their responses cover a wide range of activities that can be rolled up into three related, but quite different, definitions:
Sprayer maintenance inspection
Adjusting sprayer configuration
Validating sprayer output
Ask a group of managers, sprayer operators, agrichemical reps, gov’t regulators and equipment manufacturers to define “calibration”. Be prepared for very different answers.
Traditionally, calibration refers to Number 3: Validating sprayer output, but all three are required to ensure a safe, effective and efficient application. Don’t panic – your workload didn’t just triple.
There is a time and a place for each of these activities. Some should be performed more often than others, but none of them are difficult. This is easier to accept when you realize that only a portion of the spray-day is actually spent spraying. Filling, travel time, cleaning and calibration-related activities are all essential components.
Let’s consider each activity.
Sprayer maintenance inspection
This is more maintenance than calibration (e.g. is it properly connected, is it worn out, is it plugged, is it leaking?). It should not be confused with spring start-up or winterization. For those lucky readers in temperate regions, “winterization” is preparing the sprayer for long-term storage post season… we just use antifreeze.
The maintenance inspection is the morning walk-around, no different from what any operator of heavy machinery must do before starting their work day. Learn more about sprayer inspection and download a helpful checklist in this article.
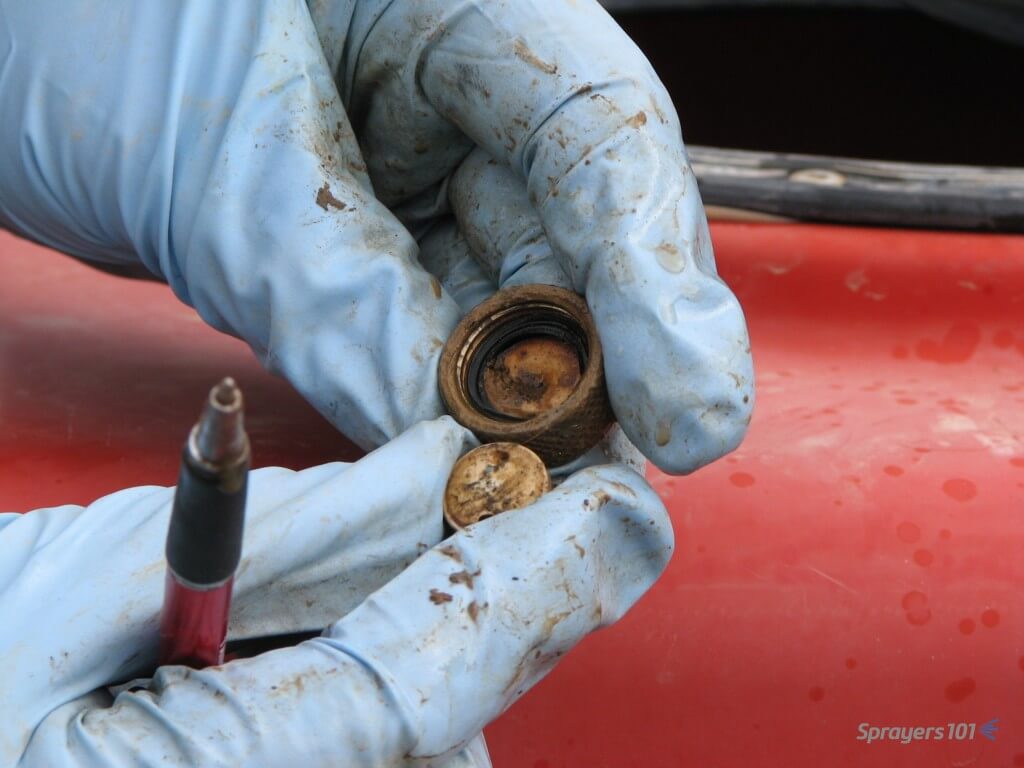
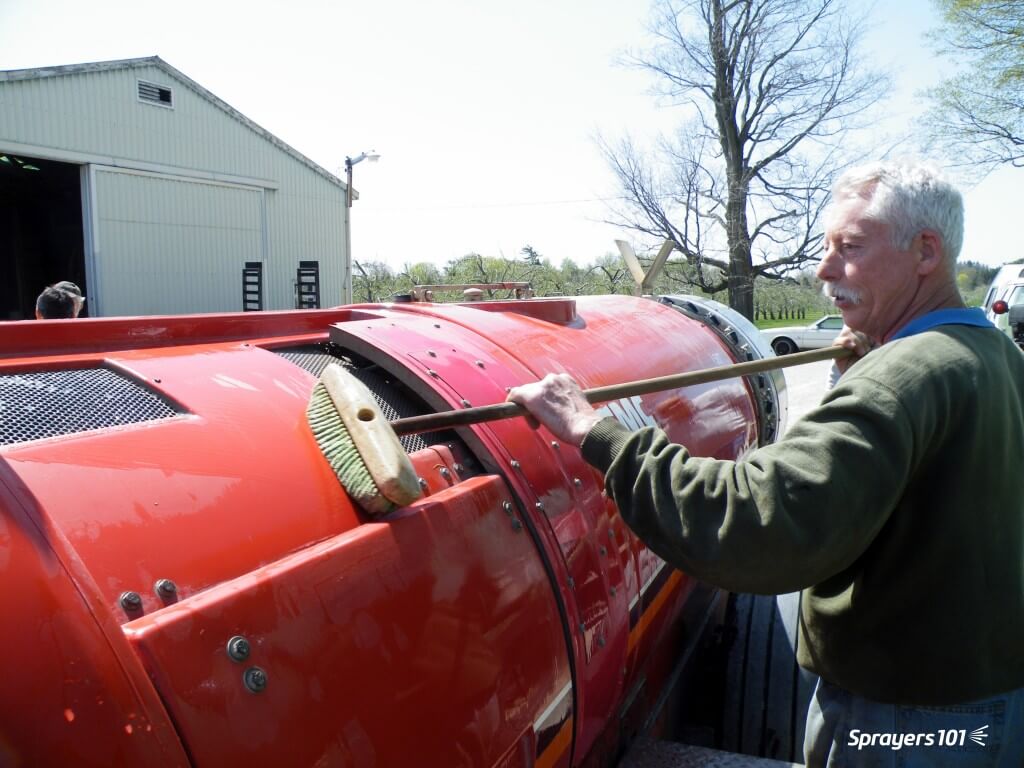
Here are some nasty disc & cores revealed during a calibration workshop. It certainly explained the poor performance the operator was complaining about. Is it time to replace yours? Photo credit – Dr. H. Zhu, Ohio.
Adjusting sprayer configuration
This is an ongoing process whereby an operator makes minor sprayer adjustments (e.g. pressure, travel speed, air settings) to reflect environmental conditions, the product’s mode of action and the nature of the target. Would you apply an insecticide to semi-dwarf pears in high wind using the same sprayer settings to apply a fungicide to nursery whips in high humidity? I hope not.
The process is more intensive at the beginning of the spray season and again around mid-season (e.g. petal fall or whenever the crop changes sufficiently to require a reassessment). It’s described step-by-step in many articles on this website as well as in Airblast101.
Yes, it requires an investment of time and effort, but the feedback makes subsequent adjustments faster, easier and more intuitive. There are strategies to reduce the number of adjustments required. Large operations can assign sprayers to blocks with similar crop architecture (e.g. one sprayer works large orchards, another sprayer works young or high-density orchards). Smaller operations can change the order in which crops are sprayed.
Validating sprayer output
This accounting activity ensures the sprayer is applying the intended rate at the intended speed. “Sprayer math” is really only theoretical; It helps the operator plan for how much pesticide and water must go in the tank and how long the job will require. How the sprayer actually performs may be a different story.
According to 1992’s “Tools for Agriculture” a horse can deliver 500 watts of power over 10 hours, but the camel can deliver 650 watts over six. And you thought establishing tractor speed was difficult. Photo Credit – R. Derksen, Ohio. Date and location of photograph is unknown.
Validating output, or calibrating, confirms that each nozzle delivers the desired rate and that the sprayer travels at the desired speed, so the crop receives the correct dose with no unexpected left-overs or shortages.
The operator should perform these activities at the beginning of the season and after any significant change to the sprayer set-up. Examples include new nozzles, new tractor tires, using a different tractor or after replacing a pump or any lines/hoses.
The validation (i.e. calibration) process is explained in our articles on testing airblast sprayer sprayer output and travel speed.
Conclusion
Be sure to perform all three calibration-related activities as required. This will keep records up-to-date, improve your spray coverage, and save you from unexpected sprayer malfunctions – almost all of which are preventable.
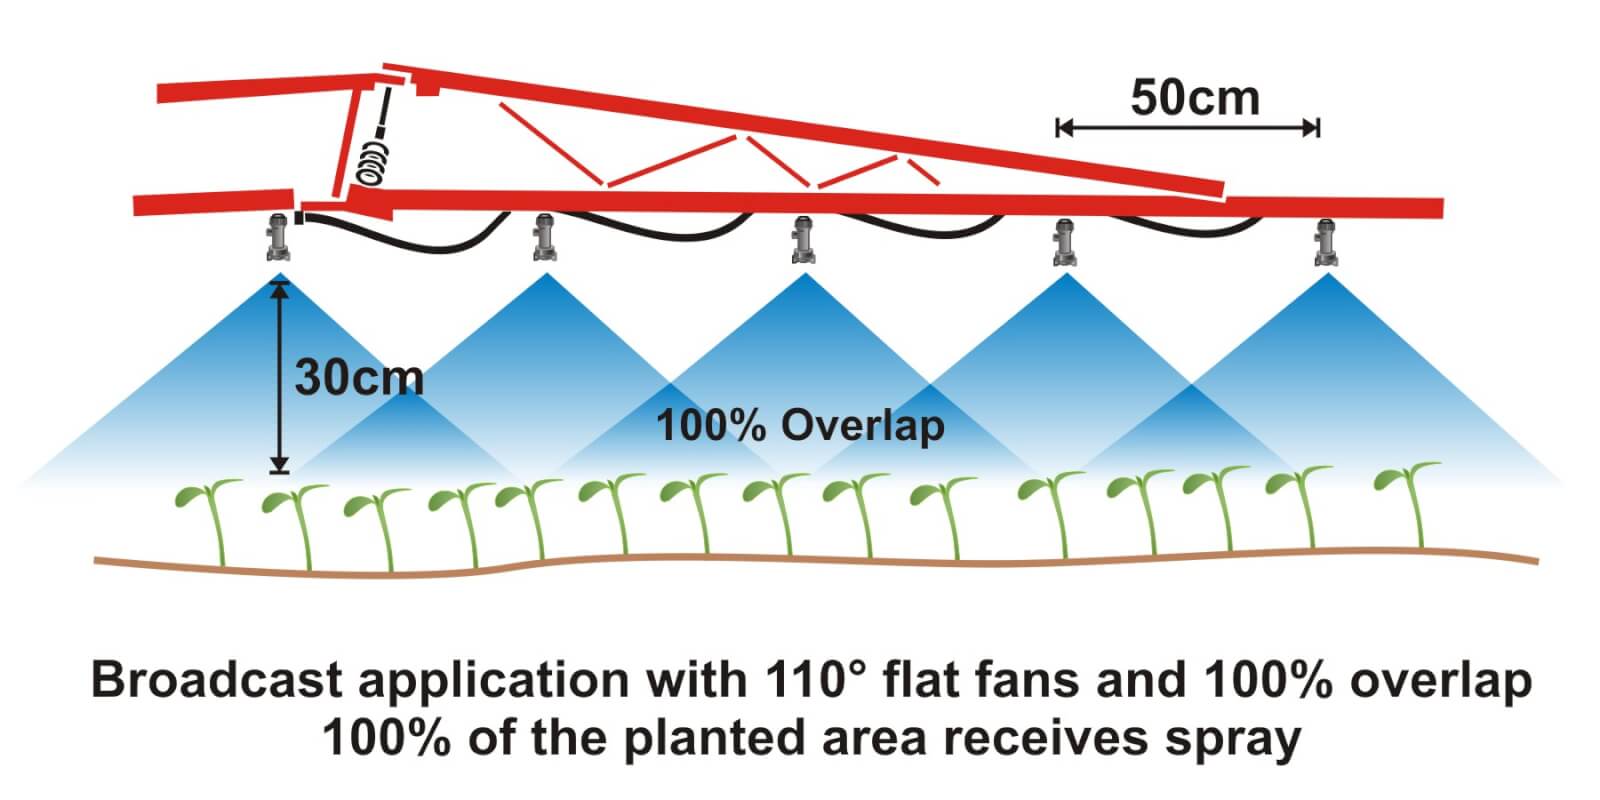
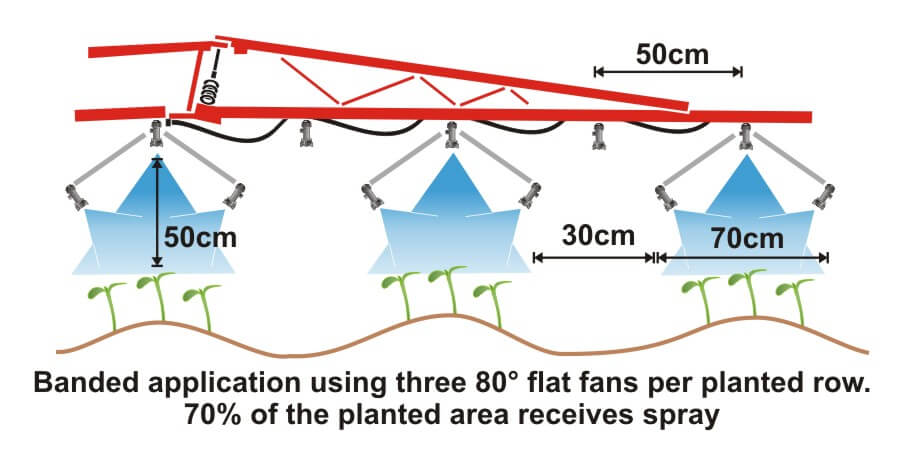
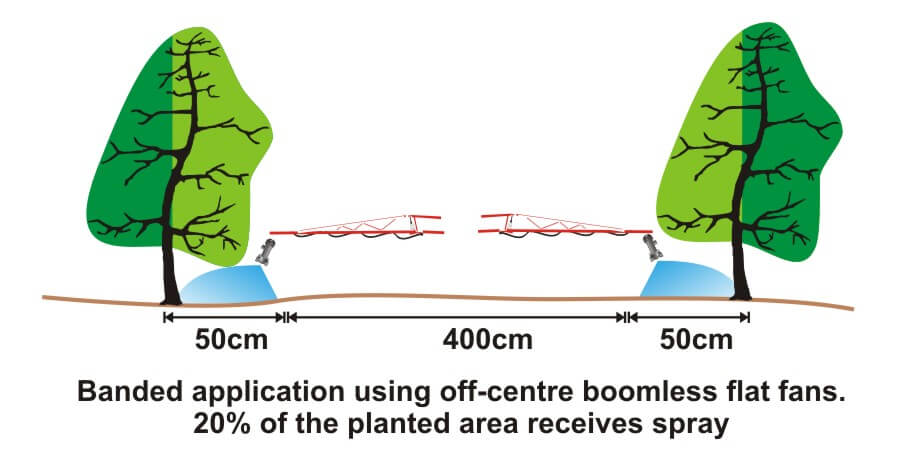
Where crops are planted in rows, growers can save on chemical costs and reduce potentially wasted spray by performing banded applications. A banded application is treating parallel bands (Figure one), unlike a broadcast application where the entire area is treated (Figure two). This means only a portion of the field or orchard/vineyard floor receives spray, so the total amount of product applied per hectare (or per acre) should be less for banded than for broadcast.
Figure 1Figure 2
Banded applications are used in many situations, including:
Applying herbicides right over a crop during planting, both for pre-emergent or post-emergent crops.
Applying insecticides/fungicides by “directed spraying” using drop hoses or row kits; the latter is pictured in Figure three.
Carefully spraying herbicide between the rows to control weeds in the alleys of an established crop (Figure one).
Applying herbicide under fruit trees or grape vines to control weeds (Figure four).
Figure 3Figure 4
It’s easy to make mistakes when calculating product rates for banded applications and these can be costly errors: too little means poor control and too much means wasted product and possible crop injury. This article describes how to calculate sprayer output and product rate for common banded applications.
Step One: Determine broadcast volume
Pesticide labels typically list broadcast product rates (e.g. amount of formulated product per hectare or acre). In this example, let’s say the label recommends a broadcast product rate of 500 ml of formulated herbicide applied using 100 litres of spray mix per hectare (i.e. added to 99.5 L water).
Step Two: Establish sprayer settings
Select a travel speed that is safe, gives decent efficiency and doesn’t compromise coverage. For this example, we’ll say the sprayer moving is at 8.0 km/h.
Select a band width that completely covers the target row and some of the adjacent area where control is desired. Band width should be measured along the ground for soil-applied products or along the top of plants for post-emergence products. We’ll use Figure one for our settings: bands are 50 cm wide on 100 cm centres. We’ll say that a single nozzle swath can treat the band, and that we’re spraying 2 hectares of planted area.
Step Three: Calculate the banded sprayer output
We can calculate how much of the planted area actually receives spray using this formula:
[band width (cm) ÷ row width (cm)] x total planted area (ha) = actual sprayed area (ha) [50 cm ÷ 100 cm] x 2 ha = 1 ha
For completeness, here’s the US formula: [band width (in) ÷ row width (in)] x total planted area (ac) = actual sprayed area (ac)
From this we now know that we should be able to go twice as far on a tank spraying a banded application as we would a broadcast, because we’re only spraying half the planted area.
Step four: Calculate the nozzle output
Use the following formula to convert the broadcast output into the banded output:
[broadcast output (L/ha) x travel speed (km/h) x (swath width (cm) ÷ number of nozzles per swath)] ÷ 60,000 = nozzle output (L/min) [100 L/ha x 8 km/h x (50 ÷ 1)] ÷ 60,000 = 0.67 L/min
For completeness, here’s the US formula: [broadcast output (gal/ac) x travel speed (mph) x (swath width (in) ÷ number of nozzles per swath)] ÷ 5,940 = nozzle output (gal/min)
If multiple nozzles were contributing to the swath, such as in figure three or figure four, this formula will account for it. You still mix the labelled product rate at a ratio of 500 ml of herbicide to 99.5 L water, but as we determined in step three, we should be able to spray twice the planted area using a banded application as we would a broadcast application.
Warning! Watch your units. You may be familiar with other formulae for calculating your output. Do not mix and match formulae or parts of formulae. For example, here is another Metric option for determining L/min. It employs different units so it requires a different constant:
[broadcast output (L/ha) x travel speed (m/min) x (swath width (m)) ÷ number of nozzles per swath)] ÷ 10,000 (m2/ha) = nozzle output (L/min)
Step Five: Use the nozzle catalogue to find the right nozzle
Using a nozzle manufacturer’s catalogue, select a nozzle that gives the desired spray quality (usually coarser for herbicides) and will produce the 50 cm swath we’re looking for (which can be adjusted a little using boom height). Always choose to operate a nozzle in the middle of its pressure range.
Step Six: Calibrate the sprayer (i.e. double-check)
Follow your typical calibration process and make minor adjustments until the nozzle discharge per minute results in the desired banded output. A rate controller will handle this on larger sprayers, but if you don’t have one you can make small adjustments to speed and pressure until the desired output is achieved. Ideally, if your math was right, these changes won’t be needed.
When performed correctly, banded applications are a great way to focus your efforts on the target, saving time and money.
Here are a few additional resources if you’d like to learn more, or work with a few online calculators:
Next to sprayer math, cleaning the sprayer is one of the more distasteful aspects of airblast spraying. It’s time-consuming, you never really know when you’re finished, and sprayer manufacturers and pesticide labels offer only limited guidance.
Clean sprayer rinsate often looks and smells exactly like contaminated sprayer rinsate.
When airblast sprayers are not cleaned as often or as thoroughly as they should be, it creates problems:
Unnecessary operator and environmental exposure.
Residue in (or on) the equipment can damage sprayer components.
Carry-over can deposit damaging or unlabelled residues on crops.
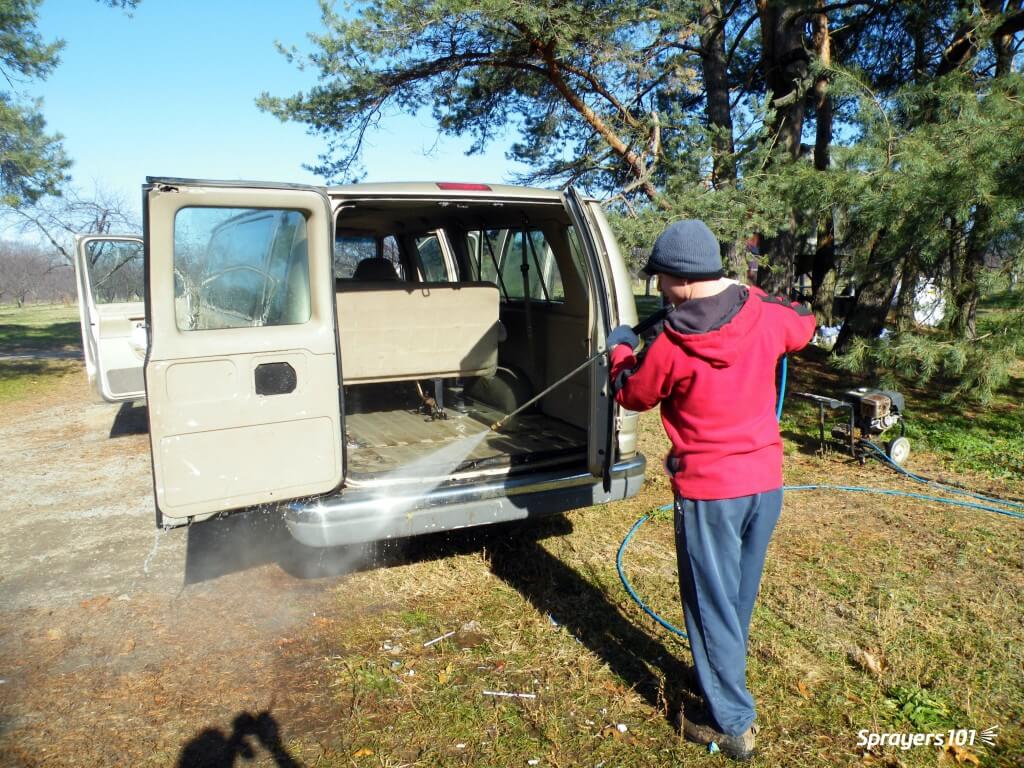
Keeping the airblast sprayer clean, inside and out, as part of the spray day. Ken Bell is pictured giving his FMC a bath. This picture was staged – he normally wears PPE and so should you.
Dr. Tom Wolf (Agrimetrix Research and Training), defines cleaning as two processes. Rinsing is the dilution of any remaining spray solution. Cleaning is rinsing with additional steps to decontaminate sprayer components (e.g. filters, nozzles).
Rinsing
1. Rinse ASAP
Don’t let residue sit in (or on) the sprayer, even if you plan to use the same product the next day. Multiple studies have shown that products adsorb onto, and absorb into, plastic and rubber parts. They form hard-to-clean residues when left to dry.
Think about cleaning oatmeal or egg yolk off dishes – it’s far easier if you clean them before they dry. Rinse right away, while the sprayer is still wet.
2. Minimize the volume remaining in the sprayer
Experience, sprayer math, and familiarity with airblast sprayer design helps minimize the volume remaining in the sprayer. Rate controllers and volume-monitoring systems (e.g. Ontario’s Accu-Volume) provide real-time feedback so the operator can speed up or slow down to empty in the right place. Minimizing any remaining volume makes rinsing far more effective.
Even an “empty” sprayer can still retain several litres of standing volume in the sump and lines. Operators should know this volume. Never Drive-and-Drain to empty standing volume onto the ground.
Standing volume from the booms allowed to drain to a holding tank via the bottom nozzles.
3. Dilute the remnant: The Triple Rinse
Rinsing the system multiple times with low volumes (aka The Triple Rinse) is more effective at reducing pesticide concentration than a single, high-volume rinse. See for yourself using this clever dilution calculator.
Once the sprayer is “empty”, use clean water to fill the tank to 10% of its capacity (or add 10 parts water to one part standing volume) for the first rinse. The use of such low volumes may not be possible with centrifugal systems where the tank must be filled above the top of the pump for priming. Know your sprayer design.
Agitate and circulate it through the entire sprayer for a few minutes. Spray out the rinsate and repeat the process two more times. Where do you perform this? Where does the rinsate go? Read on.
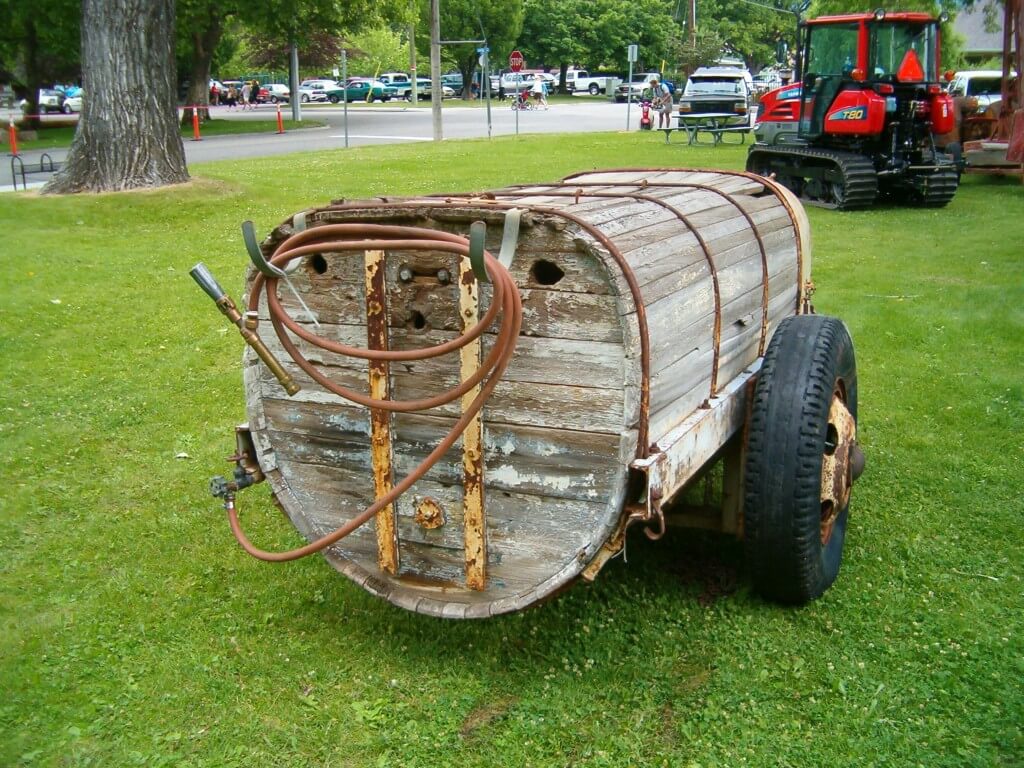
A wooden sprayer tank. You know that had to be tough to clean.
Where does the rinse water come from?
Nowadays, all airblast sprayers should include an onboard tank-rinse system consisting of a clean water tank and tank-rinse nozzles inside the tank. They may even include a pressure wand to rinse the exterior.
Sadly, most airblast sprayers do not have these features. But, aftermarket rinse kits are available. If you are considering installing a rinse system, check out the continuous rinse system.
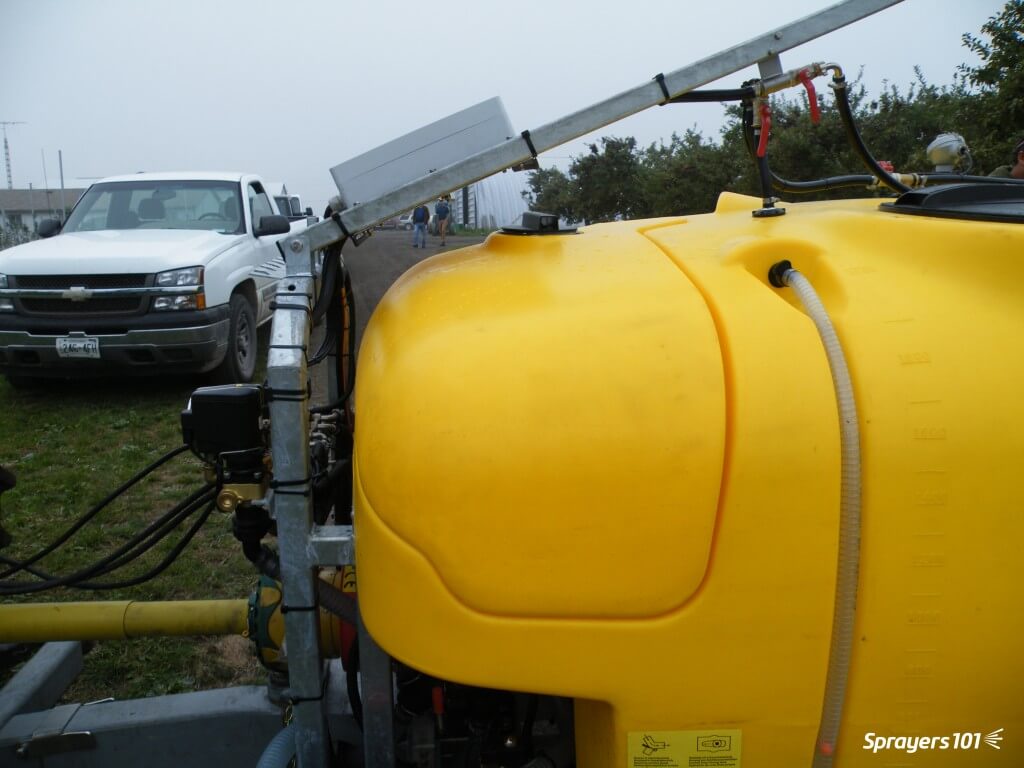
Left- Product-pump-powered water tank, Right- external-pump-powered water tanks. Images from Paolo Balsari’s (DiSAFA) “Sprayer Cleaning: Importance and Phases” at AAB Sprayer Cleaning Workshop, Oberbozen, Italy. October 2019.The Hol features a separate 150 L tank to supply clean water to its automatic tank rinse system.
Alternately, the clean water for this process can be carried on a support vehicle or sourced from holding tanks strategically-located near the planting.
Where to rinse
Precautions must be taken to ensure rinsing is performed away from wells or open water. It is best to perform the triple rinse in the crop that was just sprayed. The dilute rinsate can be flushed through the lines and sprayed out through the nozzles onto the crop. You can choose to overspray treated areas again at a lower dose (label permitting), or use a hedgerow or target row that has been set aside for this purpose.
As regulatory agencies concerned with environmental contamination re-evaluate chemistries critical to horticulture, it becomes even more important for airblast operators to manage rinsate responsibly.
While it is best to rinse the sprayer exterior in the planting as well, most return to the farm. Too often, the entire rinsing procedure takes place on-farm, on crushed gravel. This creates point-source contamination: a leading source of off-target pesticide movement. Washings should be secured (e.g. on an inflatable or permanent loading/mixing pad.
Cleaning an airblast sprayer on an inflatable pad. Images from Victoria Nelissen’s (pcfruit, Belgium) “On-farm systems to avoid point pollution” at AAB Sprayer Cleaning Workshop, Oberbozen, Italy. October 2019.
In Europe, operators are encouraged to collect contaminated rinsate for safe disposal. There are four systems in use:
Bioremediation – Employs a bio-active matrix (E.g. Biobed).
Evaporation / Dehydration – Residue following evaporation is collected and disposed of (E.g. Heliosec).
Physico-chemical – A combination of filtration and active carbon.
A complete cleaning is required prior to long-term storage, or when residues from previous applications are known to cause physical or chemical antagonism with scheduled applications. Perform the following steps after a complete triple rinse:
One. Remove the suction and in-line screens. Remove nozzle strainers and nozzle tips. These will be inspected and cleaned shortly.
Two. Fill the tank about 1/2 full of water and add an appropriate tank cleaning adjuvant. For example, ammonia at 3%/100L water will raise the pH and helps remove those products whose solubility benefits from this. A detergent at 1.0 kg /150 L water will remove the oily layer formed by EC formulations. Commercial cleaners like All Clear or Cleanout conveniently combine these properties in one jug. Be aware that adding a surfactant or a commercial cleaner can generate a lot of foam, so have de-foamer handy.
Note: Ammonia cleaner products do not “neutralize” pesticides; they raise the pH, improving the solubility of some products. Do not use chlorine bleach! It is not as effective a cleaner as ammonia and can form chlorine gas when mixed with ammonia-containing liquids.
Three. Collect a bucket-full of cleaner solution from the tank. Using a brush, clean the suction and in-line screens, and the nozzle strainers and tips.
Four. Meanwhile, agitate and circulate it the cleaner solution through the entire sprayer for five to 10 minutes. Open and close any lines or valves during this process to ensure everything is exposed to the rinse.
Five. You might spray a small volume through the booms, but drain the vast majority through the plumbing system. Collect some for cleaning the exterior of the sprayer.
Six. Clean the exterior of the sprayer. High pressure washers and scrubbing with a push broom works well. Studies in Europe have shown the vast majority of residue is found on the sprayer head (i.e. fan outlet and boom area).
Pressure washers are handy tools on a farm, and they’re fun to use, too. However, they can cause a great deal of damage if they are used to wash delicate things like engine parts, electronics housings, or sealed bearings. Use caution when power washing an airblast sprayer.Relative external contamination on a low profile axial airblast sprayer. Image from Paolo Balsari’s (DiSAFA) “Sprayer Cleaning: Importance and Phases” at AAB Sprayer Cleaning Workshop, Oberbozen, Italy. October 2019.
Seven. Rinse it all off. Replace all parts unless preparing for long-term storage.
Sprayer math is important. It ensures the operator applies the correct product rate and has enough to complete the job. But, it assumes the airblast sprayer is behaving as expected… and it often doesn’t. After confirming the airblast travel speed, use one of the following methods to assess sprayer output. There are pros and cons to each.
The area method
Operators that claim the sprayer empties in the same place every time assume everything’s alright. They are performing a variation on the area method.
Essentially, you fill the sprayer with enough water to spray one hectare (or acre) and then spray that area. If the tank empties where expected, you know your output rate (i.e. volume / area). But, there are a few problems with this method:
Most operators don’t have an accurate test area marked off, and even when they think they know the area, measurements prove otherwise. They’re always amazed when this happens.
The area method has poor resolution. It reveals the total output but does not assess individual nozzles. For example, partially-blocked nozzles and worn nozzles average out (we’ve seen it). Rate controllers provide whatever pressure is required to match the desired output, masking individual nozzle problems.
The dip stick method
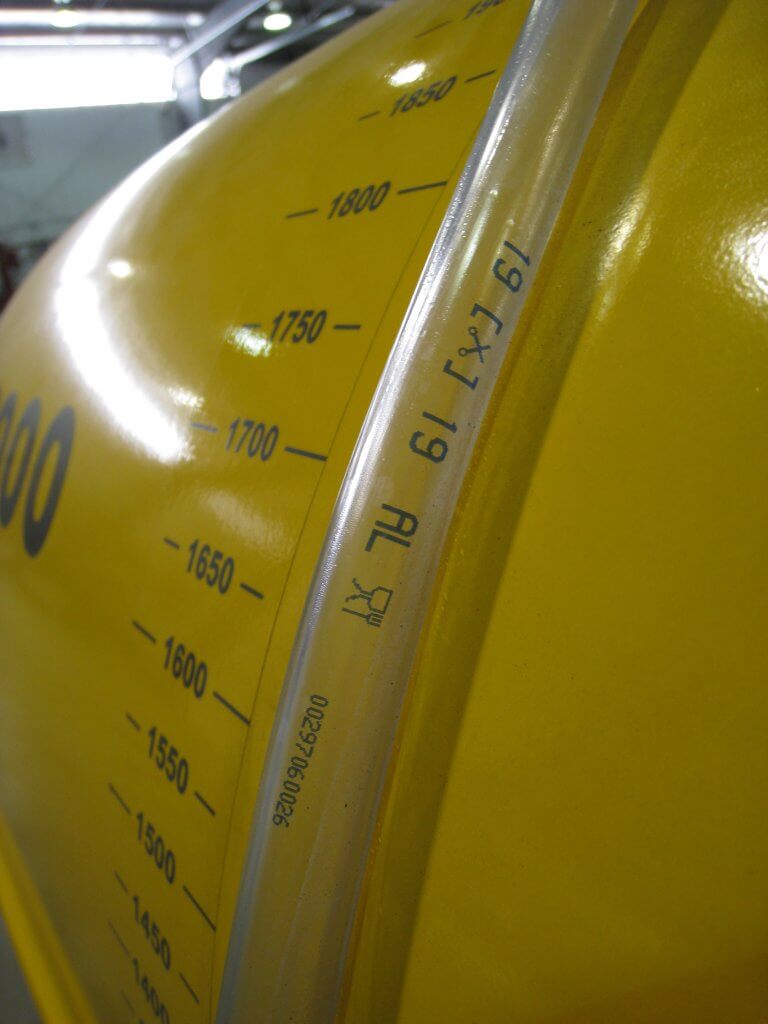
Another method is to fill the sprayer to a known volume using a flow meter, while observing a sight level or a graduated dip stick. Then, while parked, the operator sprays for a given amount of time and determines the difference in the volume remaining in the tank.
This method can be defeated if volume is misread. It’s an easy error to make if the sprayer is parked on a grade, or the dipstick shifts in a tank with a rounded bottom. And, of course, it also masks individual nozzle problems.
Sight levels can be misleading when the sprayer is parked on a grade. They are often opaque and hard to read.
The timed output method
The preferred method is to measure the output of each nozzle individually. We performed a review on several timed output methods here. It can be messy and time consuming, but it’s accurate. Appropriate personal protective equipment is required to perform the timed output method – expect to get wet.
1. Fill the rinsed sprayer half-full with clean water and park it on a level surface.
2. With the fan(s) off, bring the sprayer up to operating pressure. Start spraying with all nozzles open (closing any will change the pressure).
3. You will need 1 meter (3 feet) of 2.5 cm (1″) diameter braided hose (have a second, longer hose to reach the top of a tower sprayer). It should be stiff enough that you can slip it over a nozzle body while holding the other end. Use it to guide flow into a collection vessel, held with your other hand. The hose not only reaches the top nozzle on towers, but it lets foam dissipate before it gets to the vessel.
4. When the flow from the hose is steady, direct it into the collection vessel for 30 seconds (a partner with a stopwatch is very helpful). It is preferable to collect for a minute because it improves the accuracy.
5. Determine and record the nozzle output per minute. Graduations on plastic collection vessels are unreliable. It’s preferable to weigh the output on a cheap, digital kitchen scale. One milliliter of clean water weighs one gram. Don’t forget to subtract the weight of the vessel (this is called taring) and double the output if you only collected for 30 seconds.
Interpreting the results
Once you have recorded all the outputs, you will have to convert the output to U.S. gallons or liters per minute, depending on units in the nozzle manufacturer’s catalogue (see common conversions below).
Replace any nozzles that are 10% (or preferably 5%) more or less than the rated output. This not only indicates a rate problem, but likely a problem with droplet size as well. If enough nozzles are worn, consider replacing all of them. Nozzles should go on as a set, and come off as a set (unless replacing a broken tip, of course). This can be an expensive proposition for large airblast sprayers, but it is part of operational costs.
Don’t assume new nozzles are accurate. We’ve found +/- 5% flow variation right off the shelf. Keep your receipts.
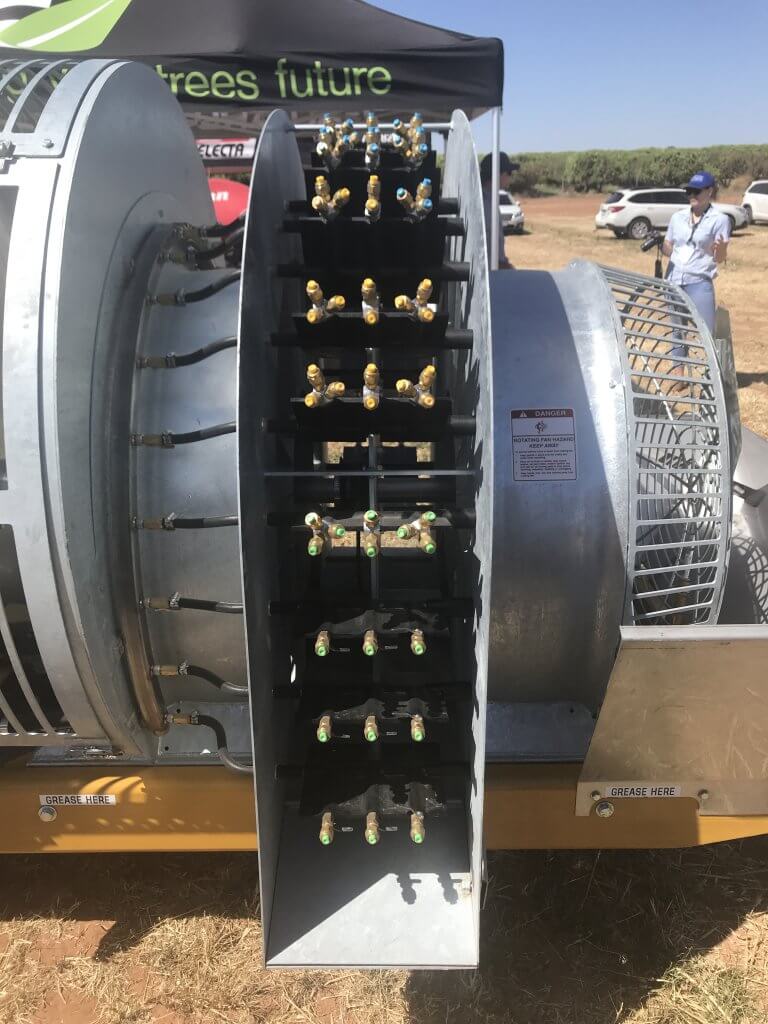
Testing and replacing nozzles is an important part of sprayer operation, no matter how many there are. This Air-O-Fan is nozzled for Australian almonds.
Helpful conversions
Anyone that has tried the timed output method in Canada knows the pain of our Metric-esque (Mocktric?) units. We’re an odd hybrid because our label rates are in metric, but our nozzles and many of our sprayers are US Imperial. You can find a complete collection of conversion tables here, but the most common calculations are reproduced below:
If collecting in ounces, converting to U.S. Gallons per minute:
If collecting in millilitres or grams converting to U.S. Gallons per minute:
If collecting in ounces, converting to litres per minute:
If collecting in millilitres or grams converting to litres per minute:
If collecting in ounces, converting to Imperial gallons per minute:
If collecting in millilitres or grams converting to Imperial gallons per minute:
A more sophisticated option
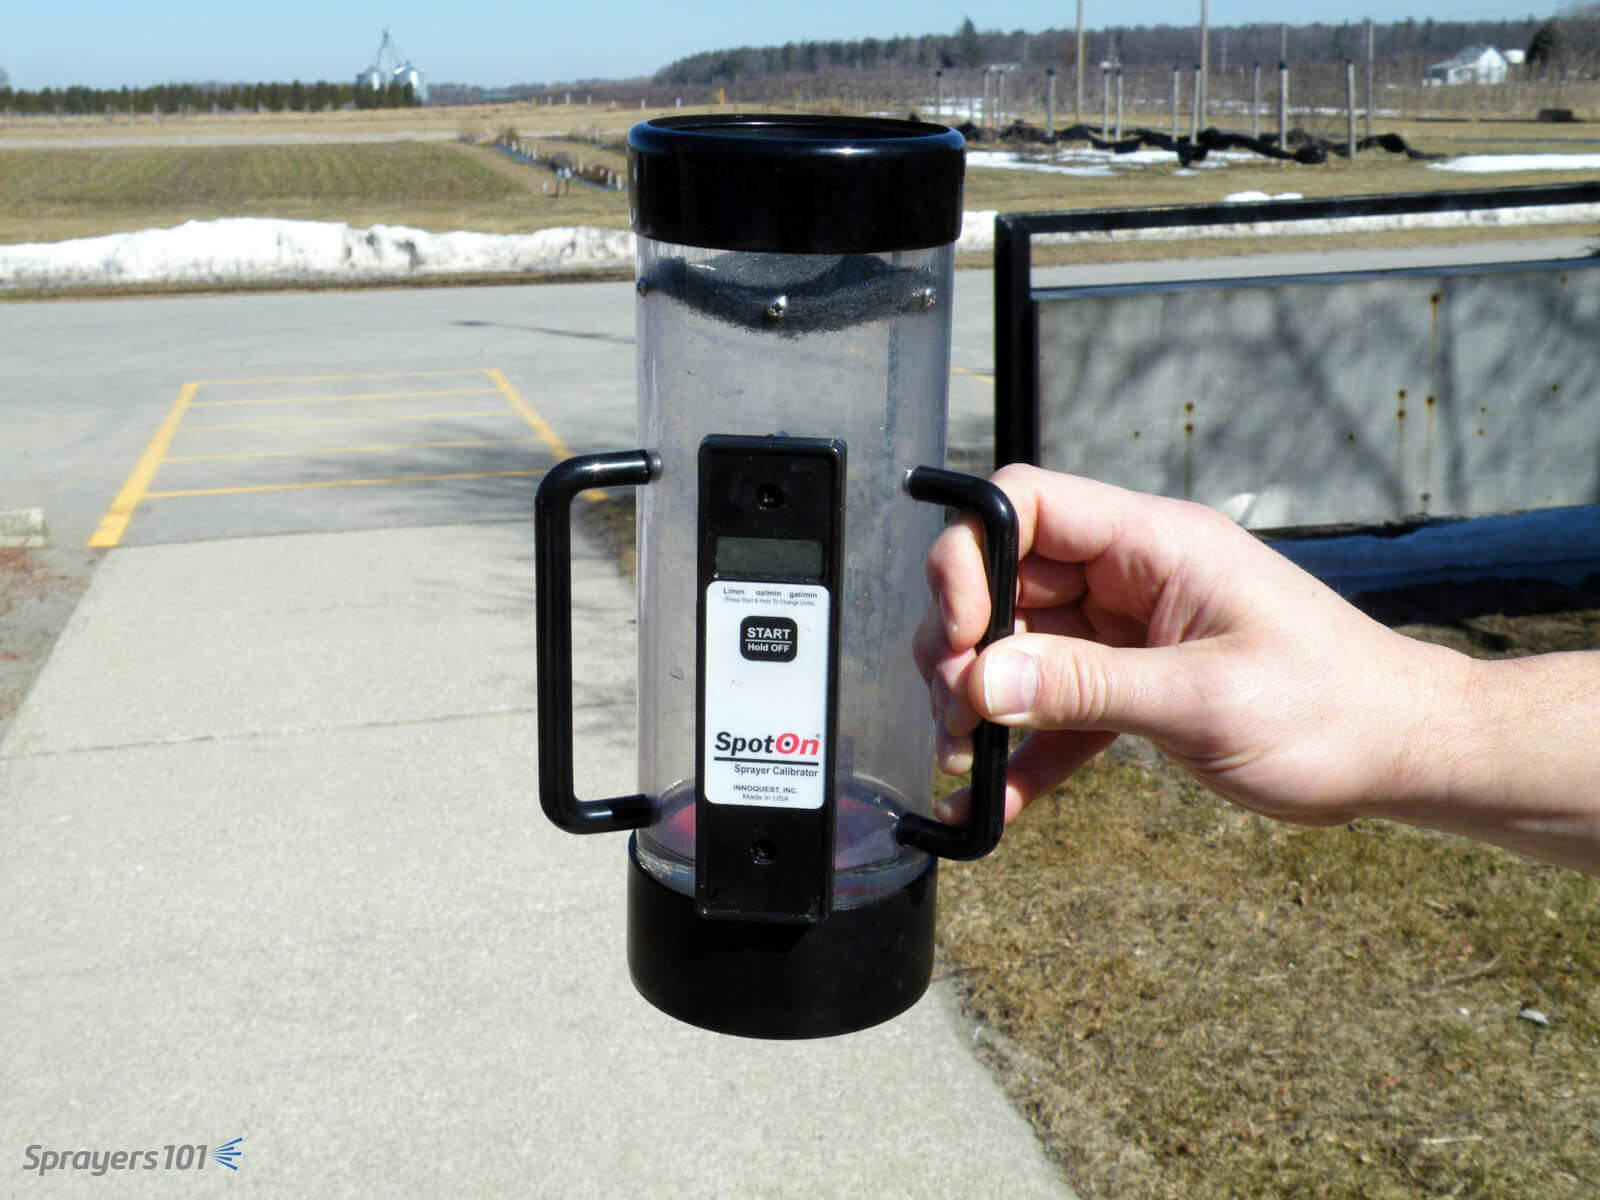
The timed output method is slow and requires math. You can avoid both problems by using electronic calibration vessels like the Innoquest SpotOn SC-4. We’ve tested both, and they are as accurate as weighing the output – but much faster.
They can, however, be fooled by foam. We’ve had good results using a length of braided hose to direct the flow and dissipate most of the foam. Typically, foaming means the sprayer wasn’t rinsed enough.
The SpotOn calibration vessel is easier, faster and more accurate than the classic pitcher-and-stopwatch approach to timed output tests. The SC-4 (pictured) is for airblast and SC-1 is for field sprayers.
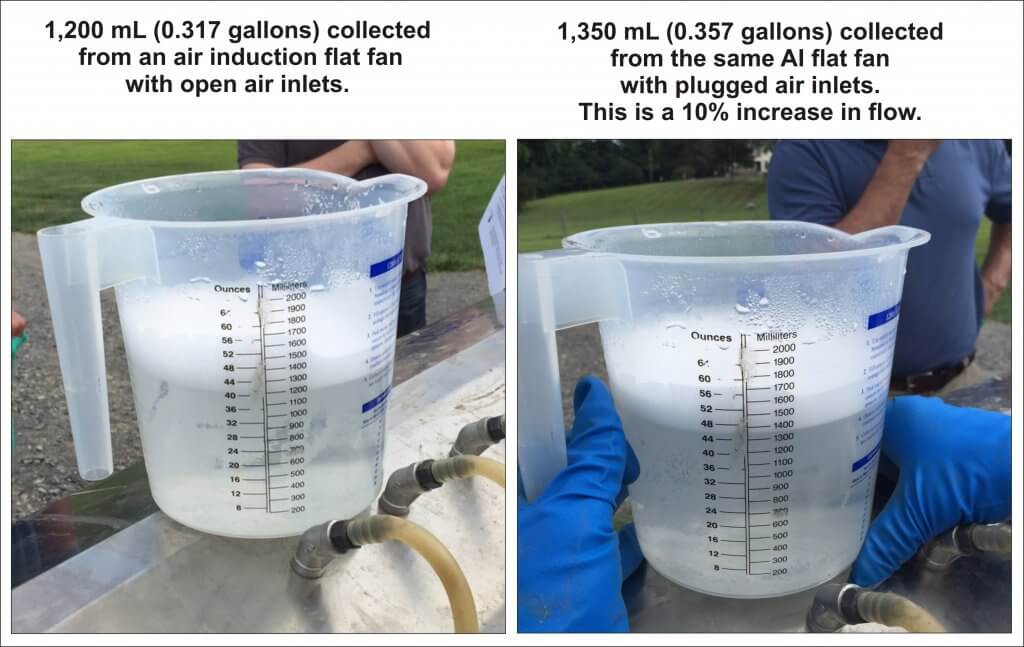
Another approach is to hose-clamp multiple hoses over nozzle bodies and spray all at once. This is tricky and takes time. Plus, if you suffocate the nozzle’s exit orifice (creating back pressure) or block the air inlets on AI nozzles, you will get a false reading.
Be careful not to plug air inlets on air induction nozzles – you may get a false reading.
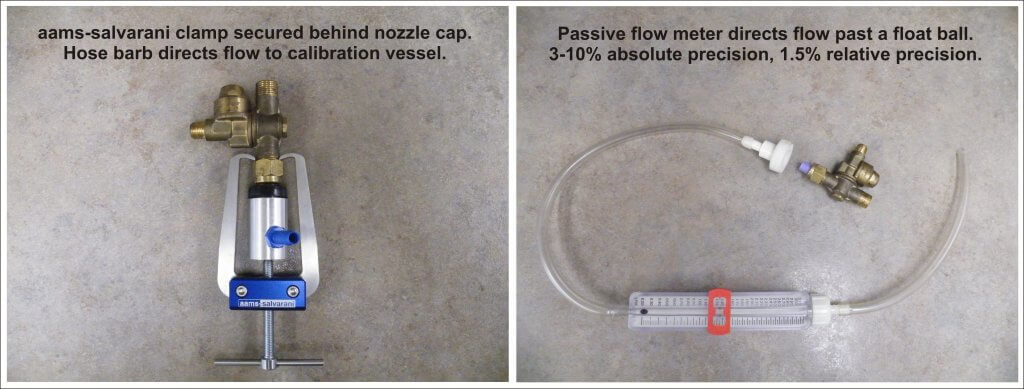
We prefer nozzle clamps over hose clamps (see the AAMS-Salvarani nozzle clamp pictured below). There are pincers designed to latch behind the nut of the nozzle body, but compatibility can sometimes be an issue (e.g. with Turbomist sprayers).
Passive flow meters (also pictured below) remove the need for a collection vessel, but they’re a better fit for field sprayers since they have to be held in place manually. They are difficult to source in North America because their accuracy is questionable, but they are fine for comparing relative flow from tip to tip.
Nozzle clamp or flow meter, avoid suffocating the nozzle exit orifice or AI nozzle air inlets.
Left: Nozzle body hose clamp. Right: Passive flow meter.
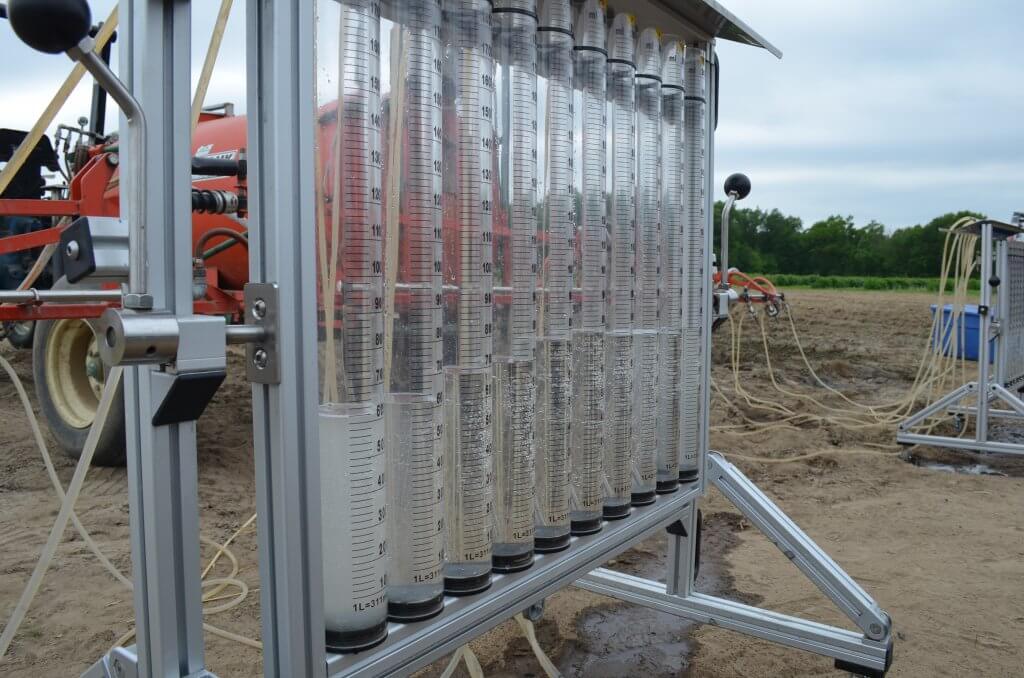
Some grower groups, or professional consultants, spring for very sophisticated and accurate units, such as AAMS-Salvarani flow measurement system pictured below.
AAMS-Salvarani flow measurement system. We used these on a pumpkin sprayer in New Hampshire, but they work with airblast too.
No matter your preferred method, take the time to confirm your sprayer output at the beginning of the season and whenever you make repairs or significant changes to your sprayer.
This article describes a method for assessing airblast sprayer coverage based on a protocol developed by Dr. David Manktelow (Applied Research and Technologies Ltd., NZ). It was co-written with David Manktelow and Mark Ledebuhr (Application Insight, LLC, USA). An older article describing canopy coverage assessment can be found here.
Why assess coverage?
Airblast sprayer configuration can require a lot of guesswork. There’s too much time between spraying and observing the results for operators to evaluate adjustments. They need timely feedback to assess the fit between sprayer and target.
Achieving adequate coverage of target surfaces (e.g. fruit, wood, inner canopy, etc.) is the basis of effective crop protection. Assessing coverage as soon as possible alerts the operator to correctable problems. The following three methods are helpful, but they have limitations.
The shoulder-check
Shoulder-checks can identify leaks and plugs, but operators cannot detect variation in flow from nozzle-to-nozzle (even when it’s over 50%). The vantage point also makes it difficult to determine if spray is passing under, over or through the target row. It is better to perform an inspection with the help of a partner outside the sprayer as part of a formal pre-spray check.
Shoulder-checks are fine for detecting plugged or leaking nozzles, but the vantage point makes it hard to discern much else.
Run-off
Unless specified by the pesticide label (e.g. drenching bark
with oil), spraying to run-off usually means excessive and non-uniform
coverage. It’s been demonstrated in trees and vines that when the outer canopy
begins to drip, the inner has only received about half the spray volume.
Efficacy trials confirm that spraying to run-off will provide protection, but it’s unnecessarily wasteful. Loses of 10-15% have been measured at the point run-off. Additional spray volume may increase coverage in the inner canopy, but the saturated outer canopy receives no additional deposit. The excess simply drips off. Further, there are potential phytotoxicity issues at the drip-points where residues concentrate as they dry.
Dripping is an unreliable coverage criterion because the threshold for run-off depends on the nature of the target surface (e.g. waxy, hairy, vertical) and the product formulation (e.g. oils, stickers, spreaders) and droplet size.
Run-off is not a reliable indication of good coverage.
Inspecting wetting and residue
Inspecting targets for wetting or residue can give a broad indication of whether a target received spray, but it’s hard to see on some plant surfaces. Dry fluorescent tracers and kaolin clay can help operators visualize deposits on actual plant surfaces, but they are messy, time-consuming and after-the-fact (i.e. too late too correct sprayer settings).
Helpful Tip: Look for residue on high-contrast infrastructure, like trellises or black irrigation lines. Remember, they are sill only subjective indicators.
The preferred method
Water sensitive paper
This method relies on water sensitive papers to help visualize spray coverage. The yellow side can resolve droplets >50µm in diameter, turning blue where it contacts moisture. With the aid of smartphone apps such as SnapCard (as of 2026, may no longer be available), or portable scanners such as DropScope, water sensitive papers can be used to characterize droplet density and droplet size up to 30% total coverage.
These surrogate surfaces do not show the spreading effects that can occur on plant surfaces (especially where surfactants are used). They also show lower deposits than leaves, which move freely in airblast air. Nevertheless, they give a useful indication of potential coverage.
To avoid fingerprints, wear gloves or handle them by the back and edges. They will slowly turn blue in humid conditions, so keep them sealed in their foil package when not in use. Packages of 50, 25x75mm (1×3 inch) papers are available online or from local agrichemical retailers for about $50.00.
Preparing water sensitive papers
You will need ten pushpins (five dark coloured, five light coloured), ten papers and a resealable plastic bag. The following process may seem like close-up magic but with practice you can quickly prepare multiple sets of papers.
Remove eleven papers from the foil package.
Stack them yellow-side-up and flip the top paper over.
Using the flipped paper, carefully fold the stack in half. Now ten are folded yellow-side-out.
Expose 1/4 of the middle paper. Pinching the stack firmly will flex it and give support as you pierce the corner with a pushpin (twist as you push).
Use the pushpin as a handle to slide it from the stack and drop it into a Ziploc bag. Repeat the process for the remaining nine papers (return the outside one to the package for later use).
They will remain viable in the sealed bag for several days before they are used in the target canopy. Once placed in the canopy, ten folded papers provide 20 target surfaces.
Six steps to preparing and attaching water sensitive paper.
Placing the papers
To avoid boundary effects, don’t place papers in the periphery of the planting. To make sure the sprayer is up-to-speed and the canopy is not overly exposed to wind, go a short distance into the target row and pick a representative tree or vine. The pins will hold the papers to stems, twigs and leaf petioles. Shadowing from leaves is inevitable, but try to avoid placing them up against fruit, leaves or wood. Relative placement within the canopy depends on canopy size:
Small canopies
For grape, pin five dark pins into stems next to inner bunches deep in canopy. Pin the five light pins around the outer bunches, oriented with one side of the paper exposed to the sprayer. When you stand back, it should be hard to see the inner papers.
Similar positioning can be used for berry canes and bushes. Pin five dark pins in the inner canopy, spanning the height but oriented randomly. Pin five light pins in the outer canopy, spanning the height but oriented with one side exposed to the sprayer.
Helpful Tip: Keep the papers clustered in a 1-2m (6 ft) row and tuck the Ziploc bag into the dripline to mark where they are. They shouldn’t take long to find after spraying.
Medium canopies
For high-density orchards and larger trellised canopies, a ladder might be required. Pin five dark pins in the inner canopy, spanning the height but oriented randomly. Pin five light pins in the outer canopy, spanning the height but oriented randomly
Large canopies
For large trees (e.g. tree nut, citrus, sour cherry), a
modified approach is required. Instead of dark pins, use sections of plastic or
galvanized conduit. Note the wire clips developed to affix papers to the
conduit in the image below. Any method of firmly affixing the papers is
acceptable.
Stand at the trunk and raise the conduit section by section to
reach the full height of the canopy. Attach five papers as you erect the
conduit mast with one at the top, one at the bottom and the other three evenly
distributed. A wrap of electrical tape may be required to help hold sections
together. Then, pin five light pins in the outer canopy, oriented randomly and
spanning as high as can be conveniently reached.
Helpful Tip: Tie a length of flagging tape near the papers to make them easier to find and replace between assessments.
Use lengths of metal or plastic conduit to create a mast that can span the height of large canopies. Distribute papers evenly along the length as it is assembled.Larger trees, like nuts, citrus and sour cherry make it harder to assess all canopy positions (and to spray them).
Spraying
It is preferable to spray clean water from a rinsed sprayer, but you can assess coverage during a chemical spray if label restrictions permit re-entry. Always wear PPE when required.
Spray the target row as you normally would (e.g. both sides, alternate row middle, multiple rows) in weather you would normally spray in. Retrieve the papers as soon as they are dry enough to handle.
Complete the top section, being sure to describe the sprayer set-up, application volume and weather conditions at the time of spraying. Either staple or glue the recovered papers to the form. Try to arrange them relative to their original positions in the canopy.
Helpful Tip: Glue sticks work very well but avoid lumps that will show through.
What do you think of the coverage seen on the 20 surfaces in this example? Seven of the 20 surfaces (35%) show almost no deposit, and 10 (50%) have visibly low numbers of relatively large droplets – that is usually an indication of inadequate coverage.
Assessing each paper
Research and experience suggest that a droplet density of about 85 Fine/Medium-sized droplets per cm2 and about 15% overall coverage is adequate for most foliar insecticides and fungicides. With experience, this can be judged by eye. Note: only 80% of all papers require this minimal threshold coverage. This is described later in the article.
Helpful Tip: It is sometimes helpful consider the amount of yellow left between the blue.
Grade each of the 20 surfaces as (E)xcessive, (A)dequate or (I)nadequate by circling the corresponding letter on the form.
Adequate satisfies minimal coverage.
Excessive will provide crop protection, but often indicates unnecessary waste.
Inadequate includes non-uniform coverage and nil coverage.
There are a few notable exceptions:
Make allowances for papers where potentially Adequate coverage has been masked by an adjacent obstacle (see paper number 5, below).
Finer sprays will have very high droplet counts and less volume. Paper number 6 (below) would be Inadequate for a high volume, dilute application. However, this uniform distribution is Adequate for a low volume, concentrated application (e.g. mistblower).
Coarser sprays may have lower droplet counts or coalesce into blobs (see paper number 2, below). Focus on even distribution and the 15% overall coverage.
Unless using a scanner, visually assessing papers can be subjective. Rely on droplet density, overall coverage and the product’s mode of action when making a determination. Paper number 6 is Adequate for a mistblower due to the high droplet density and uniformity.
Assessing the canopy
Spray coverage can be highly variable. This method employs 20 surfaces and semi-random orientation to offset some of that variability. Minimal coverage (i.e. Adequate and Excessive) should be achieved on 80% of the papers.
Complete canopy coverage is not required. Studies in New Zealand winegrapes showed a direct correlation between the percentage of Inadequate papers and levels of bunch botrytis. Disease levels increased as the number of Inadequate papers increased over 20%.
Watch for the following in the overall coverage patterns:
Clustered gaps in coverage
This occurs when spray fails to reach the targets. Gaps often occur in the top third of large canopies and deep in dense canopies. This could indicate problems with air speed/orientation, dense canopies, or inadequate flow from corresponding nozzle positions.
Uneven coverage
In medium and large canopies, the outer canopy often receives more spray than the inner canopy, and this may be unavoidable. Be aware that an even distribution of droplets on poorly covered surfaces could indicate underdosing relative to bluer surfaces.
Run-off
This is typical in the outer portion of large and/or dense canopies during high volume (i.e. dilute) applications. More than 50% of surfaces will be thoroughly wetted; Papers will curl, and blue dye may drip off. Unless specified on the product label, it is excessive for foliar applications, but may be unavoidable.
In low volume (concentrate) applications, run-off could indicate poor nozzle distribution or tight alleys. It is generally undesirable and indicates waste.
Improving canopy coverage
This is an iterative process requiring a few attempts before coverage is improved. Try to identify the most limiting factor, make a single adjustment, and then reassess. Consider factors such as travel speed, sprayer air output, nozzle rates and overall spray volume. Also consider canopy management and weather conditions.
When water sensitive papers are prepared in advance, each assessment should take two people about 20 minutes. Compare assessments side-by-side. When one set of papers appears “bluer” than another, measurements have shown it represents >20% difference in actual canopy deposits. This is very likely to have a biological impact.
This small investment of time and money can return better crop protection, greater efficiency, and confidence that the airblast sprayer is doing the job.
Real world example
While in Mildura, AU, we were invited to optimize a Silvan wrap-around multirow sprayer in box-hedged grape. Originally an air-shear sprayer, it was converted to employ air induction hollow cone nozzles (six air outlets per row-side, 550 L/ha [50 gpa], 8.5 km/h [5.3 mph]).
A Silvan wrap-around multirow sprayer in grape.
We noted that the outer arms were 2.8m (9 ft) from the canopy, and the inner arms were 2.1m (7 ft). We brought them in to 2.1m and employed the previously described assessment method to establish a baseline for comparison (see assessment number 1).
The outer arm was brought in until nozzles on both arms were equidistant from the target canopy.Assessment Number 1 (Left). Mostly Inadequate.
Watching as the sprayer passed, we noted the canopy compressed rather than ruffled. This was likely caused by the air outlets being perpendicular to the canopy. When the canopy closed, air and spray were deflected rather than allowed to penetrate. There were also V-shaped plates in each air outlet left over from its days as an air-shear sprayer that deflected the air in strange ways.
We angled the air ducts and decided to remove the 80 degree air induction nozzles. There have been recent reports of improved grape canopy penetration from the new Arag 40 degree hollow cones, so we tried them. Unfortunately, we chose nozzles with too high an output and the operating pressure dropped below 3 bar (44 psi). With poor atomization, the resulting coverage was still poor. Note the finer droplet size from the switch from air induction to conventional hollow cones (see assessment number 2).
Assessment Number 2 (Middle). Finer droplets and still mostly Inadequate.
Time was limited, so we made two significant changes before the final assessment (yes, we know we said one at a time). First, we rearranged the nozzles. 60% of the total volume was from 40 degree nozzles aiming finer droplets at the fruit zone. The remaining 40% was from 80 degree A.I. nozzles aiming coarser, drift-resistant droplets at the upper canopy. This also restored our working pressure.
Then we noticed the position of the nozzles relative to the air outlets. The air preceded the nozzles, which would leave the droplets trailing behind the air rather than carried into the canopy. We turned the nozzle/duct assembly 180 degrees, so the nozzles preceded the air outlet. The final assessment showed greatly improved coverage (see assessment number 3).
Flipped nozzle/air duct assemblies so nozzles preceded air to better entrain the spray. Assessment Number 3 (Right). Far better coverage, but still room for improvement at the top of the canopy.
The sprayer operator reaped immediate benefit from the two hours of assessment and reconfiguration and has continued to use this method to optimize the match between his sprayers and crops throughout the season.