Alternate Row (aka Alternate Row Middle [ARM]) spraying is an application method where the air-assist sprayer does not pass down every alley during an application. The sprayer operator is relying on the spray to pass through one or more rows and provide acceptable coverage to the entire canopy (or canopies) on a single pass.
Some state agencies promote this spraying strategy to various degrees, and many sprayer operators (whether they admit it or not) have used this method of spraying. I have advised it myself for very young and/or very sparse vineyard and orchard plantings, but never without confirming coverage. When I tell operators that I have serious reservations about alternate row spraying, they defend it. Here are the most common justifications I’ve heard over the years, and my response:
Justification
Reply
“I do not have enough spray capacity to spray every row when time is short.”
You need more sprayer capacity. Get another sprayer so you can get spray on in time or invest in a multi-row sprayer is possible.
“ARM spraying saves money and reduces environmental impact because I use less pesticide.”
Technically, if you travel every second row with a sprayer calibrated to travel every row, you have indiscriminately reduced your carrier and chemical inputs by half (or more). Without close monitoring you may compromise your efficacy.
“I only perform ARM spraying early in the season when canopies are empty, or only on young plantings.”
I grudgingly grant this one as long as coverage is closely monitored. I’ve prescribed it myself in young or sparse plantings where I couldn’t get the sprayer output low enough to prevent drenching the targets.
“The spray plume in the alley beyond the target row must mean the spray is providing adequate coverage. More is better!”
If the spray is blowing through the canopy, it isn’t landing in the canopy. Further, if the air speed/volume is too high, droplets can ‘slipstream’ past the target without impinging on them. I’ve removed water-sensitive paper from canopies with barely any spray on them despite the plume in the downwind alleys. It looks like a magic trick, albeit an unhappy one.
“Uncooperative weather doesn’t always leave me enough time to spray the entire crop, and it is the lesser of two evils to spray alternate rows than not at all. I’ll make sure I come back to spray the other rows later.”
Choosing to do half a job requires an understanding of the products’ mode of action. If you are spraying an insect at a particular stage of development, there’s no “coming back later” to get that generation – if you missed, your window has closed. If it’s a protective fungicide that offers no kick-back, then once the disease has infected tissue, the damage is done. Get the spray on as best you can, but if it washes away before it has a chance to dry sufficiently, be prepared to reapply at the earliest opportunity as long as the label allows it.
“ARM has always worked in the past.”
Would you mind picking my lotto numbers for me? You’re a very lucky person!
My reservations about ARM spraying come from published research and personal experience that show that coverage is almost always compromised when spraying from one side of a canopy. The spray must pass through the canopy to reach the far side, and the canopy filters droplets from the air as it passes through. This reduces the number of droplets available to cover the far side. In addition, high velocity spray will create “shadows” where any targets on the immediate far side of a leaf or branch become shielded and receive little if any coverage. Further still, fine droplets slow quickly as they leave the nozzle and take a long time to settle. As the entraining air slows and becomes erratic, the droplets float and change course, making their behaviour hard to predict.
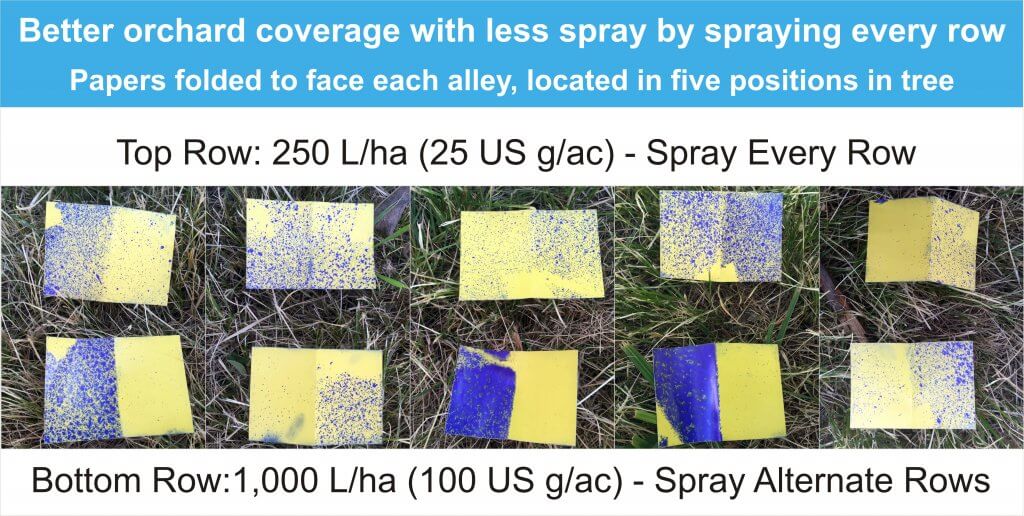
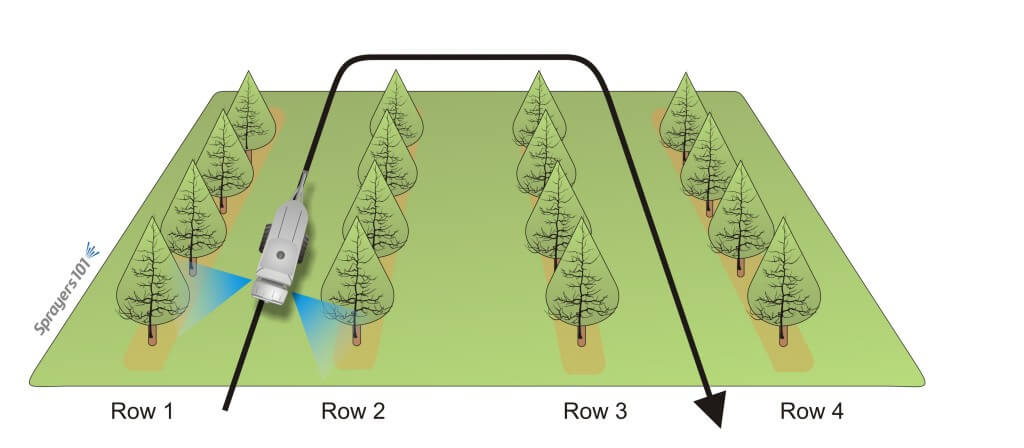
The cumulative impact can be seen in this infographic I built in 2016. The orchardist was a dyed-in-the-wool ARM applicator and he was resistant to driving every row because it took so much time. I wanted to show that he could claw back some of the lost time by spraying less pesticide every row versus his current volume every second row. He would need fewer refills, and save a LOT of unnecessary pesticide. The water sensitive paper does the talking, and while I’d like to think I’ve convinced him, I’ll bet he’s still out there dicing with fate.
A very popular argument in favour of ARM spraying comes from orchardists that are shifting from semi dwarf to high-density plantings. They ask “How it is different to spray a four foot diameter tree from one side compared to an eight foot diameter tree from both sides”?
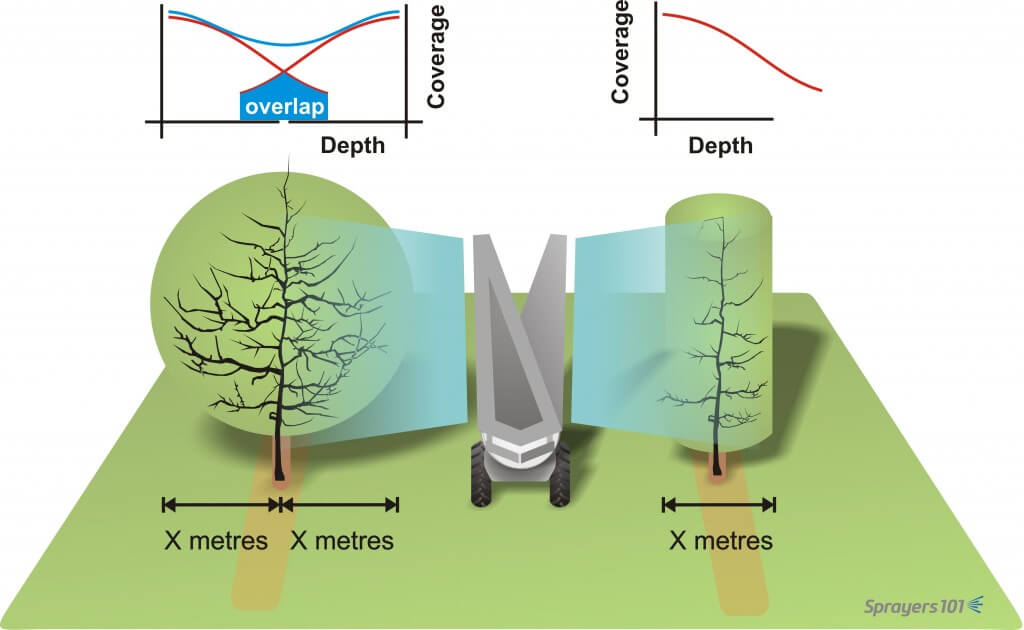
Well, we know coverage is reduced as a factor of distance. Spraying from one side gives a single opportunity to cover the middle and far side of a canopy, whereas spraying from both sides provides an opportunity for an overlap in coverage. Essentially, the centre of a canopy receives the cumulative benefit of two sprays. Coverage is therefore always improved when spraying from both sides, period.
Spraying from one side gives a single opportunity to cover the far side of a canopy. However, spraying from both sides provides an opportunity for an overlap in coverage. In other words, the centre of a canopy receives less spray than the outside, but is essentially sprayed twice resulting in a compounding effect.
Why, then, do some sprayer operators claim that alternate row applications work? Because sometimes, they do! Just because coverage is reduced doesn’t mean it isn’t sufficient to protect the crop. It simply means that the potential for poor coverage and reduced dose is dramatically increased by alternate row applications. A sprayer operator might perform alternate applications successfully for years before conditions conspire to defeat the application: unfavourable wind, poor timing, increased pest pressure, poor pruning practices, excessive ground speed, high temperatures, low humidity, insufficient spray volume, and several other factors might occur simultaneously and reduce coverage below a minimal threshold for control. This confluence of bad luck may not happen the first year, or the second, but eventually…
Product failure isn’t the only concern. Repeated reduced dosages may play a role in developing resistance. In those situations where the operator recognizes insufficient coverage, they may have to spray more often to compensate, negating any savings in time or product. Reduced dosage is a common error when a sprayer operator elects to use ARM.
If you still aren’t convinced, at least perform alternate row spraying the “right” way. Here are three situations that I’ve heard operators refer to as alternate row spraying. Situation 1 is most common, but to my mind only Situation 2 would be considered acceptable. Even then, confirming coverage is a must.
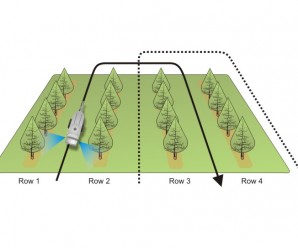
Situation 1:
The sprayer has a typical calibration for spraying every row, but only drives alternate rows. The first application (solid line) covers different rows from the second application (broken line). The operator will claim to spray more frequently, but generally does not perform the second application unless there is high pest pressure. The result is half-a-dose per hectare per application.
The sprayer has a typical calibration for spraying every row, but only drives alternate rows. The first application (solid line) covers different rows from the second application (broken line). The operator will claim to spray more frequently, but generally does not perform the second application unless there is high pest pressure. The result is half-a-dose per hectare per application.
Situation 2:
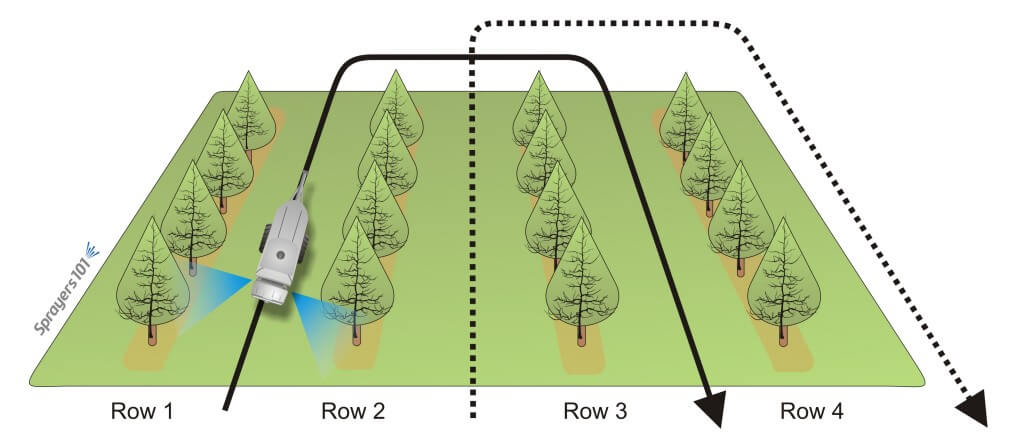
The sprayer is calibrated for double output compared to a typical every-row situation, and the operator drives alternate rows. The result is that the hectare gets the whole dose per application, but coverage is always inconsistent.
The sprayer is calibrated for double output compared to a typical every-row situation, and the operator drives alternate rows. The result is that the hectare gets the whole dose per application, but coverage is always inconsistent.
Situation 3:
Since the sprayer will only drive alternate rows, the operator mistakenly sets the sprayer to emit half the output compared to a typical every-row situation. The first application (solid line) covers different rows from the second application (broken line). The result is a quarter-dose per application, and if the operator chooses to spray a second time, the hectare will only ever get half-a-dose. Yes, this happens.
The sprayer has a typical calibration for spraying every row, but only drives alternate rows. The first application (solid line) covers different rows from the second application (broken line). The operator will claim to spray more frequently, but generally does not perform the second application unless there is high pest pressure. The result is half-a-dose per hectare per application.
So, my final word on alternate row applications is that they should be performed with extreme caution. I’ve used them myself in early season applications in new plantings, but never without confirming coverage with water-sensitive paper, and never in conditions that might further compromise coverage to the point that the application does not give control.
Caveat Emptor!
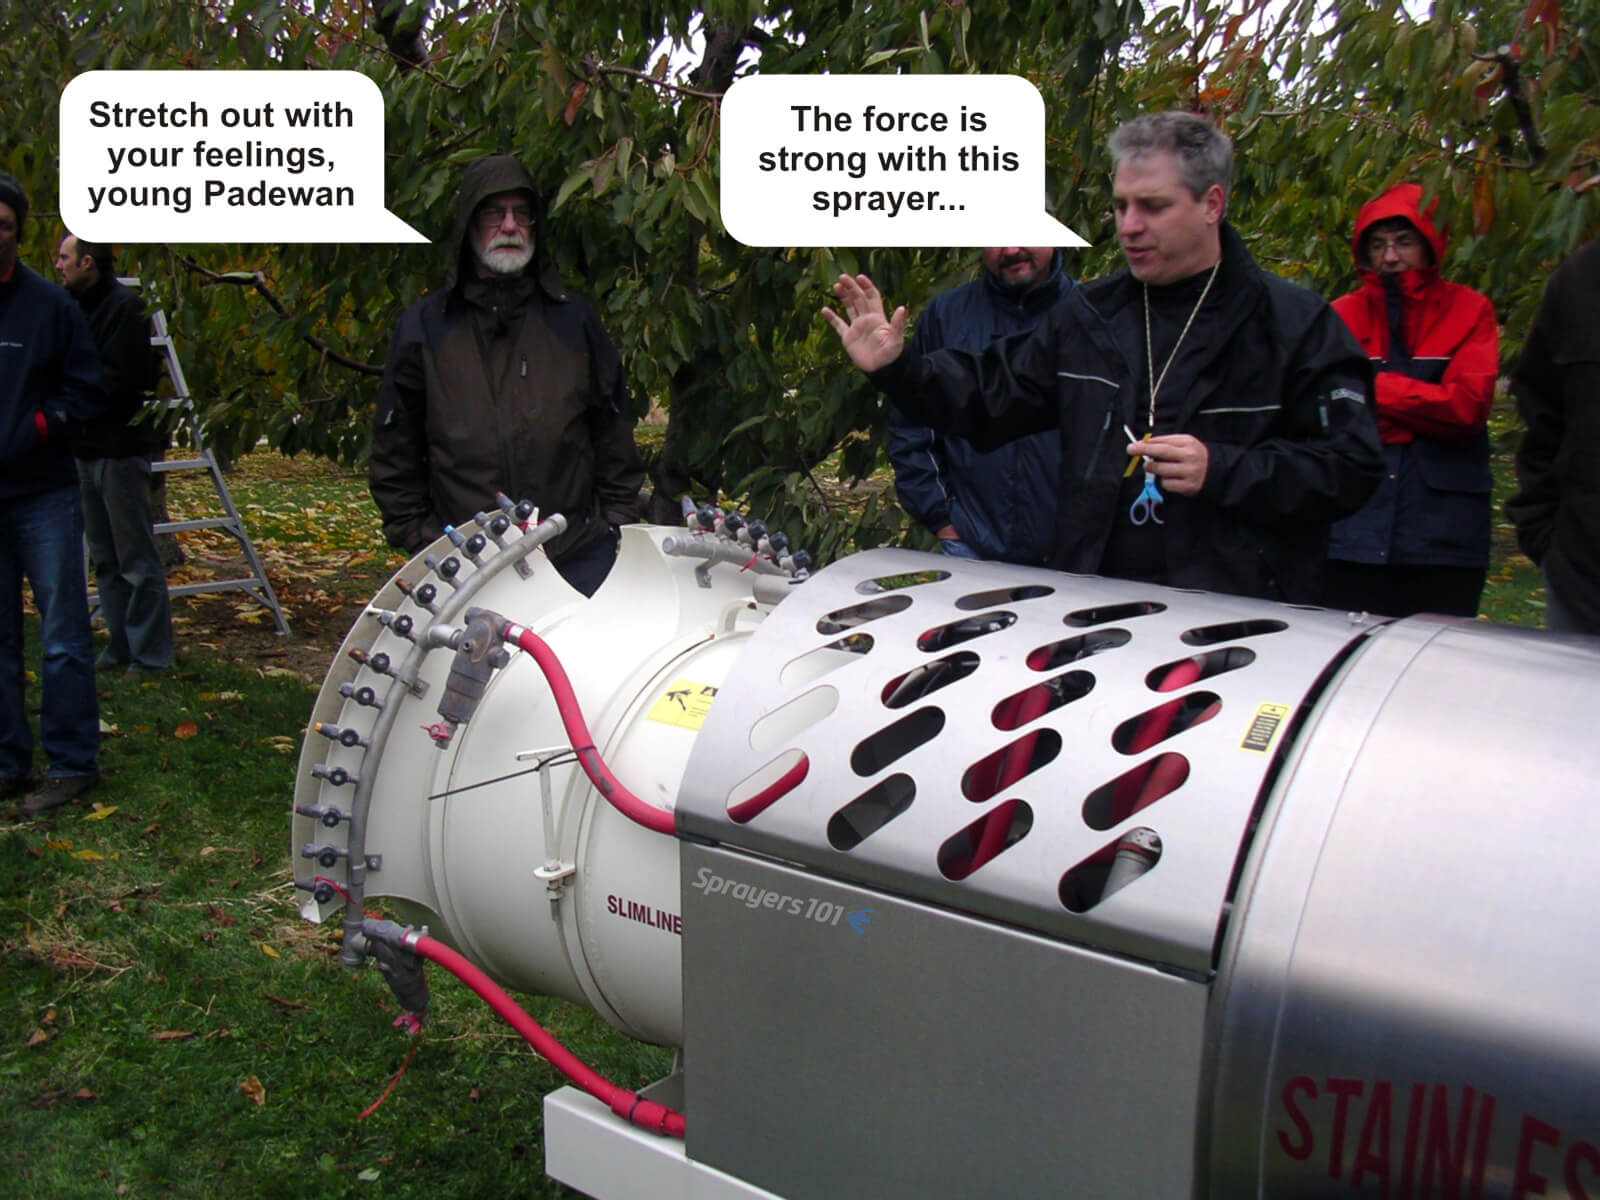
Well, I thought it was funny. My apologies to J. Luymes from British Columbia (pictured) and Obi Wan Kenobi (not pictured… or is he?)
Some springs are tougher than others. This article was originally written in 2019, which was particularly challenging. The frequency and duration of rain events left limited opportunity for orchard sprays. Even then, the periods between rains were transitions between warm and moist conditions and cold fronts, which makes wind gusty and changeable. These same periods leave wet alleys prone to rutting and compaction, and conditions that favour spraying may also favour pollinator activity.
In response, applicators get frustrated. Some may be tempted to spray in sub-optimal conditions and risk drift thinking even a little coverage is better than none. But the adage that “there is no wasted fungicide spray” does not apply here. Some may disagree, but spraying in wet and high-wind situations:
greatly reduces coverage and subsequently, crop protection.
may result in repeated sub-lethal doses that can encourage resistance.
greatly increases the degree of surface run-off and off-target drift, risking environmental, commercial and residential contamination.
The argument itself may be moot because the decision to
spray is not strictly a consideration of economics, productivity, and risk
tolerance. When environmental restrictions exist on a pesticide label they are
inviolate. That is, they are not suggestions but legal requirements. Statements
might include:
Not spraying when rain is forecast within 12 hours following application. This is, in part, to prevent water-soluble products from moving in surface or channel run-off.
Not spraying in calm conditions (generally <3 km/h, as measured at the top or outside of the orchard). This is to prevent airborne spray from moving in unpredictable directions during a thermal inversion, or downhill with stratified air.
Not spraying in gusting or windy conditions (generally >10 km/h, but there is no Canadian standard). This is to prevent airborne spray from moving with the wind. This is of particular import when there are sensitive downwind areas that can bring buffer zones into play
Technologies exist that extend the spray window, but they require
long-term planning and may not be economical (or even completely proven). They
are generally a combination of orchard architecture and sprayer design. Examples
include:
Tented orchards (more common in Australia) designed to exclude pests and insulate against hail, wind and inversions.
Shrouded vertical booms (e.g. Lipco) designed for trellised orchards.
Solid-set emitters (more common in Europe and still experimental in parts of the northern US) that reduce drift and can spray large areas quickly.
Vertical towers with downward-oriented fans (e.g. Curtec Proptec or Sardi sprayers) that rely on the orchard itself to filter lateral/downward-directed spray.
Assuming the pesticide label does not prohibit application, there are adjustments that can improve coverage and reduce drift in sub-optimal conditions, but only marginally. These are compromises that sacrifice time, money, effort and/or the level of crop protection. Further, they are only intended for sprayers with towers (i.e. not low-profile axial sprayers):
Convert to air induction nozzles (at least in the top two nozzle positions, and likely at one rate higher than you usually use).
Be certain to turn off any nozzles spraying excessively over the top of the canopy. A little can’t be helped and is actually a best practice to ensure spray reaches the treetop. Be reasonable.
Reduce fan speed to only reach just past the middle of the canopy on the upwind side.
Turn off the boom on the downwind side of the sprayer and adjust airspeed and nozzle rates for upwind alternate row spraying only. Especially on the last three downwind rows, which you may have to leave unsprayed entirely.
The best advice is unpopular: Park the sprayer until conditions improve. Like hail, there are environmental factors that are out of the farmer’s control. They are inconvenient and highly frustrating, but do not be tempted to takes risks on what might ultimately result in poor coverage and accusations of pesticide drift.
In April 2025 we visited Cedarline Greenhouses to assess their spraying methods. Our hosts invited us to examine their practices and then graciously agreed to let us share the process (and the results) so others could learn from the experience. Every greenhouse is different, but with a little imagination the process we used should translate to most operations. I want to be clear that this operation was already doing a good job before we showed up. It’s just easier for someone from the outside to scrutinize and find little things that might need tweaking. Let’s go through the steps we took that day.
1. Measure the crop canopy and the planting architecture
The objective of any spray application is to achieve sufficient coverage of the target with as little waste as possible. Achieving this goal means understanding the interaction between the sprayer, the spray droplets, and the crop canopy.
Start by measuring the the planting architecture. These values allow us to calculate application rates and to calibrate the sprayer. Cedarline is a 16-acre pepper operation. The crops are strung vertically in double rows for a total canopy depth of about 1 m, leaving roughly 0.5 m clearance in the alleys. Spraying takes place while the crop is between 1.5 and 3.5 m high. Each row is 102 m long.
2. Consider the target from the droplet’s perspective
Stand between the rows and face the canopy. Where is your spray target relative to the nozzle? Is it in line-of-sight, or are there parts of the canopy in the way? In this case, our primary targets are sucking insects found predominately on the under-side (abaxial) surface of the leaves, and not the waxier, above-side (adaxial) faces.
As we look through the double row, we see the adaxial sides face out towards the alleys, and the abaxial sides face the canopy interior. Bad luck. But, as we peer through that first row to the second row, we can see the abaxial sides of those leaves. So, perhaps enough of the spray can penetrate past the first row to deposit on the abaxial surfaces of the far row? This is a tricky plan because of the physics of droplet behaviour.
We know that coarser droplets move ballistically (e.g. like cannon balls), so perhaps they could span the distance from the first row to the next. But they are prone to bouncing and running off surfaces, which means they’d likely drench the waxy adaxial side of the first row before any get to the abaxial side of the far row… and those that do might not stick to the target.
On the other hand, finer droplets are less prone to run off, so they’re much better at sticking to hard-to-wet surfaces like peppers and waxy leaves. Additionally, thanks to the cubic relationship between droplet size and volume, the smaller the average droplet size, the more droplets we have working for us. However, finer droplets don’t have a lot of mass, so they move erratically, and they are prone to evaporation. Maybe they won’t reach deeply enough into the row.
Fortunately, greenhouses are humid places, so finer droplets don’t evaporate quickly. Plus, greenhouses tend to spray at relatively high pressure (200 psi or more), which imparts momentum to finer droplets. Also, when enough tiny particles move in a single direction, they create air currents – essentially a light wind. This side-effect is sometimes enough to move leaves, creating holes in the canopy and exposing the abaxial sides of leaves as they twist. So, there’s hope. Now let’s look at the sprayer.
3. Examine the sprayer and the nozzles
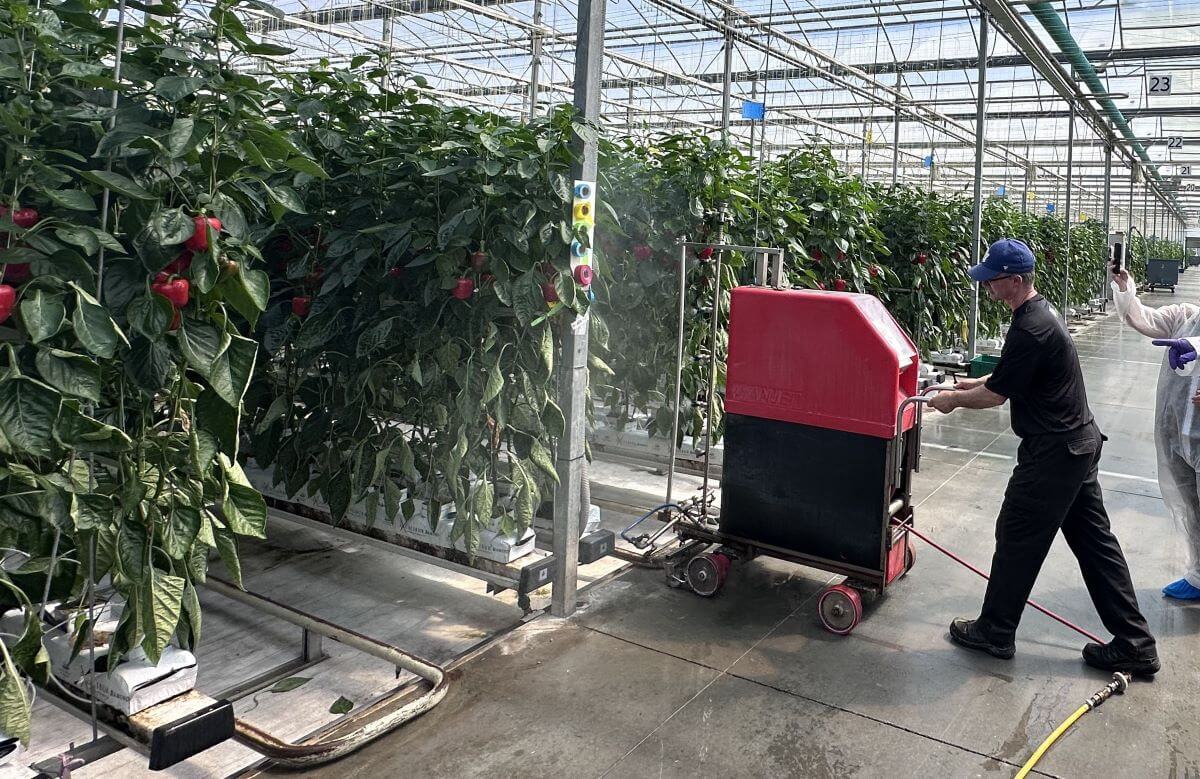
Cedarline uses semi-automatic “robot trees” (Wanjet model S55). This sprayer has a vertical, 2 m high boom with nozzle bodies spaced every 25 cm. When the crop grows higher than the boom, an extension is added to bring it to 4 m. Flange wheels allow the sprayer to ride the hot water pipes between the rows like a train on rails at a rate of 60 m/min.
The sprayer is manually placed in the row. Then it trundles along, spraying one side, until it reaches the end of the row. Then the vertical boom turns to spray the other side on the return trip, where it is retrieved and placed in the next row. The sprayer is fed from a portable tender unit via a 180 m auto-reeled hose at 200 psi. The question is, does this all work the way we assume?
4. Calibrating the sprayer
4a. Pressure
We started with pressure. If pressure is the force that causes a specific volume of spray mix to exit the nozzles at a specific rate and produces a specific droplet size and spray geometry (e.g. a cone or a fan), then it’s very important to know that it’s accurate.
Remove the gauge with a wrench (never turn it by the face) and test it against a known gauge. You can build a test apparatus very easily. Alternately if the gauge is showing wear, such as the needle not sitting on the zero pin, or it’s opaque, or leaking, maybe just replace it without testing.
In our case, we discovered the gauge was off by 20%. Where the standard gauge read 150 psi, the working gauge read ~120 psi. Plus, the scale of the gauge was far too high. Best practice is to use a gauge rated to about double the operating pressure. This gives better resolution, and a quick glance shows if the needle is pointing straight up.
I prefer a tender system like this over a central spray tank in a header house. In systems where there is a central tank and the sprayer hoses plug in at intervals, the degree of pressure-drop increases with distance from the source. If this is you, install a regulator on your sprayer and adjust it accordingly to hold the pressure constant. In this case, the distance the spray solution travels is always constant, so the pressure doesn’t change. Best practice in either case is to install a pressure gauge on the sprayer at the end (or top) of the boom so you can confirm the operating pressure is correct.
4b. Sprayer speed
We were told the sprayer was set to travel 60 m/minute, but is that true? Certain chemistries will deposit a slick coat on the hot water pipes and the flanged wheels can slip (especially as they wear). There was obvious damage to the rubber surface of two of the flanged wheels that might have affected travel speed. We should have checked, but we didn’t. Use a timer and confirm how long it takes for the sprayer to travel to the end of the row. Don’t include turn time. If it doesn’t match your expectation, then adjust the speed until you get what you want.
4c. Boom and nozzles
Next, we explored the boom and the nozzles. The first thing we saw was that their alignment was wrong. Flat fans in ¼ turn nozzle caps will self-align on the lug to ensure each spray fan does not physically impact it’s neighbours. However, the nozzle bodies themselves can sometimes turn on the threaded boom, and they need to be realigned. We did that before removing a few tips for inspection.
Each nozzle should be oriented 10-15 degrees off vertical and parallel to one another. Here, the top one is correct, but the lower nozzle has twisted and will leave a gap in the swath.
I asked when the nozzles were last replaced and was told the sprayer arrived pre-nozzled with TeeJet visiflo 8002’s. They had never been inspected, other than when they plugged, and their rates had never been confirmed. Upon inspection we found some were physically damaged. This doesn’t mean the nozzle orifice was compromised, but it instilled doubt. You don’t always see obvious damage but know that the orifice is delicate and very precise. As it wears it gets larger (increasing flow), but more insidiously it also changes shape, altering the size of the spray droplets, which we’ve established are critical to our spray strategy.
Best practice is to test nozzle outputs at a known pressure and replace them when they are 5% off the expected rate. Unless a nozzle gets physically damaged, replace them as a set so they wear as a set. When do they wear out? It depends on the nozzle material, the nature of what you’re spraying, the pressure and the amount of time they spend spraying. Here’s a link to an article that suggests several methods for testing nozzle output. Some are cheap and slow, others are fast and expensive, but they all work.
If that’s not appealing, you can mark your tank and see how many rows you should be spraying versus how many you’re actually spraying. Ultimately, given the relatively minor expense of new tips versus the trouble of calibrating them annually, it’s often simpler to replace them at intervals. In this case it’s worth noting that the first 2 m of boom operates all season, while the extension is only added later, so they won’t all wear at the same time.
We examined and then returned the original tips to the boom for the next part of the calibration. We noticed that the gaskets were stretched (crushed). This made it hard to put the nozzles back on, so they would also need replacing.
We turned on the boom to ensure we had everything back in the right place, and noticed that when we stopped spraying, the boom slowly emptied through the lowest nozzles. That meant expensive products were left to dribble out every time the boom stopped spraying, which is wasteful. It hinted that the check valves, which are built into the nozzle bodies, were no longer working. Ideally, once the boom pressure drops below ~15 psi, each check valve diaphragm closes to prevent leaks. It also ensures the boom remains primed for the next pass. We advised that they should be replaced and to ensure the new bodies have the correct thread size. European sprayers rarely have the same thread as North American, so compatibility can sometimes be an issue.
5. Evaluating spray coverage
This is an iterative process, which means we test, evaluate, make a single corrective change, and repeat until we (hopefully) see what we want. Water sensitive paper (WSP) is a terrific tool for this process, but it has a few caveats:
It will react to any moisture, including a humid atmosphere, so handle it with gloves and don’t let it sit for too long.
The WSP surface is only a surrogate for a plant surface. Deposits tend to spread more on leaves, vegetables and fruits, but will always be smaller on the papers. So, only compare papers to other papers and infer that the actual crop coverage is better.
We really don’t know how much coverage is enough. It depends on pest pressure, product concentration and mode-of-action (e.g. contact or systemic). Generally, we like 10-15% of the surface covered with 85 deposits per cm2 on 80% of the targets. Sometimes it’s easier to imagine the pest on the paper – can it fit between the deposits?
5a. TeeJet visiflo 8002 at 200 psi
We started by establishing a baseline using their current nozzles and pressure. WSP was folded and clipped at the petiole so we could assess adaxial and abaxial surfaces. We placed them deep in the canopy so we were looking at the worst-case scenario, and then noted where we left them (use a ribbon or part of the greenhouse as a frame of reference or you’ll never find them again). We sprayed from one side, then examined them in situ, then sprayed from the other side so we could see the impact of cumulative coverage.
After spraying from both sides, we saw excessive coverage on adaxial surfaces and marginal coverage on abaxial. For those that have tools to digitally scan and assess WSP, it worked out to 31% coverage and 225 deposits/cm2 on the adaxial side, and 2% and 16 deposits/cm2 on the abaxial. In fact, the adaxial side was so saturated (>25% coverage) that I don’t trust the deposit counts because of overlaps, but there it is. This is when we brought out the nozzle manufacturer’s catalogue (which you can also find online). We found their nozzle and looked up the flow table, which shows the relationship between pressure, output rate and droplet size.
Those in greenhouses might find that their operating pressures are far higher than what is listed, but that’s no problem. Find the highest pressure and output rate listed in the table and call those “Known Output Rate” and “Known Pressure”. Now use the following calculation to extrapolate flow for a new pressure. It’s also worth knowing that higher pressure tends to mean a wider fan angle and finer spray droplets than are listed in the table:
Unknown Output Rate (gpm) = Known Output Rate (gpm) × (square root of New Pressure (psi) ÷ square root of Known Pressure (psi))
In this case, at 200 psi this nozzle should produce 0.45 gpm. If we go up one size from the yellow 02 tip to a larger blue 03 tip, we can produce a similar flow but using only 100 psi. This would put less strain on the system, but it would also make droplets larger, fewer and perhaps slower.
5b. TeeJet visiflo 8003 at 100 psi
We tried the 8003 at a lower pressure and saw that the deposits were obviously larger on the adaxial side, and not saturating, which is good. However, we saw insufficient deposit density on abaxial, which was a deal breaker.
5c. TeeJet visiflo 8003 at 200 psi
We left the blue 8003s and brought the pressure back up to 200 psi. Now the flow was increased to 0.67 gpm, and the droplets were finer, more plentiful and moved a lot faster. The adaxial surface went back to excessive coverage, but perhaps not as bad as with the 02s. The abaxial deposit density was improved, but still not sufficient. You can see the results of the three trials in the photo below. Go counter-clockwise from 1 (at bottom right) to 3 (at top).
5d. TeeJet twinjet TJ6011003 at 200 psi
It was time for a radical change. We replaced the single flat fan geometry with twinjet flat spray nozzles (TJ60-8003). We tried this because we’ve tried it in the past and it worked well. We retained a blue 03 rate, so we still produced 0.67 gpm at 200 psi. This nozzle also retained the 80° fan angle, but created two of them at 60° to one an other. This would change the spray trajectory, creating new opportunities for droplets to align with the targets. Perhaps most importantly, the twin fan nozzles would produce finer droplets than their single fan cousins, increasing the odds and perhaps and creating more “wind”.
We saw far less differential between abaxial and adaxial surfaces, with deposit density greatly improved on both surfaces. While the adaxial face showed larger deposit diameters, they were close enough to require close inspection to determine which side was which; Coverage was more uniform, with no drenches and no misses. By the numbers we saw 34% and 523 deposits/cm2 on the adaxial side (again, hard to trust the counts here because of overlaps arising from >25% coverage) and 19.5% and 400 deposits/cm2 on the abaxial. We had a winner.
It’s also worth noting that every time we sprayed, we observed the deposit on the fruit and leaves. None of the sprayer configurations caused run-off (e.g. drip points on the bottom of the fruit or tips of the leaves), which would suggest we were not using an excessive volume. Look closely at the following two pictures to see the beads of water and how they deposit. They look great.
We also watched to see if spray passed through the row into the next alley. A little puff here and there is fine, because it meant the spray was reaching the far side of the row. However, spray that blows through the row excessively is wasted becuase it misses the target row and ends up on the greenhouse floor.
Epilogue
We were pleased with the result of half-a-day’s effort. We left our hosts with some homework:
Change the pressure gauge to one that is accurate and spans to 400 psi.
Replace all nozzles and gaskets and ensure they are properly oriented.
Time the sprayer to confirm travel speed is what they assumed.
Using the known speed, pressure, and boom output, do the math to account for the fact that they would now be spraying a higher volume than they were. This will change how much product they put in the tank.
Watch the crop closely to ensure these changes do not compromise crop protection.
Everyone learned a lot from our day together. Cedarline said they would calibrate their other sprayers using this process. They are even going to try a set of yellow 02 TwinJets to see if they can achieve sufficient coverage at their current pressure, which would mean they can continue to mix product at the same concentration. Those are pretty small orifices, guys, so watch out for plugged tips and good luck!
Hopefully this inspired you to look critically at your own operation and to follow these steps to calibrate and optimize your crop protection practices. Happy Spraying.
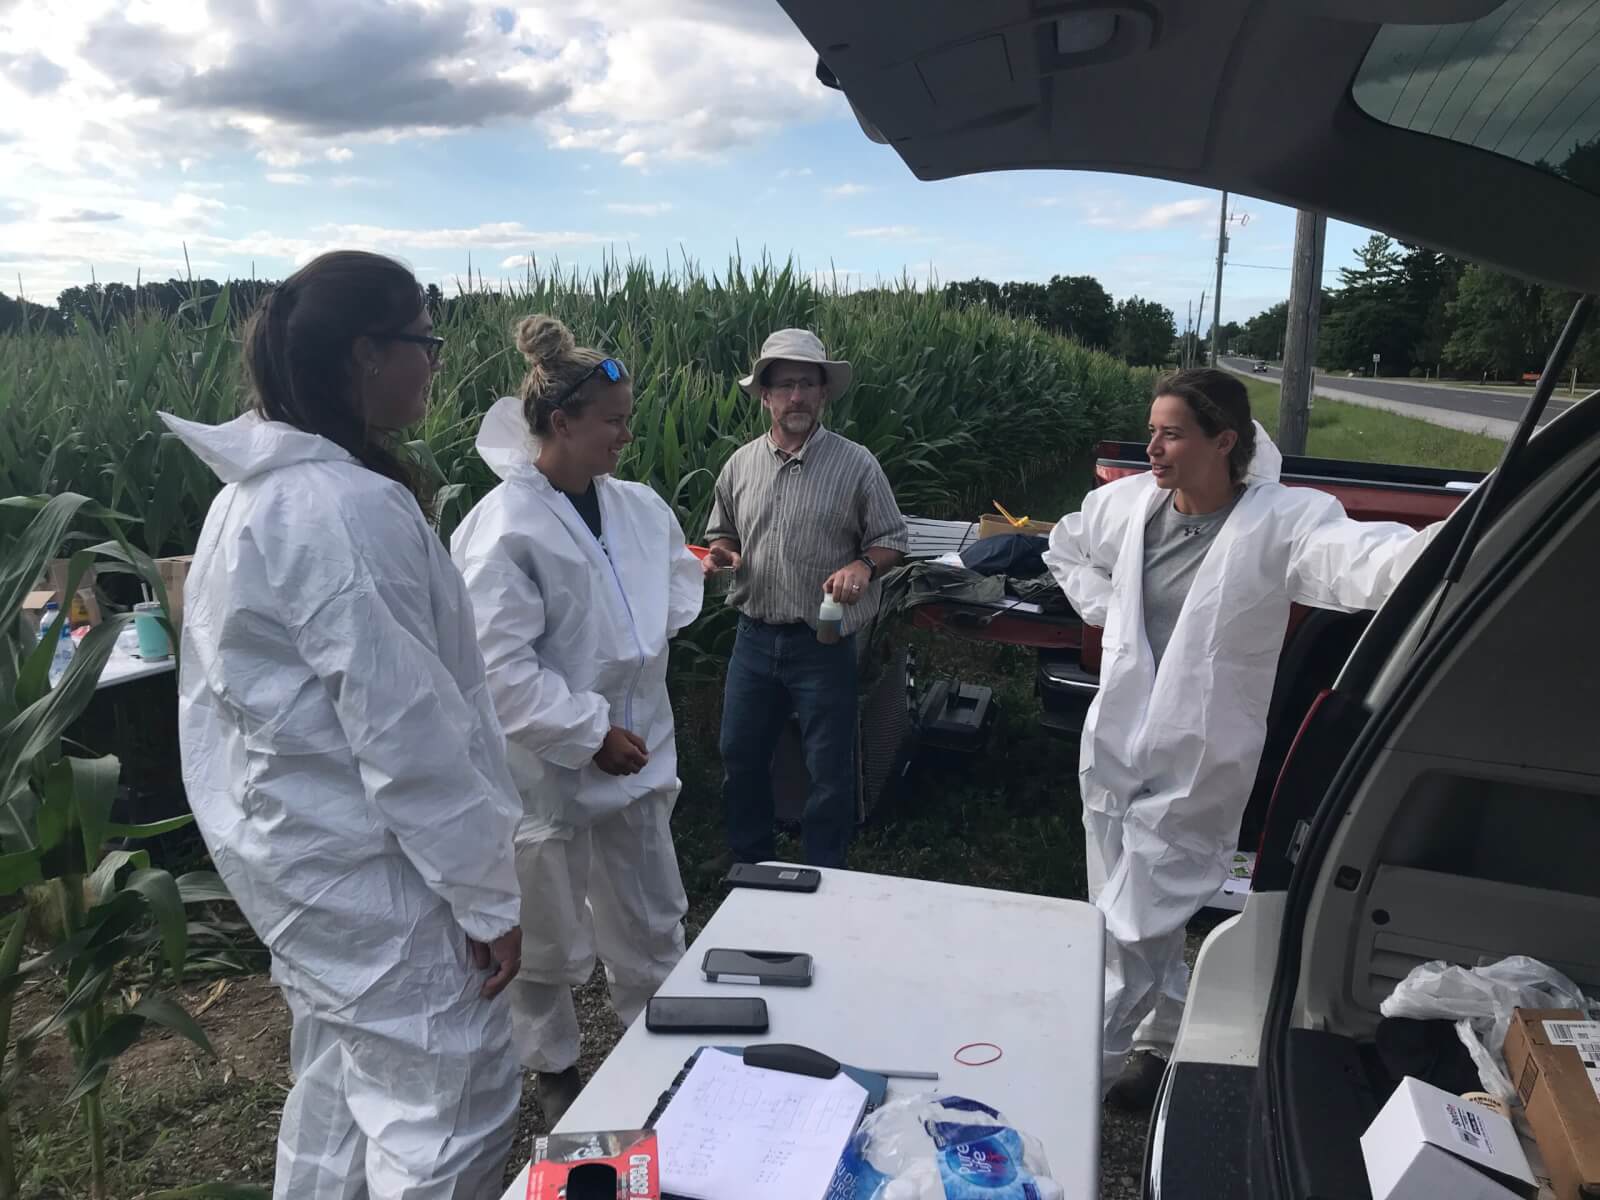
Everyone here had helpful ideas during this process. Calibration is a team sport so make sure both your operators and managers are involved. Left to right: Ryan Bezaire – OMAFA Summer Student; Paul Brooks – IPM Specialist, Cedarline Greenhouses; Jason Deveau – Application Technology Specialist, OMAFA; Jimmy La Rosa – Operations Manager, Truly Green Farms / Cedarline Greenhouses; Richard Robbins – Technical Representative, Plant Products; Cara McCreary – Greenhouse Vegetable IPM Specialist, OMAFA
Note: There have been updates to Canadian regulations governing drones since this article was written. For updates, please refer to this article.
Introduction
In Canada, the use of drones for pesticide application, otherwise known as RPAS, is regulated by two Federal Departments: Transport Canada establishes regulations for safe operation and Health Canada for the registration and conditions of use of pest control products.
Drones are already used in Canadian agriculture for crop surveillance and livestock management, and they’re being used to apply granular fertilizers, for pollination, for frost protection and greenhouse shade management. The use of drones for general spraying was cleared by Transport Canada in July 2017. In 2018, Health Canada stipulated that the use of RPAS for pesticide application is not allowed under the Pest Control Products Act (PCPA) without sufficient data to characterize the hazards or risks associated with this use. You can read the updated (as of June, 2023) Pest Management Regulatory Agency Information note on the subject of pesticides applied by drone, here.
At this time this article was written, only three pest control products were registered for application by RPAS in Canada. These were restricted-use microbials (two granular and one liquid) intended for larval mosquito control. Their labels were expanded to include RPAS in the fall of 2022 but as of 2023 no province or territory has yet permitted their application. International RPAS working groups (e.g. the OECD working party on pesticides and drones) comprised of academics, the agrichemical industry, government regulatory agencies, and both drone manufacturers and operators, are working collaboratively to assemble the evidence-based information we need to inform the expansion of other pesticide labels. These studies include:
comparative evaluations of efficacy
operator and bystander exposure studies
drift studies
residue studies, and
technical evaluations of how environmental, topographical, and operational parameters affect the above
In parallel, several groups are working to develop pesticide safety certification and training materials. Pesticide training and certification programs across Canada are based on the Standard for Pesticide Education, Training and Certification in Canada. Canadian provinces/territories are responsible for the training and certification of pesticide vendors and applicators based on these standards. A national core manual for RPAS operator is anticipated.
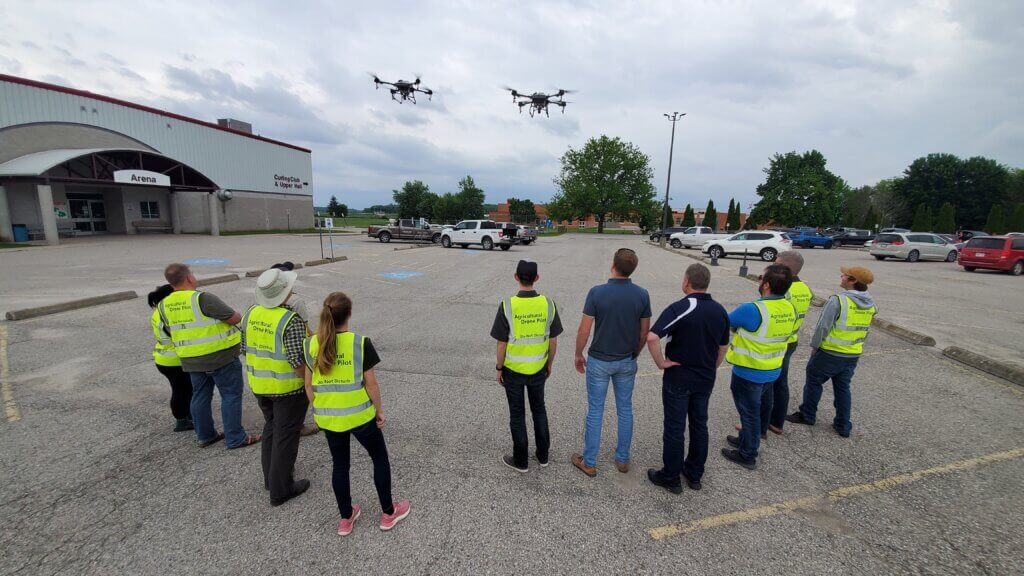
A candid moment from one of the many Health Canada-authorized RPAS research programs happening in Canada.
Registration and Certification
Anticipating future pesticide label expansions, perhaps you’re planning to buy and fly a RPAS. Pilots must register their drone (online for a $5 fee) and display that number on the drone. For more information, the Canadian Aviations Regulations (CARs) covers drones here. It’s a massive document, so jump to the end to find the relevant information under Section IX.
Transport Canada requires all pilots with RPAS over 250 g to obtain a Pilot Certificate, either for Basic Operations or for Advanced Operations. In some cases, pilots may also have to apply for Special Flight Operations Certification (SFOC), which must be approved before the mission can take place. See below for details.
Basic Operations Pilot Certificate
The Basic Operations certificate allows pilots to operate any drone from 250 g up to and including 25 kg. This allows the pilot to fly:
Outside controlled airspace
No closer than 100 ft laterally from bystanders
In VLOS (or in contact with someone in VLOS)
Over 1.8 km from heliports
Over 5.6 km from airports
If you’d like to explore the requirements, Transport Canada has an online document called TP15263 which describes required knowledge for Basic Operation pilots of small RPAS. Personally, I took a $100 online course (from a Canada-based drone flight school) to help me prepare for my exam. A good course will supply you with what you need to know about the laws, the environment, the aircraft, and your responsibilities as a pilot.
The $5 exam has 35 multiple choice questions. You have 90 minutes to complete it and you need a 65% to pass. It was a surprisingly challenging exam, so don’t be discouraged if you don’t pass on your first try. You can take another swing at it after 24 hours, and you’ll encounter new questions randomly drawn from their database.
Advanced Operations Pilot Certificate
The Advanced Operations certificate allows pilots to operate any approved RPAS over 25 kg in VLOS. This allows the pilot to fly:
Inside controlled airspace
No closer than 16.4 ft laterally from bystanders
Under 16.4 ft above bystanders (essentially directly overhead)
In VLOS (or in contact with someone in VLOS)
Within 1.8 km from heliports
Within 5.6 km from airports
There are two parts to this certification. The $10 exam requires an 80% to pass, covers more topics than the Basic Operations exam, and has the same 24h wait to retry. You must also undergo a Flight Review with a certified trainer, who changes about $200 for the service. Once the exam and flight review are successfully completed, there’s a $25 issuing cost. Be aware that flying a drone over 25 kg will also require an SFOC.
Special Flight Operations Certificate
In some cases pilots will have to apply for a Special Flight Operations Certificate (SFOC). Based on the CARs part IX regulatory structure, examples include operating a drone over 25 kg, flying at an advertised event, operating with foreign credentials (i.e. not a Canadian pilot) or operating outside the rules for Basic or Advanced operations, such as Beyond Visual Line-Of-Sight (BVLOS). Note, the requirements surrounding SFOC’s are under review as Transport Canada reassesses weight classes and streamlines the process, which can take weeks or months to complete. The new requirements are anticipated in late 2023 or early 2024 in Canada Gazette 2 (the 2019 update to Gazette 1 can be found here).
Recency
Once you have your Certificate(s) you must carry a copy with you while flying. Technically, Pilot Certification doesn’t expire, but you still have to maintain it. According to CARs 901.56, pilots cannot operate a drone unless they have successfully completed the following within 24 months preceding the flight:
Testing / Issue of their pilot certificate (Basic or Advanced).
A Flight Review
Any of the recurrent training activities set out in section 921.04 of Standard 921. This is an online questionnaire that has the answers posted right after each question. Don’t ask… just comply. Be sure to print it out after you complete it because it doesn’t save the answers.
Just like the Certificate, the pilot must have Proof of Recency with them at all times. Unlike certification, it’s free.
Learning from one another at a 2022 RPAS workshop in Southern Ontario.
Records
Every owner of a remotely piloted aircraft has to keep certain records. They need to be with you while flying for a certain period of time and all records must be transferred with the system if you sell or give it to a new owner.
The name of the pilot(s) and crew involved with each flight, noting time and date (keep with you while flying for 12 months).
Any maintenance, modification or repair of the RPAS, including precisely who did what and when. This should detail the instructions used to complete the work (keep with you while flying for 24 months).
Fines and Enforcement
Fines for contravening regulations range from a maximum of $3,000 for an individual to a maximum of $25,000 for a corporation. The RCMP and local police are part of the enforcement team.
Crop Protection Products Registered in Canada
This list is subject to change. To date, there are no pest control products registered for use in agriculture in Canada. There is no distinction between personal (i.e. home farm) and custom application. It is currently illegal to spray a registered agricultural product by drone. There are, however, two liquid formulation pesticides registered for non-agricultural use:
VectoBac 1200L – A biological larvicide intended for black flies and mosquitoes that must be applied over water sites. Label expanded in 2023.
Garlon XRT – A herbicide registered for industrial applications (e.g. controlling woody plants and vegetation in non-crop settings, such as around power lines and other utilities). Label expanded in 2024.
Final Thoughts
Get certified before you buy your RPAS, and do your research before you commit to a system. Rotor-based RPAS design is changing rapidly as manufacturers adapt to the demands of North American and European applicators. We once thought a swarm of lightweight, nozzled drones would be the path to success, and now the industry is leaning towards larger solitary drones with payloads over 40L and rotary atomizers instead of conventional nozzles.
Be sure you understand what they can and what they cannot do. Only buy from a reputable dealer with practical spraying experience, and not someone with slick advertising that over-promises RPAS work rate, swath width, reduced drift or improved coverage potential. Ask to see data and remember, at the time this article was written: In Canada, it is currently illegal to spray pesticides in agriculture from a drone, whether it is on your property or not.
For those on the fly, hit play to hear a shortened, narrated version.
I have far too many photos and videos of airblast sprayers blowing straight up through treetops, or downwind through the last row, during spring applications. I chose not to include any in this article to avoid people recognizing the operations. If you haven’t seen anyone doing it, maybe it’s you!
I recognize that it can be a tricky balance to adjust a sprayer for spring applications. It’s counterintuitive, but a bare tree can be difficult to spray. Young and/or bare trees represent small targets which have a very low catch efficiency, so a lot of spray will miss. Switching nozzles to adjust rates doesn’t help much in this regard – it’s far better to adjust travel speed and air settings, and we’ll get to that in a moment.
That lack of foliage also means wind moves through the orchard unabated, so the sprayer may have to blow a little harder into the wind to compensate. In the case of a low-profile axial sprayer, which blows laterally and upward, that means creating greater risk for blowing too high, and blowing through downwind rows.
That off-target deposition represents a huge loss of materials and potential for drift incidents. To add insult to injury, many of those early season applications often have oil components, which require a drench (higher volume) and are more easily seen by bystanders (opaque droplets). All in all, it’s a bad time of year for crop protection PR. Learn more about drift and drift prevention here: BeDriftAware.
Air Adjustments
So, let’s start with air. Air carries spray droplets, so perform a ribbon test to ensure the air outlets are oriented correctly. This is achieved by adjusting deflectors (e.g. low-profile axial), the air outlets on a tower, or the entire head on a wrap-around design with individual fan/nozzle combinations.
Spray height should always exceed the canopy height by a small degree. This compensates for the increase in wind speed with elevation, the potential loss of spray height with faster travel speeds, and uneven alleys that cause the sprayer to rock, which changes the spray angle.
It is less critical that spray align with the lower portion of the canopy. As air energy wanes, or as droplets begin to lose momentum, finer droplets will slowly fall, depositing on random surfaces. Coarser droplets will quickly fall towards the bottom of the canopy, settling primarily on upward-facing surfaces. This secondary deposition can also occur from the cumulative impact of blow-through from upwind rows.
Nozzle Adjustments
Now pay particular attention to which nozzles are on or off. Park the sprayer in an alley. Stand behind the sprayer and extrapolate a direct line from each nozzle to target canopy. Nozzles that point at the canopy should be left on. Nozzles that point above or below can be blocked, or turned off, via valves or rotating roll-overs.
Some roll-over nozzle bodies can be swiveled up or down 15 degrees to fine tune the spray angle. An alternative would be to permanently rotate the nozzle body fitting in the boom line. When aiming nozzles using a roll-over nozzle body, be careful not to swivel them too far or the valve will partially close and compromise the spray pattern.
When extrapolating, remember that the centre of a nozzle only indicates the centre of the spray pattern. Cone and fan angles can span 60 to 110 degrees, depending on the influence of air. Therefore, even though the centre of the lower-most nozzle intersects the bottom of the target canopy, you may still be able to turn it off because the nozzle above has that portion covered.
Travel Speed, Wind, and Coverage Assessment
Now let’s consider travel speed. If the wind is blowing hard through the orchard, you can increase the air speed or slow down the sprayer to focus longer. However, in both cases, you run the risk of overblowing the downwind rows by a considerable margin. Easily three rows in a high-density orchard.
This downwind coverage is cumulative, so when you assess your coverage (preferably using water sensitive paper), don’t do so until you’ve made a few upwind passes. So much of that spray ends up on the orchard floor, and still more evaporates or blows up, but some of it will hit and it adds up.
Downwind Boundary
Finally, pay attention to where you are in the block. It may be necessary to turn off the downwind bank of nozzles on the final downwind three (or more) rows. That means you’ll be performing the dreaded alternate row (one-sided) application, and I’ll be the first to say that’s not ideal. However, in this case, the spray will blow back and help cover the unsprayed side. Again, use water sensitive paper to confirm the job you’re doing.
Final Thoughts
And, of course, seriously consider when it’s time to wait for better conditions. No one likes to do that, especially when rain is imminent and the ground stays soft, but the alternative is a lot of waste and a poor application. If this always seems to be the fight you’re having, maybe it’s time to consider the return on investment of a tower sprayer, or a shrouded sprayer. Towers improve matters since they more easily reach the treetop without having to blow as hard, and without angling air upward. Shrouded recycling-style sprayers (if they fit the architecture) help even more.
Plan to do all of this (especially the capital investment number crunching) before the season starts and be prepared to change sprayer settings on the fly, as required. Don’t be the subject of my next spring drift photo.