Remote Piloted Aerial Application Systems (RPAAS) or Unmanned Aircraft Spray Systems (UASS) are generally referred to as drones. They are an increasingly common tool for pesticide delivery in modern agriculture. They offer flexibility and access to difficult terrain, are capable of broadacre and patch applications, and facilitate air-assisted applications over perennial canopies. As with all application technologies, careful attention to fundamentals, safety, stewardship, and regulatory compliance remain the cornerstones of responsible use.
This document summarizes current best management practices for pesticide handling and application using drones. It is intended to support training and adoption for operators from a wide range of backgrounds. Given the rapid evolution of drone design and the changing regulatory landscape, key considerations are addressed without being overly prescriptive.
Categorization and the Canadian Legal Environment
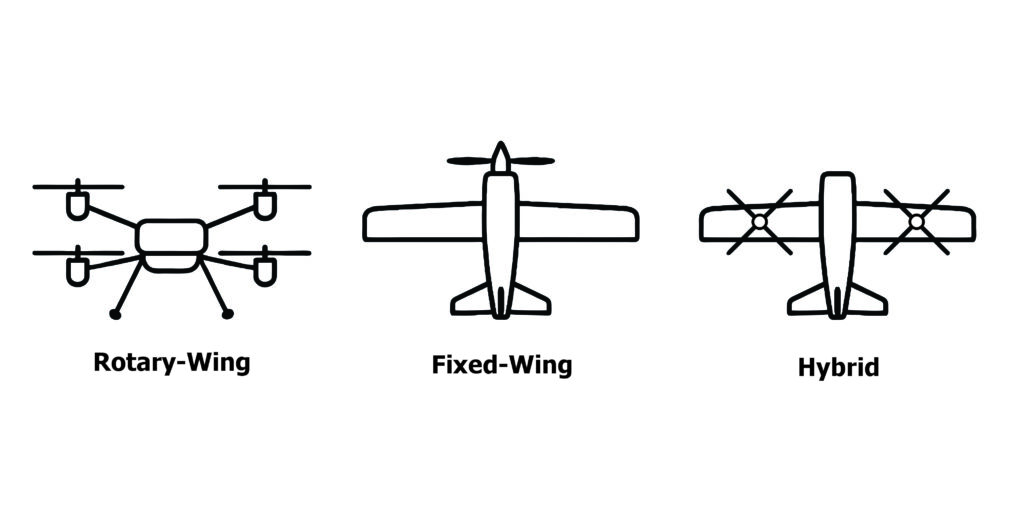
Drones can be divided into three design categories (Figure 1):
- Rotary-Wing: Single or multi-rotor, these drones employ vertical take-off and landing (VTOL) and can hover during spraying. They have relatively short flight times and low volumetric capacity.
- Fixed-Wing: Resembling crewed airplanes, these drones require a runway for take-off and landing. They have relatively long flight times, operate at higher speeds and have more volumetric capacity.
- Hybrid: Encompassing a range of designs including, for example, parasail-wing and VTOL-wing, this design combines aspects of rotary drones with the speeds, flight times and volumes of fixed-wing designs.
Drones are also categorized by weight, which is used to define their legal use:
- Small Drones (250 g to 25 kg): Typically have tank sizes up to 12 liters and speeds less than 25 km/h (10 m/s).
- Medium Drones (25 kg to 150 kg): Typically have tank sizes ranging from 12 to 70 liters and a maximum speed of 25 km/h (10 m/s).
- Large Drones (>150 kg): Typically have tanks >70 liters and a maximum speed of 72 km/h (20 m/s).
Pesticide use is regulated by both federal and provincial governments to protect human health and the environment. Anyone applying pesticides must ensure they are registered for use in Canada and must comply with all applicable federal and provincial/territorial requirements. Provincial rules vary, and it is the responsibility of the drone operator to understand and follow the requirements in their jurisdiction.
Transport Canada: Certification
Drone pilots must follow Canadian Aviation Regulations (CARS) Part IX. Drones must be registered and marked, and the pilot must carry valid pilot’s certification.
Table 1 lists each pilot certification (that is, Basic, Advanced, and Level 1 Complex) and permitted category of operation for small, medium and large drones. It is based on Transport Canada’s “Drone Operation Categories and Pilot Certificates: Overview (2025-11-04)”.
Table 1 – Drone Operational Categories and Pilot Certificates
| Basic | Advanced | Level 1 Complex3 | |
| Age minimum for certification1 | 14 | 16 | 18 |
| Fly in visual line-of-sight | Y | Y | Y |
| Closer to or over people2 | N | Y | Y |
| Small drones | Y | Y | Y |
| Medium drones | N | Y | Y |
| Large drones4 | N | N | N |
| Controlled airspace (air traffic control permitted) | N | Y | Y |
| Sheltered operators (small drones only) | N | Y | Y |
| Extended visual line-of-sight | N | Y | Y |
| Beyond visual line-of-sight | N | N | Y |
2Flying at an advertised event is considered a special operation, requiring permission.
3Operating a drone over 150 kg in Canada is classified as a high-complexity, specialized operation requiring a Special Flight Operations Certificate (SFOC) from Transport Canada.
4Operations with large drones are medium-complexity special operations and require SFOC permission.
Health Canada: Pesticide Labels
Health Canada is responsible for approving the registration of pesticides across Canada. Pesticide labels are legal documents and set rules on how a pesticide can be used. They define application rates, equipment settings, mixing instructions, environmental precautions, personal protective equipment (PPE), restricted-entry intervals, and disposal instructions.
As pesticide labels are updated to reflect drone applications, it is recommended operators consult Health Canada’s Pesticides Regulatory Directorate (formerly known as the Pest Management Regulatory Agency) pesticide label search tool for the most recent version. The pesticide must be registered for use on the target crop and pest and be permitted for application by drone. Questions regarding product label interpretations and uses can be directed to the Pesticides Information Service at pesticides-info@hc-sc.gc.ca.
Mission Planning
Proper field mapping and mission planning leads to safe and successful flights. Map obstacles, no spray zones, buffer zones, sensitive area/crops, areas of human activity, terrain, etc. Be aware that these conditions may change if planning occurs too far in advance of the spray day. Always check for relevant Notice to Air Missions (NOTAM), ensure the airspace is not restricted, and be aware of any other aircraft operating in the area.
Staging Area
Ideally, the staging area should be identified and prepared prior to the spray day. Select and clear a location for filling, take-off and landing that is safe for the operator, crew and equipment.
- The staging area should present clear lines of sight and support efficient operations.
- Drones should never fly over, or too close to busy roads.
- The staging area should be upwind of the target site to reduce operator exposure to drift.
- Bystanders must be at a safe minimum distance, as defined by the nature of the operation.
- The operator and crew must be a safe distance from the drone during take-off and landing. Flying over crew is prohibited.
- When spraying large fields, moving to an alternate staging area can save unnecessary ferry time, increasing efficiency and reducing battery strain.
- Identify and be prepared to use connecting points and perform a manual landing when needed.
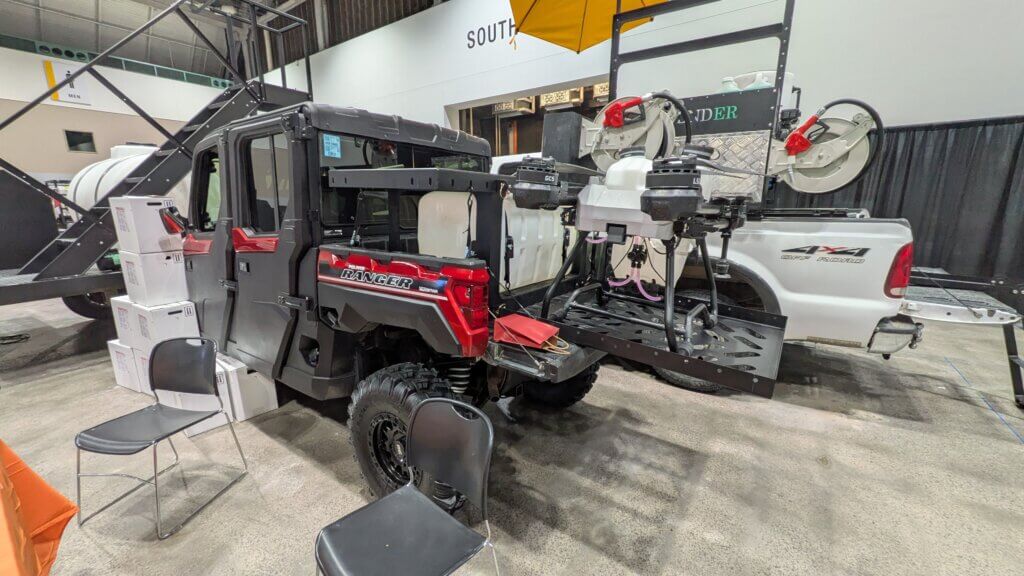
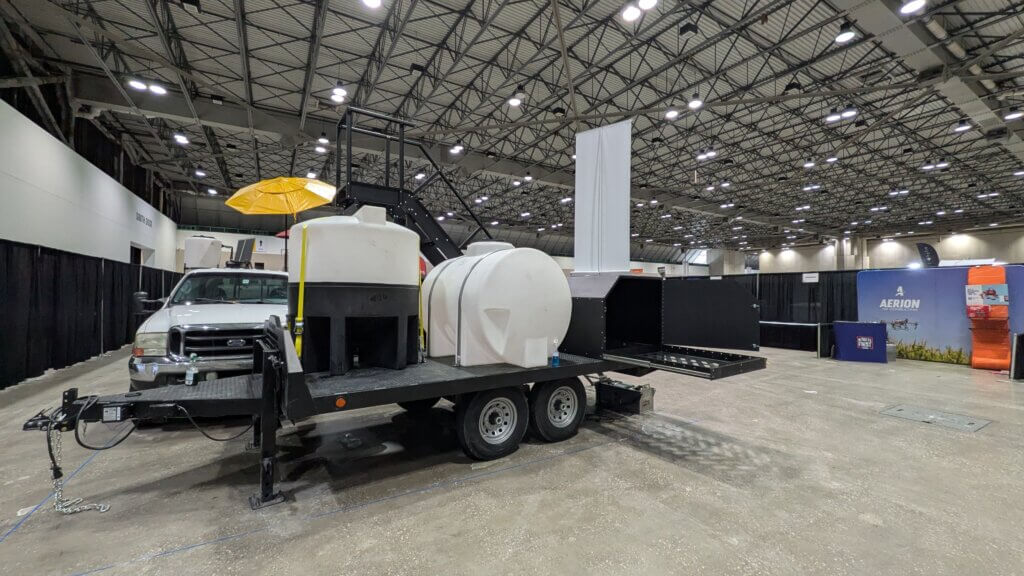
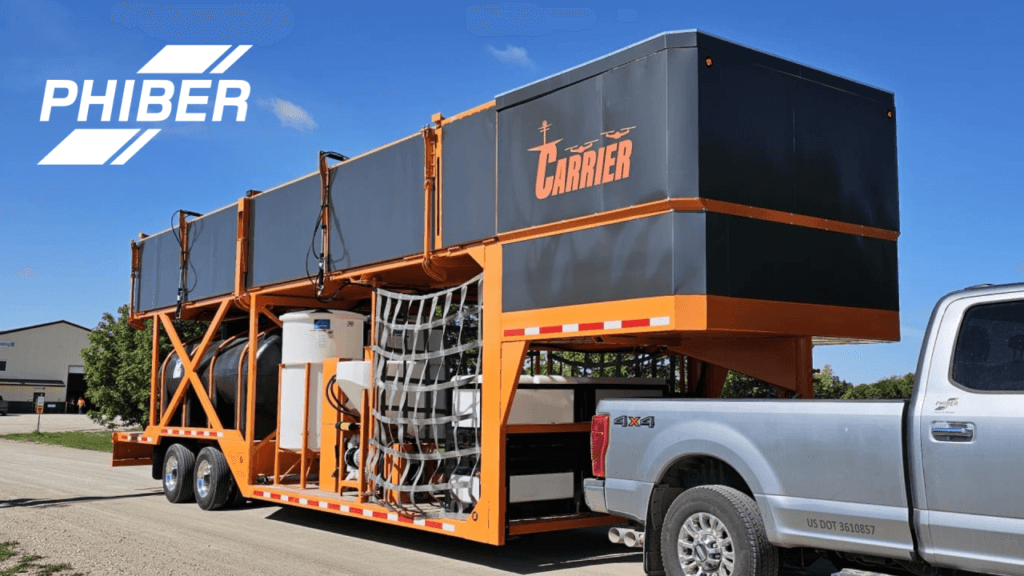
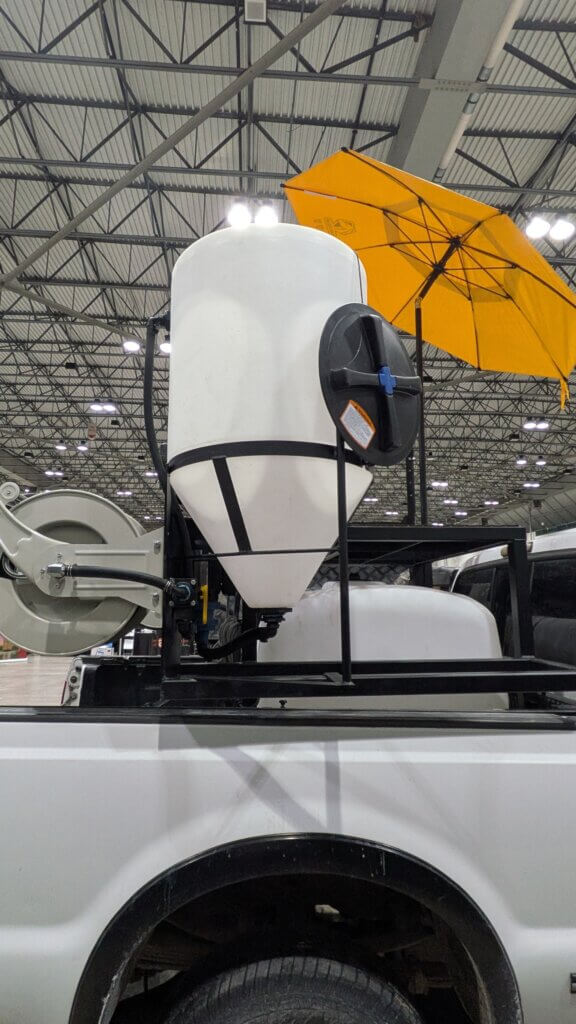
Tendering System
A drone tendering system is a required component. At minimum, they achieve four things:
- They supply onsite power.
- They store water and chemicals.
- They have a mixing and dispensing capability.
- They transport the drone(s).
Drone tendering systems vary in size, complexity, cost and capacity, depending on the nature of the operation. For example, licensed exterminators (that is, those paid to spray properties other than their own) may have additional needs beyond what is listed here.
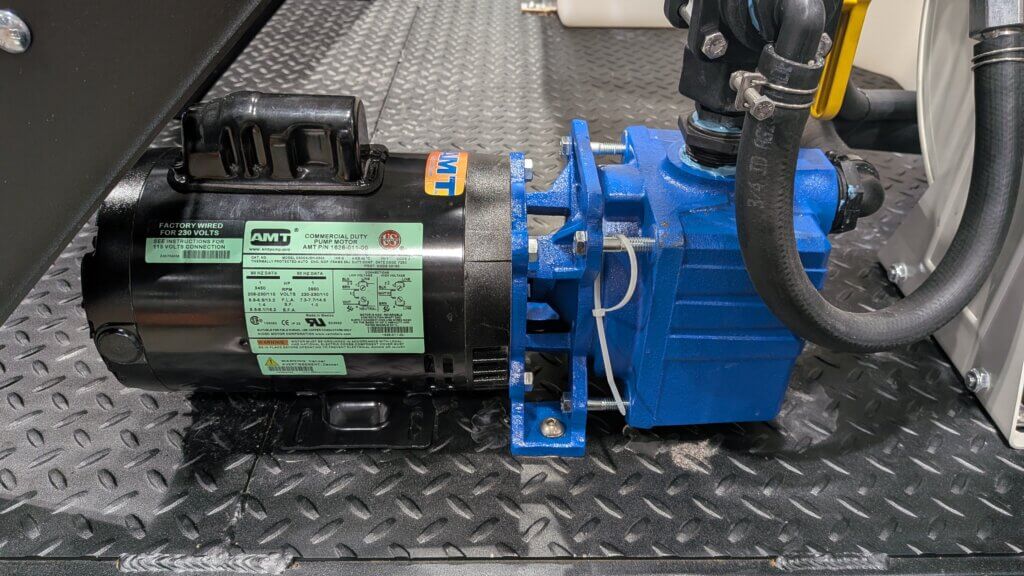
Mixing
Drone tanks are small and lack agitation. Therefore, most tendering systems include a nurse tank for pre-blending and agitating batches of spray mix. This helps ensure that active ingredients dissolve and disperse fully, that suspension products stay mixed and that the target site receives a consistent mix.
Water quality determines pesticide effectiveness; hardness, bicarbonate, pH, and turbidity can antagonize or degrade products. Water quality testing allows operators to correct potential problems before spraying. Higher spray volumes (that is, liters per hectare or gallons per acre) enable proper mixing and have been shown to improve spray coverage.
The act of mixing (and filling) carries the highest risk of operator exposure and environmental contamination. PPE requirements must be observed, and operators should avoid distractions or hurried work. Mix only the amount required for the task; leftover pesticide mixes create disposal problems and safety risks.
- Fill the nurse tank halfway with clean water. Backflow prevention (for example, a valve or air gap) protects the water source.
- Measure and add the pesticide, following the mixing order on the label and allowing time for each tank mix partner to dissolve and disperse. Tank mixing must be permitted on the label of each tank mix partner. Mixing multiple products at high concentration greatly increases the possibility of physical and/or chemical antagonism. If compatibility is in question, contact the manufacturers for guidance and conduct a jar test well in advance of spraying.
- Rinse jugs and measuring tools into the nurse tank.
- Top up with water and maintain agitation throughout the operation.
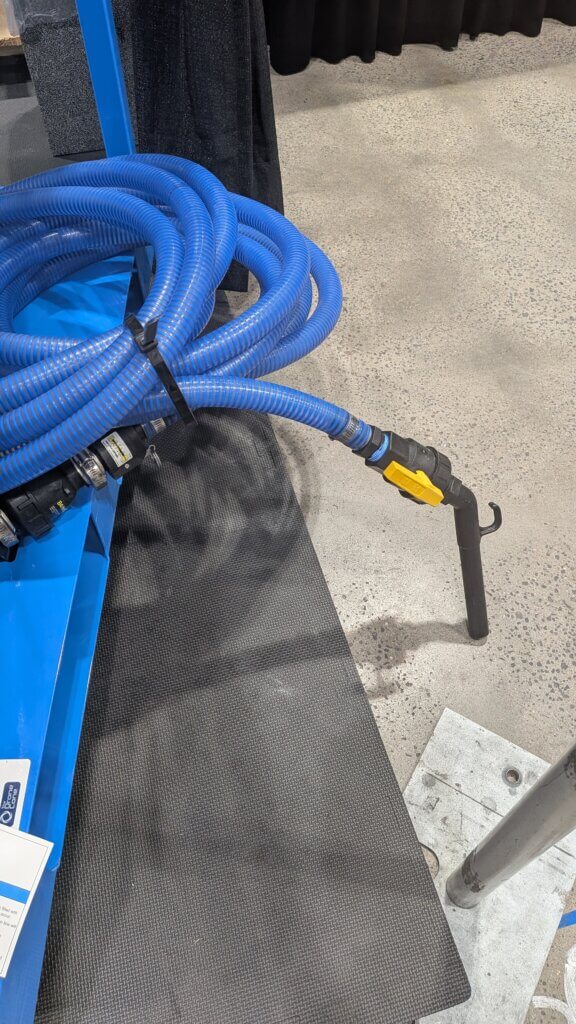
- Transfer the spray mix into the drone tank using the most closed system available.
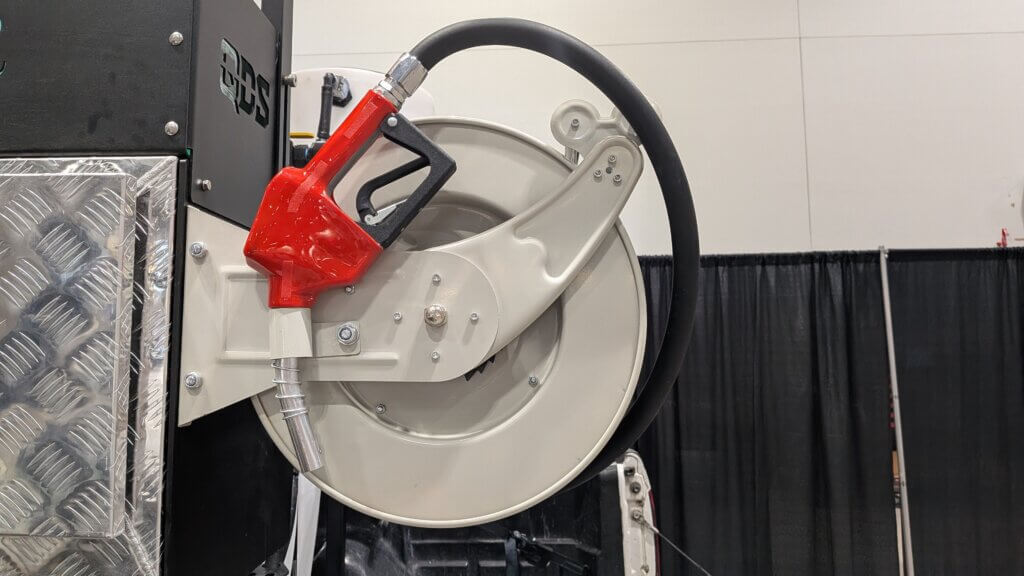
Filling and Battery Management
Rotary-wing drones carry relatively small spray volumes, so refills and battery swaps occur frequently. Large models, for example, might have a 10-minute flight cycle, where the refilling and battery swap processes are simultaneous and comprise less than 2 minutes.
Filling
Haste and inattention increase the chance of spills, overflows and leaks during refilling. This represents unnecessary point source contamination and operator exposure and must be avoided. While drone refills currently involve quarter-turn-valved faucets, or gas-station-style automatic fuel nozzles, neither are ideal. Industry is developing alternatives. Ensure filling is performed with the most closed system available.
Batteries
Batteries, like the drone, carry spray residue and must be handled using PPE. Some battery chargers feature water baths, misters or air conditioning. If water-cooled, treat the water as pesticide‑contaminated and dispose of accordingly. Batteries charge more efficiently and last longer if charged in a cool, ventilated location. Charge according to the manufacturer’s instructions.
Operator Comfort
Drone operations are physically and mentally taxing. Attention to operator comfort improves safety and efficiency. Even seemingly minor accommodations have positive impacts:
- Folding chairs combat operator fatigue.
- RV awnings, umbrellas, foldable Bimini-style tops or flip-up doors provide shade.
- Wear ear protection and consider lower-decibel equipment (for example, inverter gas generators are comparatively quiet, and electric pumps are even quieter).
- Enclose or locate loud components far from the filling area to reduce noise and emission exposure.
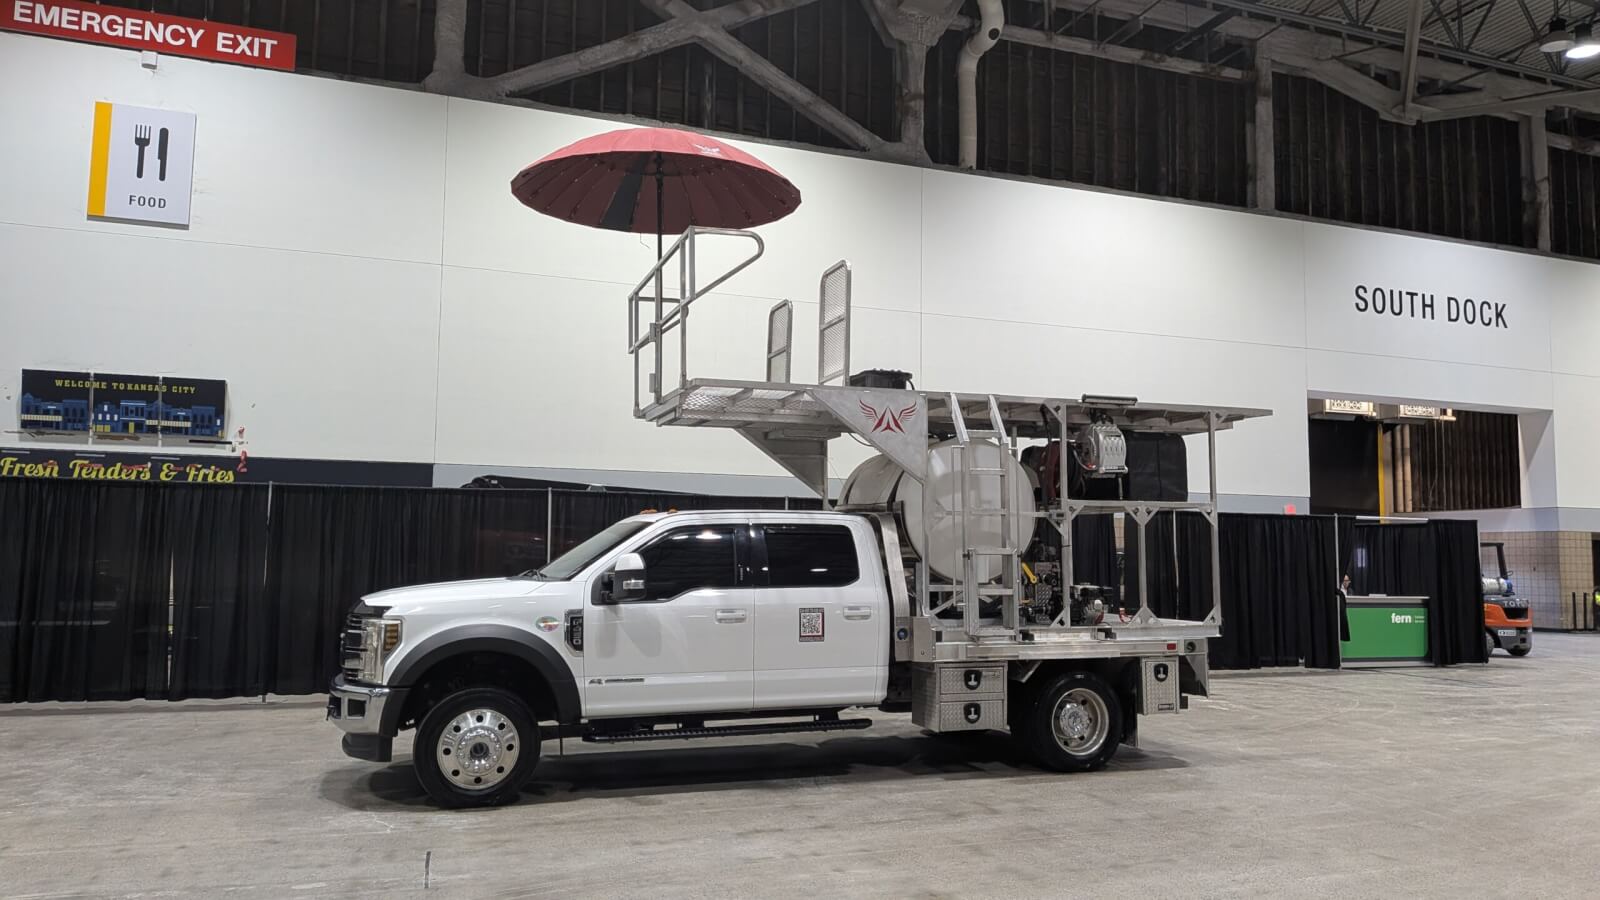
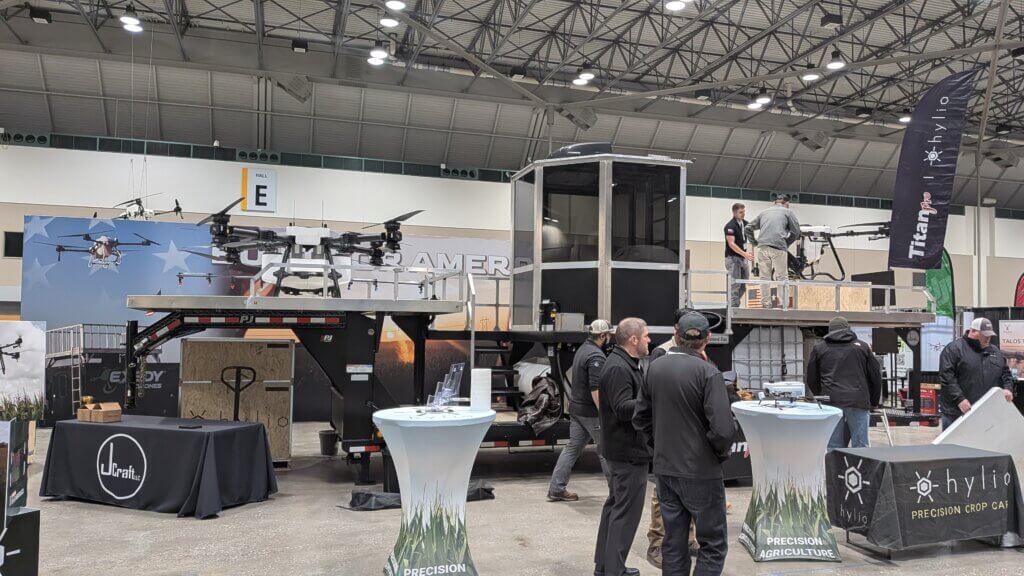
Elevated Platforms and Flight Decks
Line-of-sight and Connectivity
While “beyond visual line-of-sight” operations are allowed under specific, authorized conditions, most current regulations require operators to maintain a visual line-of-sight with the drone. This supports swath alignment, obstacle avoidance, an ongoing assessment of drift risk, and general operational safety.
Operating from an elevated platform can help maintain visual line-of-sight and improve connectivity between the flight controller and the drone. Real-Time Kinematic (RTK) is a satellite positioning technique that enhances GPS/GNSS data to provide centimeter-level accuracy in real time. An RTK platform will improve connection reliability and drone accuracy. Satellite internet providers can supplement connectivity in regions with unreliable cellular coverage. Be aware that network latency varies with provider.
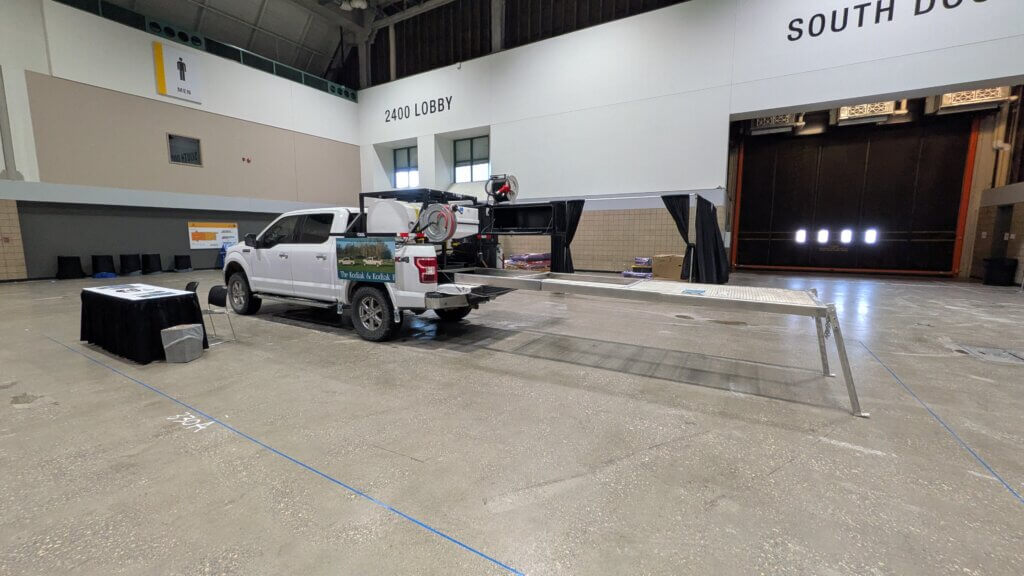
The safest approach is for the pilot to control the drone from an elevated platform while a loader performs refill and battery-swap procedures on the ground. However, if operating off a flight deck:
- Long flight decks keep landings and lift-offs at a safer distance.
- Decks with pull-out platforms or hydraulic wings can increase the operating area and can be adjusted to account for adjacent roads and the slope of the ground.
- A security rail around the landing area can prevent a drone from slipping off; A falling drone is expensive, but falling or sliding into an operator is a disaster.
- An enclosed operations area can improve operator safety and comfort.
Remember, the operator should be focused on the drone/controller when flying; Flight is not an opportunity for performing other tasks.
Cleaning
Proper cleaning prevents cross‑contamination, maintains equipment lifespan, and avoids crop injury from residues. Perform cleaning away from open water and ensure rinsate is disposed of responsibly. Follow the pesticide label and adhere to the manufacturer’s instructions on allowable cleaning methods. The following recommendations do not supersede either resource.
Triple‑Rinse Procedure
Multiple, small-volume rinses are more effective than a single, large-volume one. Follow the triple-rinse procedure:
- Ensure the drone tank is as empty as possible.
- Fill the drone tank 1/4 full of clean water and, with a partner, agitate by rocking the tank (if removable).
- Flush the rinse water through the plumbing and nozzles.
- Repeat the process twice more.
Employ a similar procedure to remove residues from the nurse tank plumbing systems. Important reminders when cleaning:
- Use a cleaning agent in the second rinse if recommended by the label. Soaking may be required.
- While the drone exterior should be rinsed, avoid pressure washing (to protect electronics) unless explicitly permitted by the manufacturer.
- Cameras and Lidar will not function if they are covered in residue.
- Commercial drone residue removers are available to assist in keeping the drone clean.
- Wash or dispose of PPE according to label and local regulations.
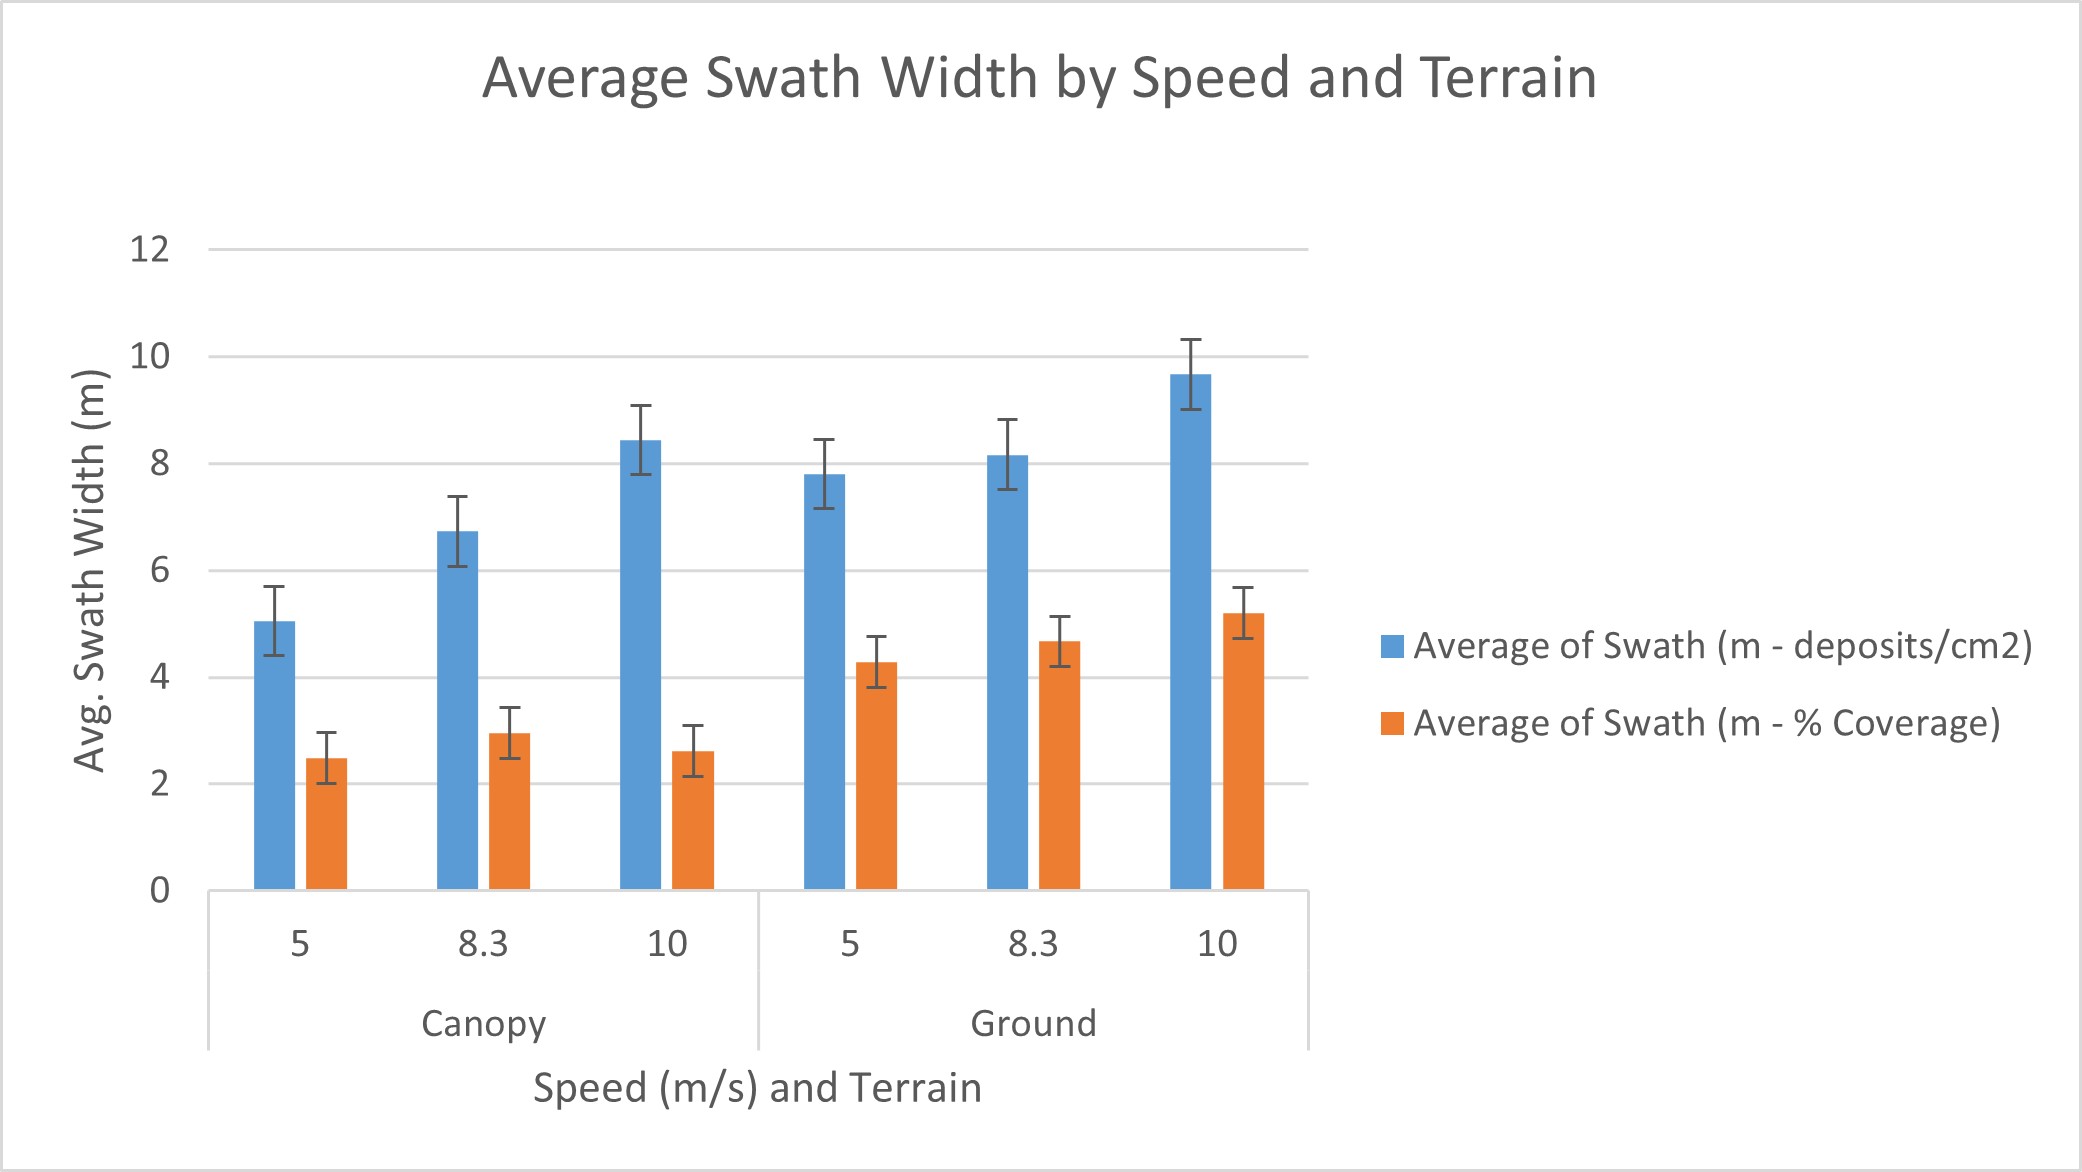
Swath Width and the Operational Use Case
For now, consider swath width to be the total width of the area covered in a single pass. Swath width is a fundamental variable for mission planning, ensuring the pesticide is applied at the correct rate and (in the case of broadacre operations) as uniformly as possible. A drone’s swath width is highly variable and affected by several factors, collectively referred to as the “Operational Use Case”. These factors include:
- Drone design (for example, atomizer type and location relative to the rotors)
- Operational settings (for example, altitude and travel speed)
- Meteorological conditions (for example, wind speed, wind direction, relative humidity)
Operational Settings
When configuring a rotary-wing drone for a mission, pilots select operational settings on the controller. The three settings that have the most influence on droplet behaviour, and consequently swath width, are droplet size, flight speed and altitude. A single change alters several other influencing factors, but the cumulative impact on swath width and drift potential is clear (Table 2).
Table 2 – Effect of rotary-wing drone operational settings on swath width and drift potential.
| Variable | Change | Effect on Swath Width | Effect on Drift Potential |
| Droplet size | Coarser | Narrows | Reduces |
| Droplet size | Finer | Widens1 | Increases |
| Flight speed | Faster | Widens2 | Increases2 |
| Flight speed | Slower | Narrows | Reduces3 |
| Altitude | Higher | Widens1 | Increases |
| Altitude | Lower | Narrows | Reduces3,4 |
2Current evidence suggests that at high speeds (>10 m/s) there may be a plateau where there is little or no further change to swath width or drift.
3Lower speed and/or lower altitude will increase the influence of downwash on droplet behaviour.
4Low altitude may not permit sufficient overlap of the spray from each nozzle, creating gaps in coverage.
Meteorological Conditions
Spray released from a drone (or any aerial sprayer) is highly susceptible to environmental conditions. Drift potential increases when:
- conditions are calm (inversion risk)
- windspeed is too high (physical drift)
- conditions are changeable (gusting and wind direction)
- conditions are hot and relative humidity is low (droplet evaporation)
Operators must observe label recommendations, local laws, and use good judgment to minimize drift potential. Practical methods include:
- increasing droplet size
- increasing volume
- adjusting passes (particularly along buffer zone) to account for swath offset
- halting operations when conditions favour movement toward sensitive habitat / crop / residential areas.
Be aware that drift-reducing adjuvants have an unpredictable impact on the droplet size produced by current rotary atomizer designs. Until rotary atomizer design is standardized and tank mixes can be evaluated, do not assume adjuvants will work as intended.
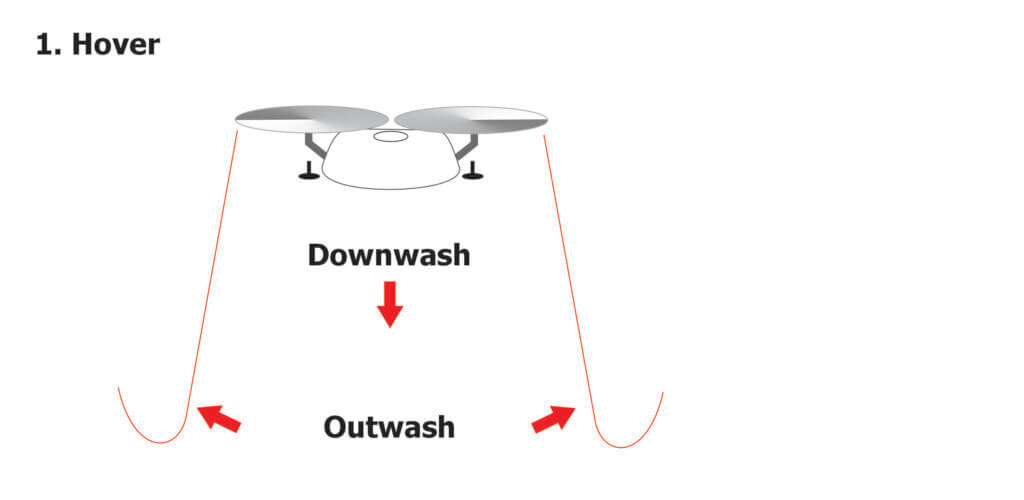
Downwash
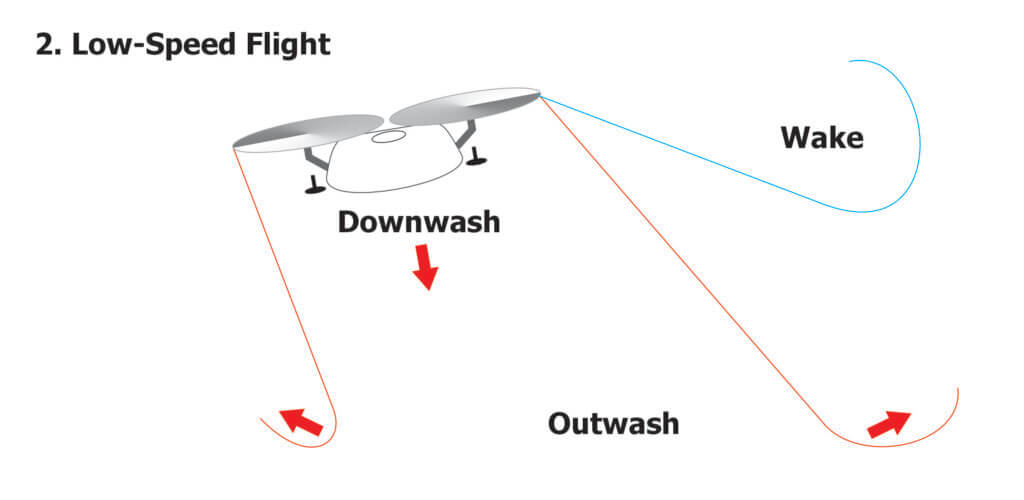
When a rotary-wing drone hovers, each rotor draws air from above and accelerates it downward in a high-velocity blast. The result is a vertical component referred to as the “downwash” and the turbulent splash of air that hits the ground and spreads laterally is the “outwash”. Droplets released beneath a drone at hover are almost completely entrained by the downwash. The majority get driven to the ground and then move laterally along the outwash, while a small portion (likely smaller droplets) recirculate back up through the rotors (see Figure 2a).
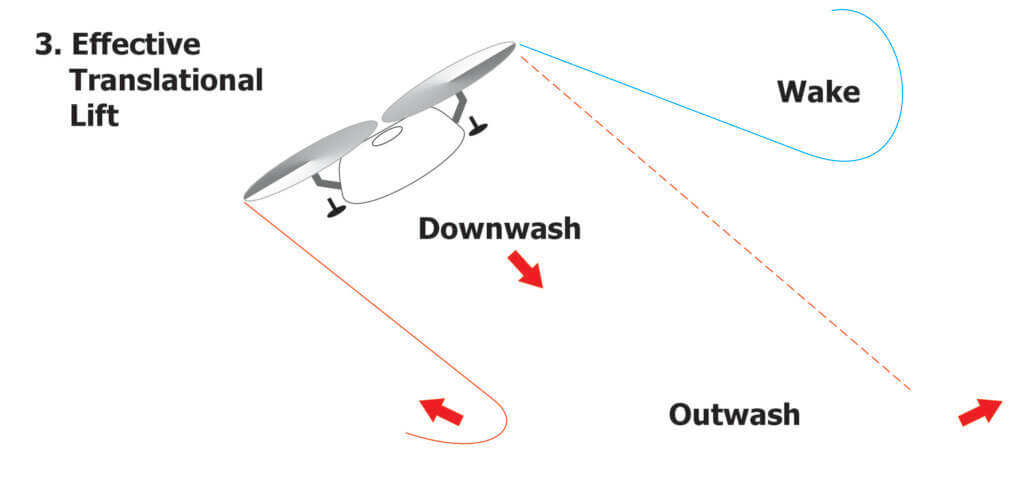
Most rotary-wing drones have fixed-pitch rotors, so the entire drone must tilt forward to enter low-speed flight. This causes the column of downwash to tilt backward. While the downwash is created by lift, “wake turbulence” is created at the tips of the rotors as high-pressure air beneath the rotor wraps around to the low-pressure area above. As the drone flies at low speed (~3 m/s) the wake can be visualized as a pair of counter-rotating, cylindrical vortices that trail behind. Spray is still mostly entrained by the downwash on a downward and rearward vector with deposition aligning closely to the flight path. However, a portion will get caught in the wake (see Figure 2b).
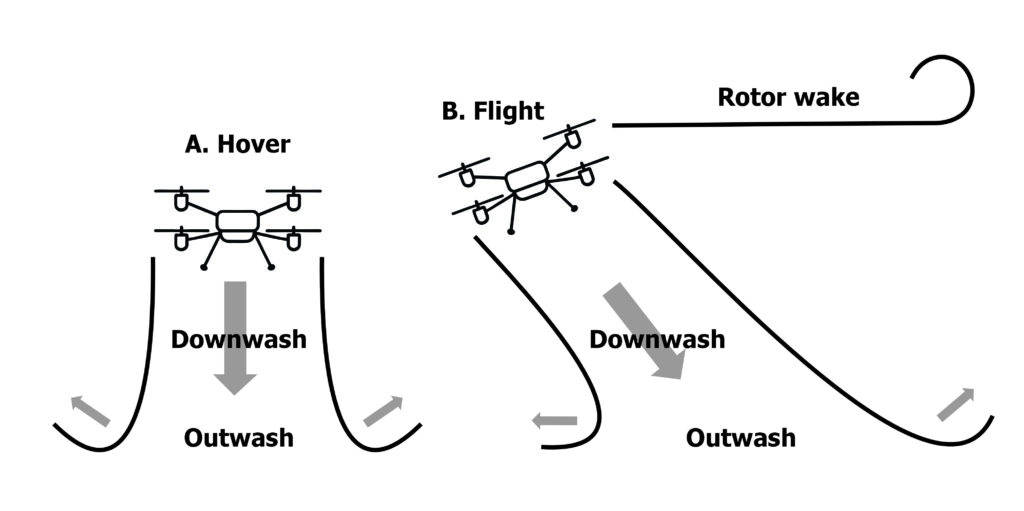
B. Rotary-wing drone at low-medium flight speed trails a lower-energy downwash and creates a rotor wake.
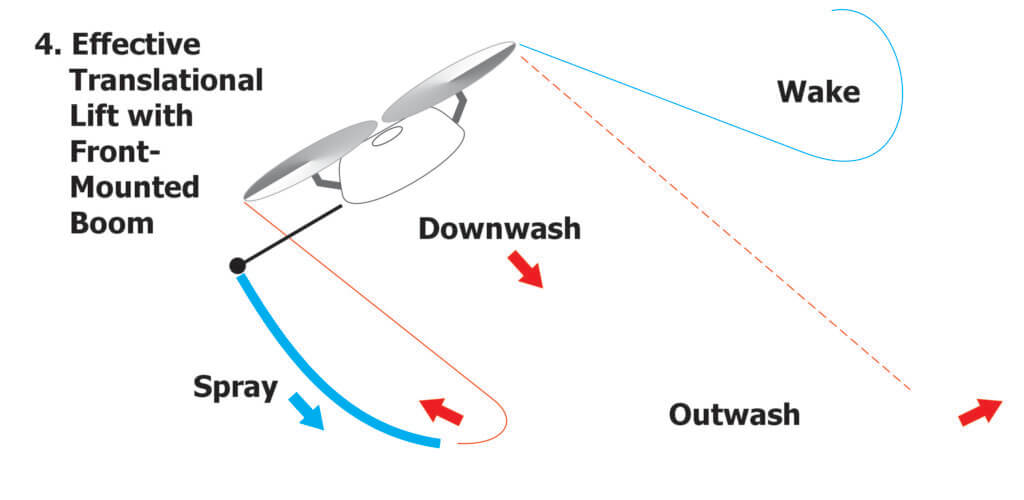
The effect of higher speed flight has not yet been fully characterized. However, there is evidence that the downwash will detach from the ground, directing the spray further back and with lower energy. This exposes droplets to deflection by wind and shifts a greater proportion of the spray into the rotor-tip vortices (that is, the wake). This makes higher speeds undesirable, as they result in increased drift and an unstable and unpredictable swath. There is evidence that at some point this relationship with speed may plateau, where there is no further change to swath width or drift.
Practical Impact
Operational settings, meteorological conditions and the downwash have a cumulative effect on droplet fate. Consider the following operational use case: A rotary-wing drone spraying back and forth over rolling topography will experience changing wind speed and relative direction. The drone will respond by changing drone pitch, rotor speed and pump flow to maintain the desired altitude, travel speed, and application rate. Meanwhile, the drone gets lighter as it sprays, thereby reducing the magnitude of the downwash. Ultimately, this results in a swath width that expands and contracts and may shift back-and-forth or be consistently offset along the flight path (Figure 3).
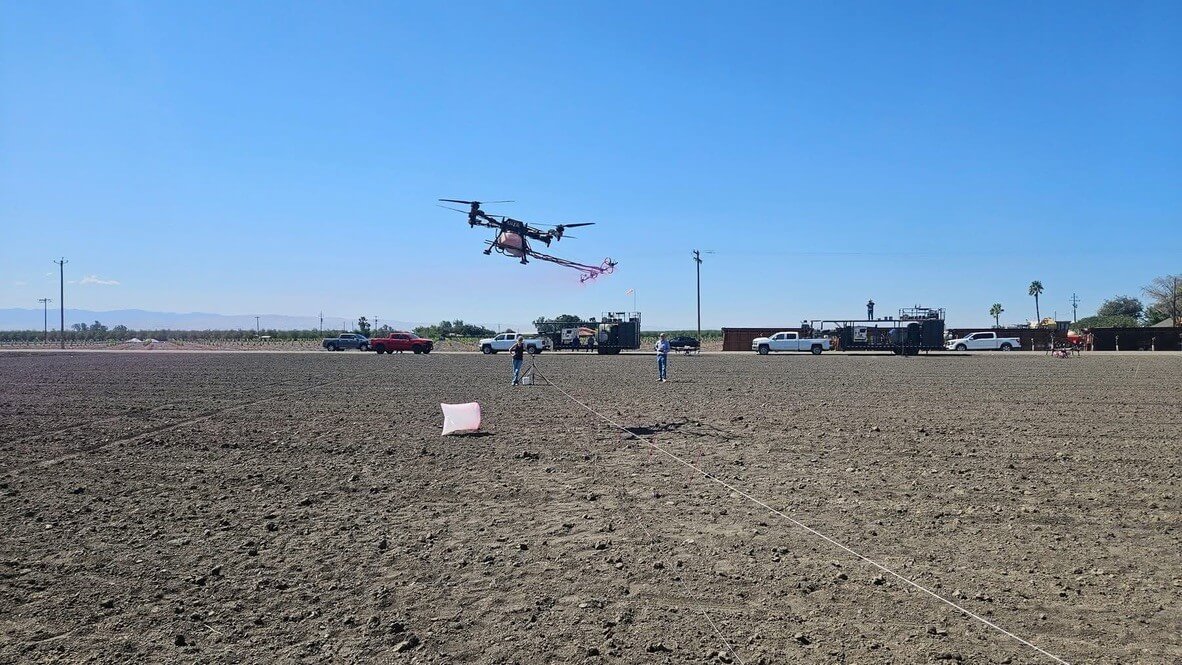
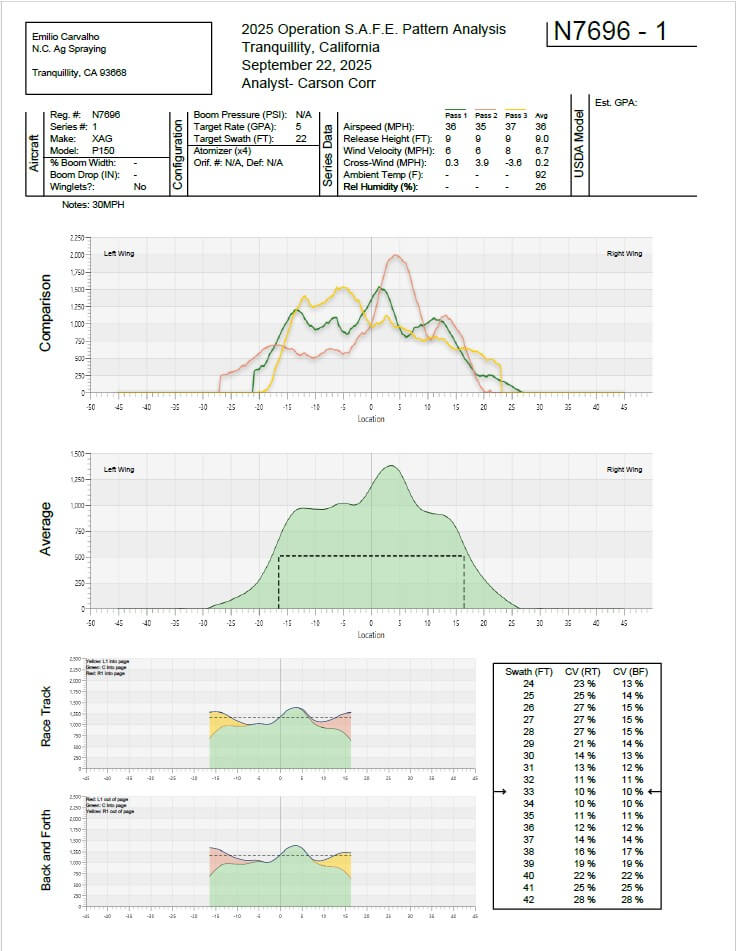
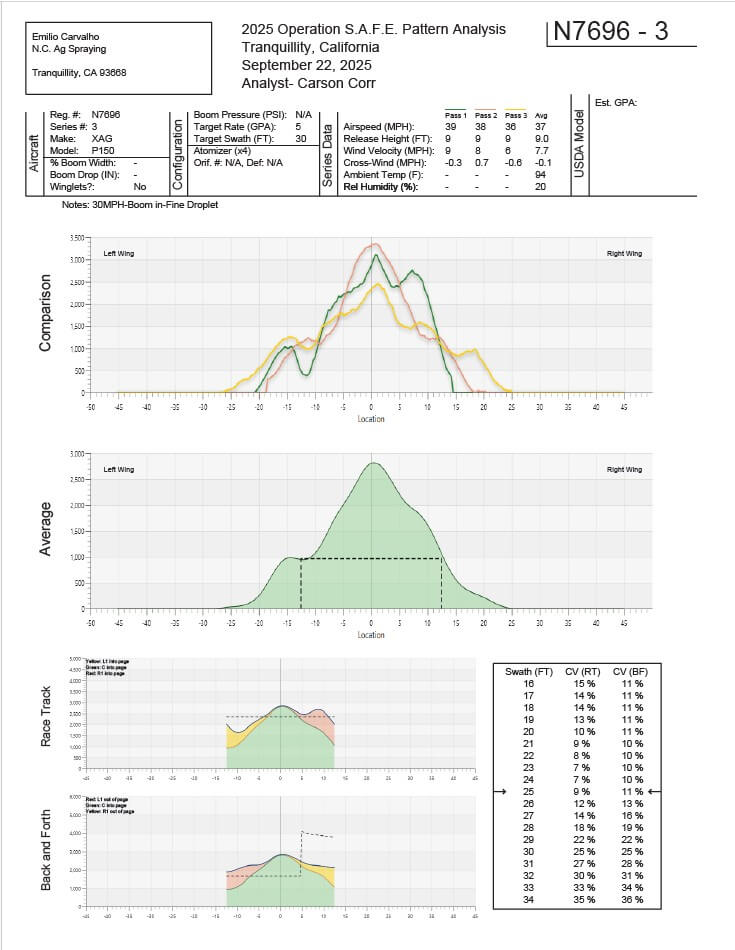
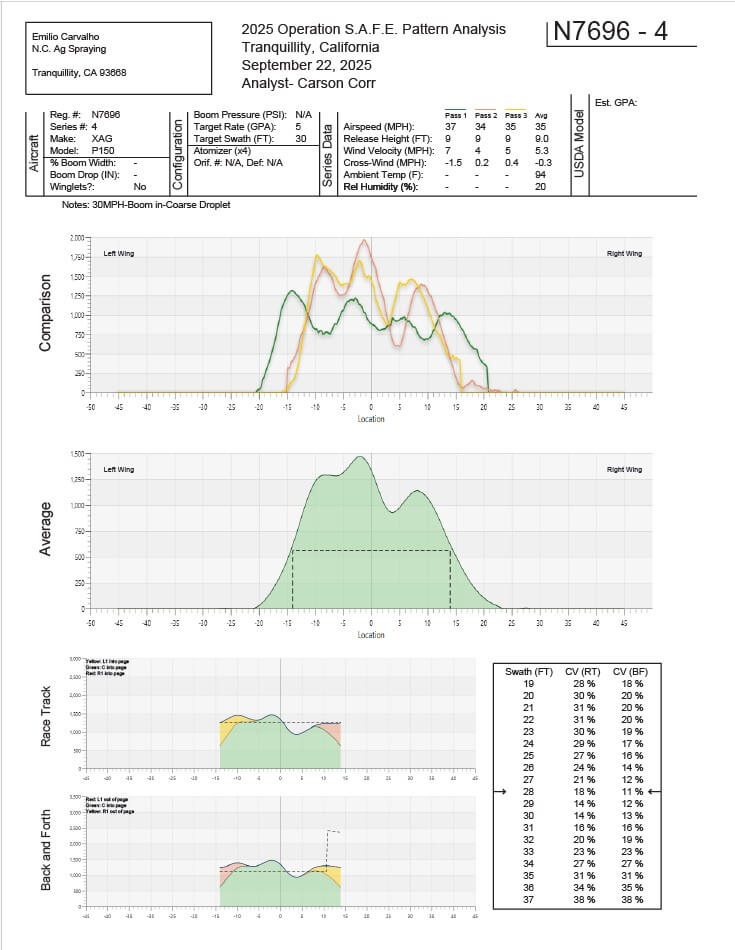
Evaluating Swath Width
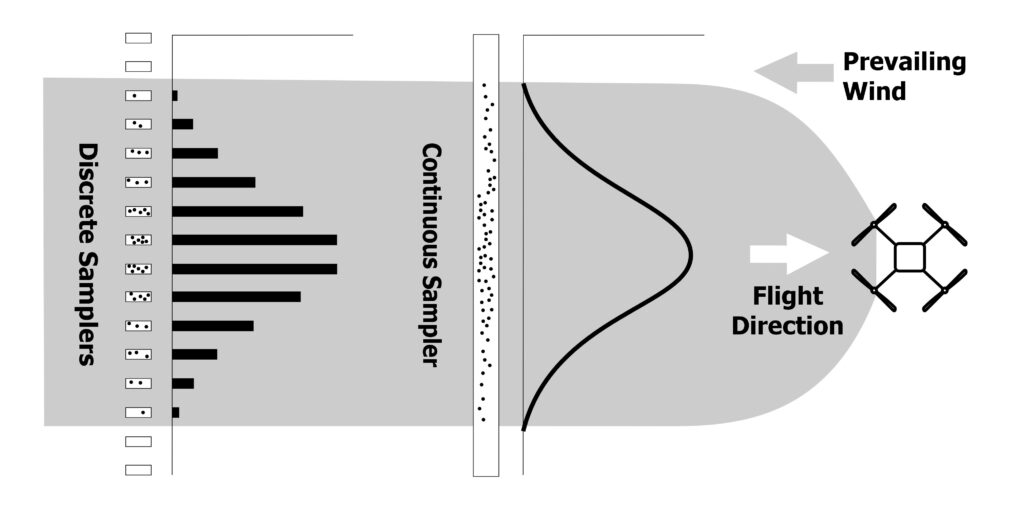
A drone’s swath width for a given operational use case must be determined through testing. The drone is first calibrated according to the manufacturer’s instructions. Swathing methods vary, but generally the drone is flown into the prevailing wind over a series of samplers (for example, discreet samplers like water sensitive paper or continuous samplers like string or bond paper). Multiple passes are required to capture the variability that occurs along the flight path (Figure 3).
A rotary-wing drone does not deposit droplets uniformly across its swath. There are fewer droplets at the extremes and more directly beneath the drone. This can be envisioned as a bell-shaped curve with a tight span and a high peak (Figure 4). This curve will skew with any lateral wind.
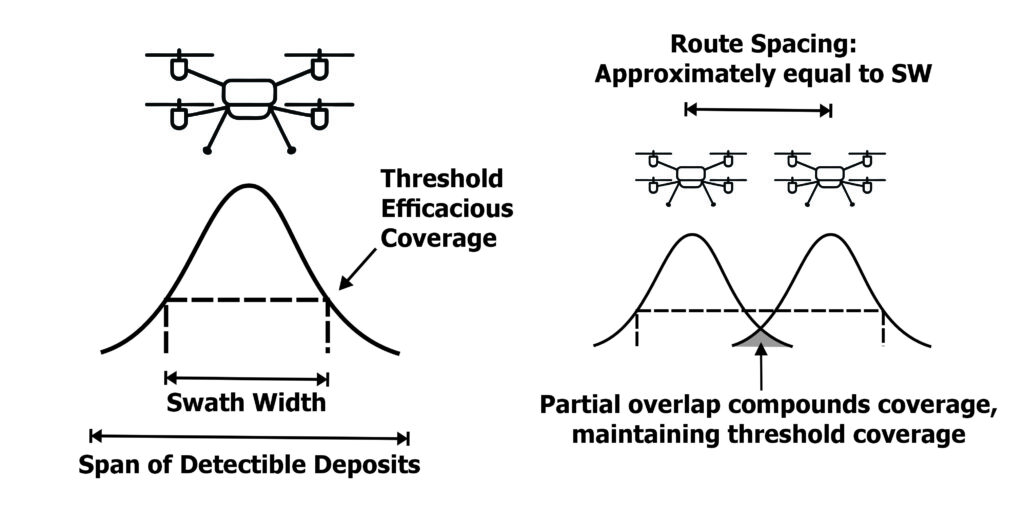
We must now refine the concept of swath width. Many drone manufacturers report the distance between the furthest detectable deposits as the swath width. However, variability within that span (specifically, the amount of active ingredient deposited, or the percent-area covered, and/or density of deposits) means the efficacy of the application can also be variable.
A more realistic and efficient estimate of swath width is one that presents the lowest variability (as indicated by the coefficient of variability, CV) while minimizing the degree of over- and under-dosing. This calculus requires an estimate of the coverage threshold that represents a minimum efficacious dose (that is, “how much is enough?”). Traditional aerial swath measurements estimate this as 90% of the maximum deposited. Online tools are available to help calculate the swath width from the span of detectible deposits.
This new definition of swath width matters during mission planning. The route spacing entered into the flight controller describes distance between passes over the target area, but this setting is independent of swath width. For instance, if the calculated swath width is 9 m, then entering a route spacing of 10 m will not change it. Therefore, if a uniform broadcast application is desired, the route spacing should match the swath width, which is often less than the span of detectible droplets (see Figure 5).
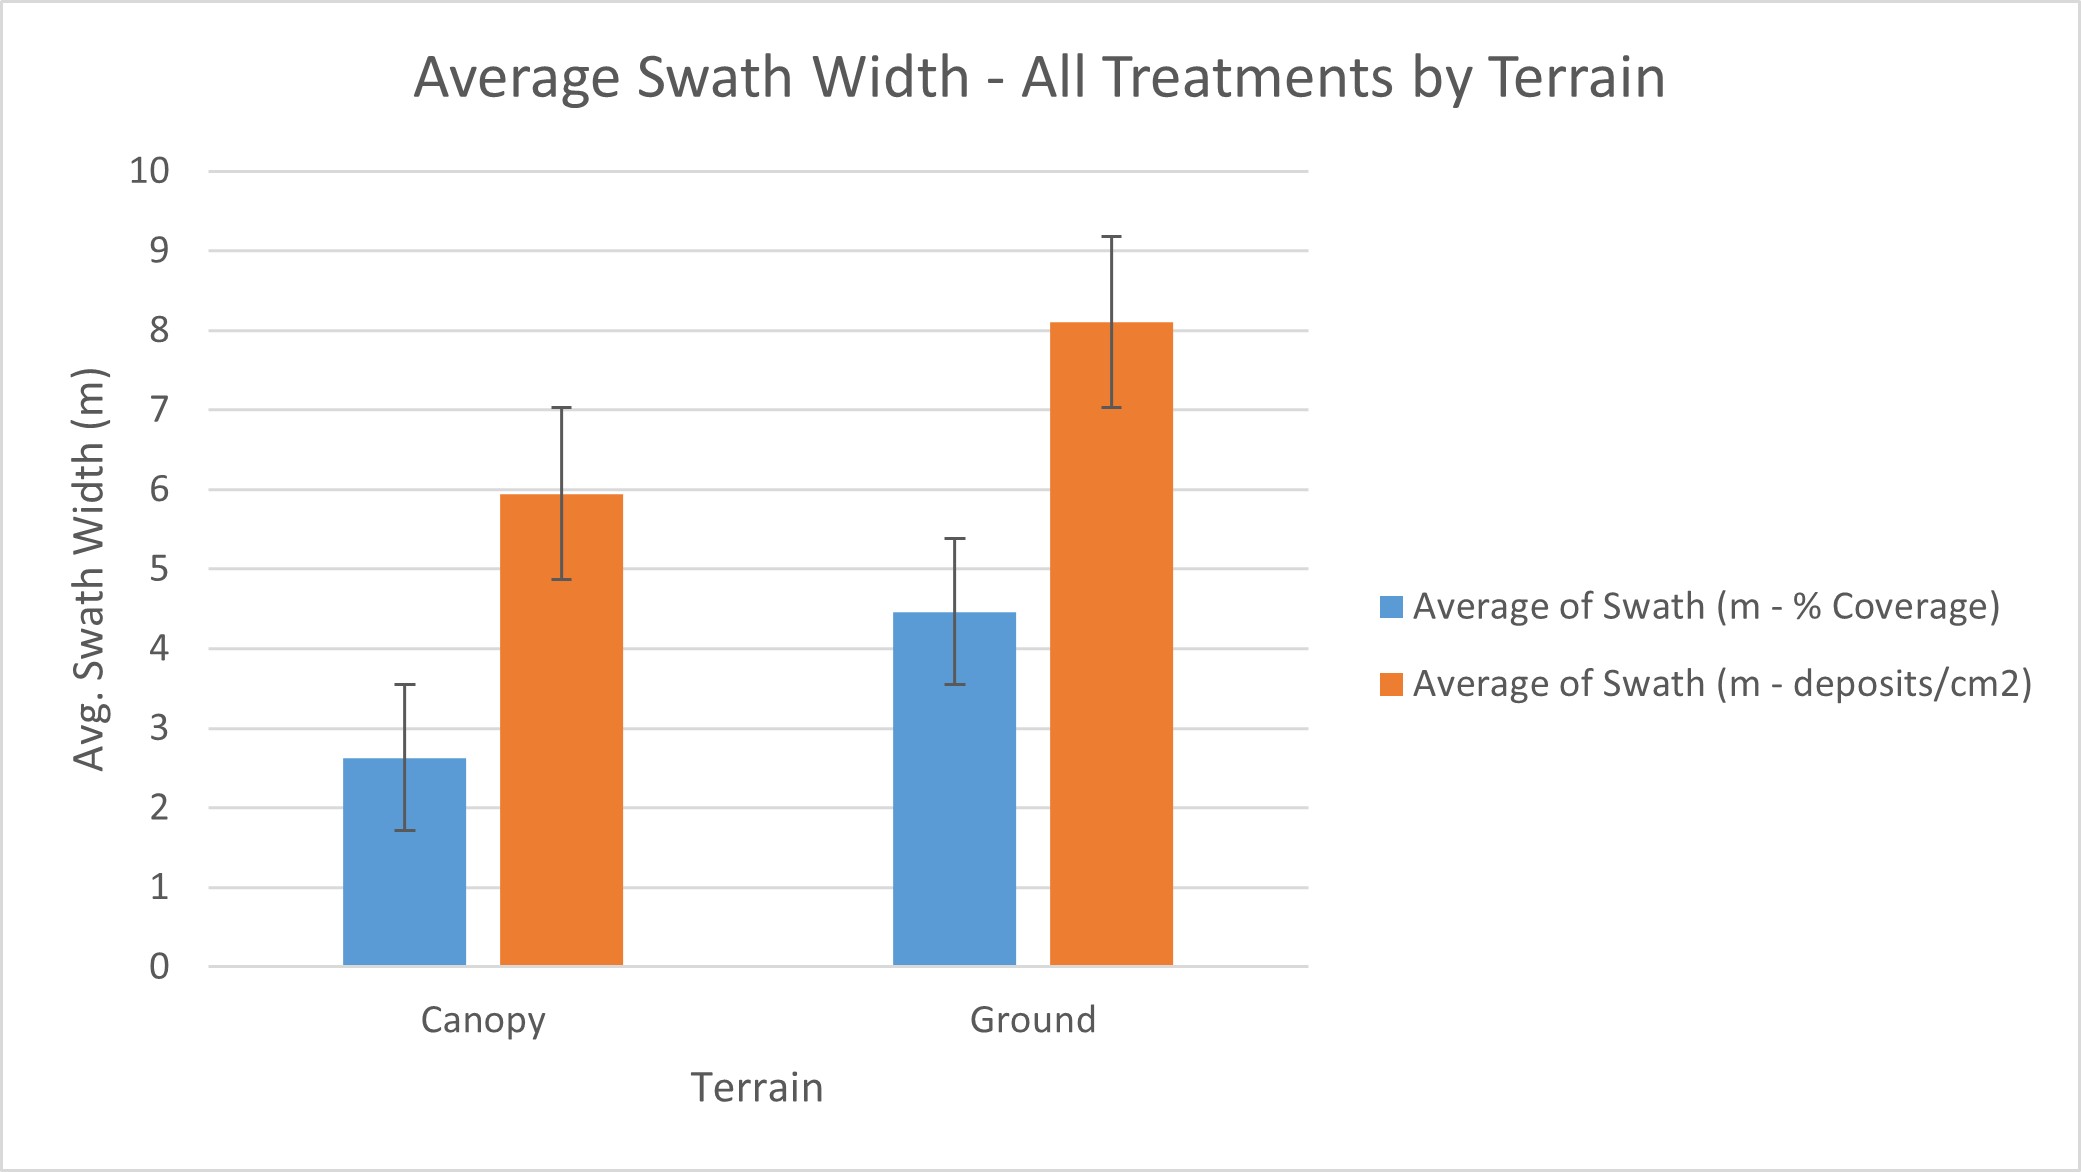
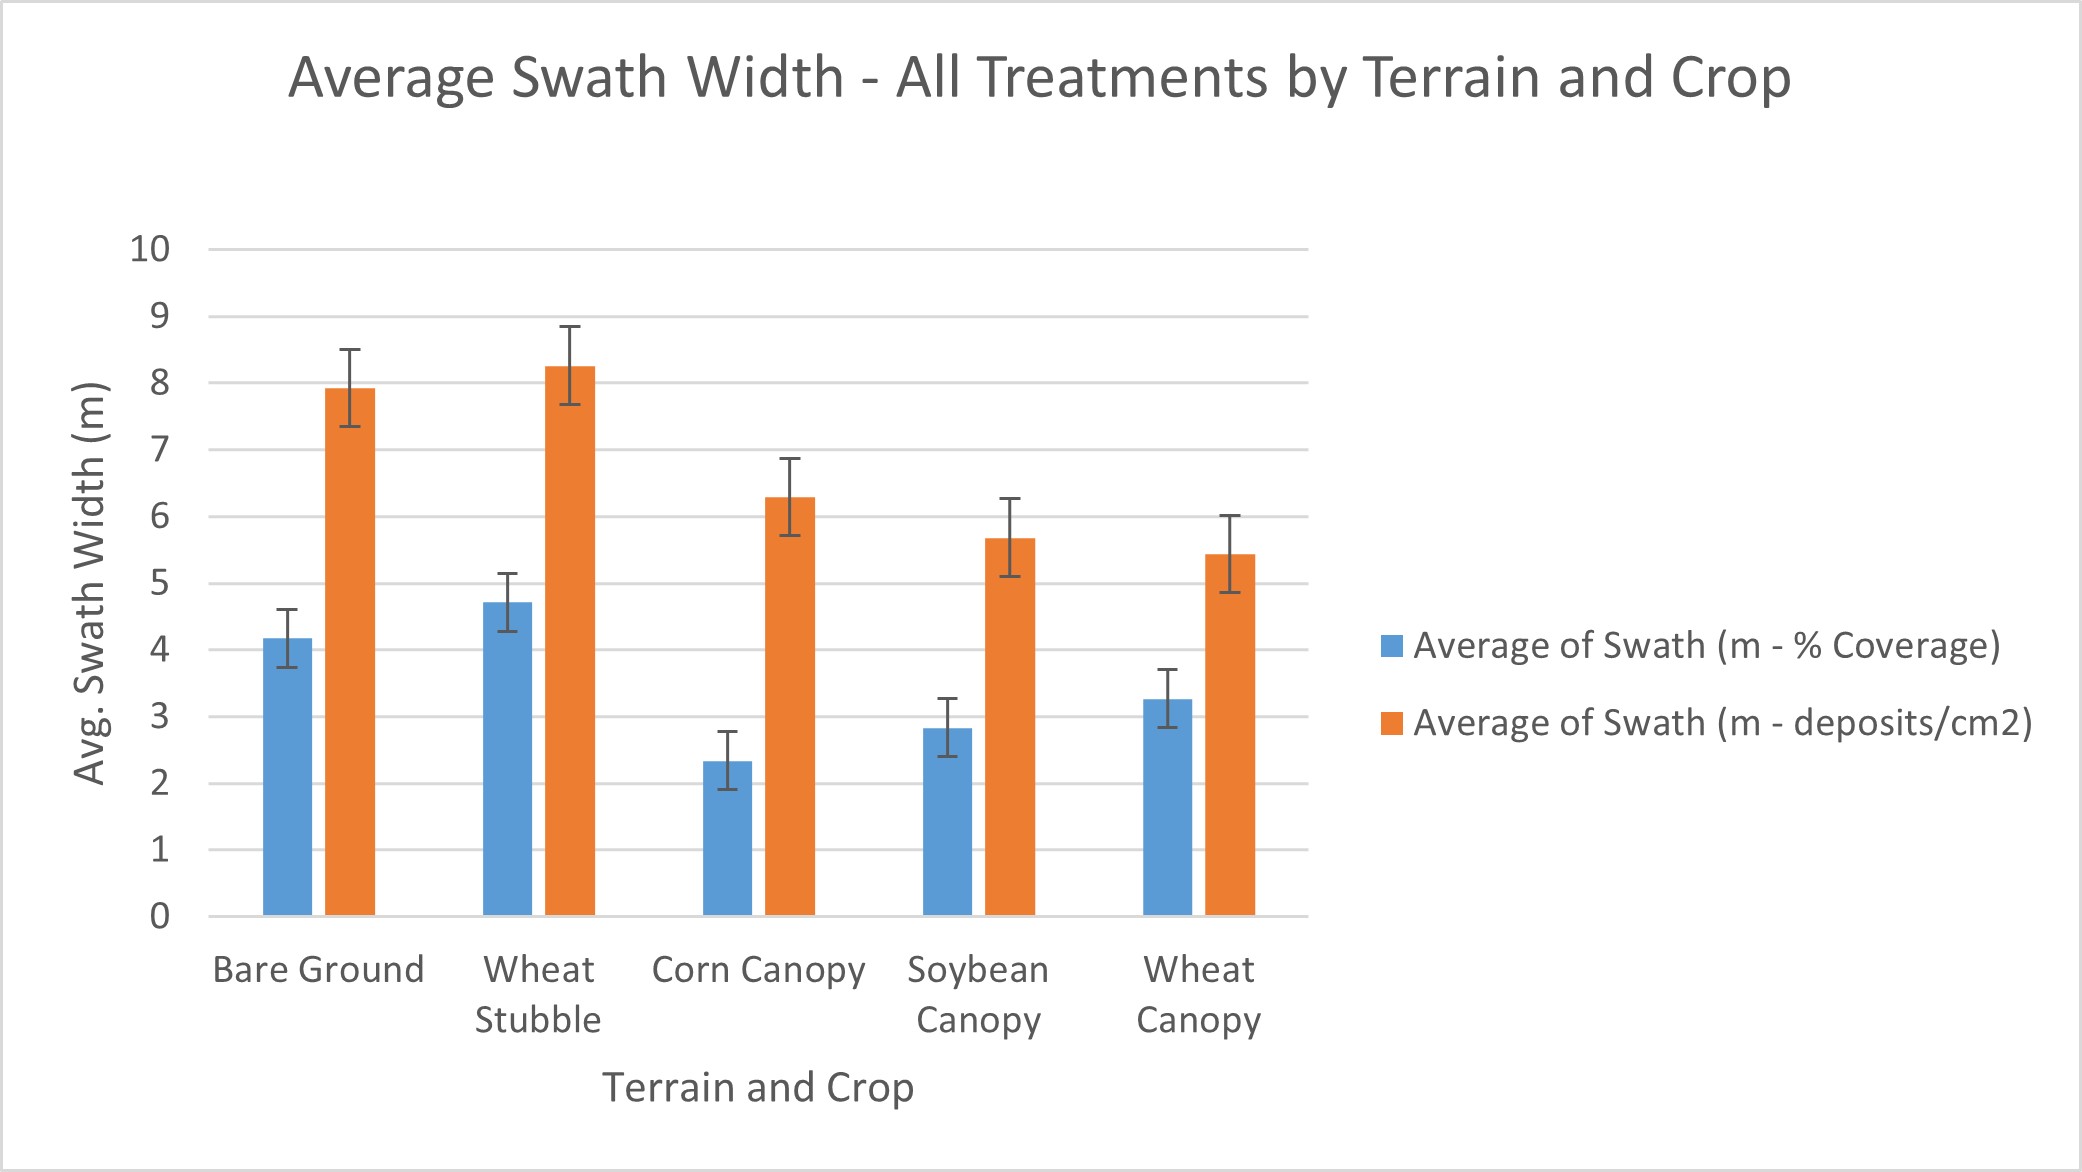
Effective Swath Width and the Agronomic Use Case
The relatively sparse coverage at the extremes of the calculated swath width may or may not be sufficient to elicit the desired biological result. This can happen if the estimate of threshold efficacious coverage is incorrect, or some other factor affects deposition.
The Effective Swath Width (ESW) redefines the concept, relying on efficacy, and not a measure of deposition, as a means for determining swath width. The two approaches can result in similar distances, but quite often they are different. For example, in the case of most fungicide applications, the ESW (or the actual width of biological impact) is only a fraction of the SW (the estimated width calculated from deposition testing). The degree of deviation is influenced by the “Agronomic Use Case” which includes factors such as:
- Minimum effective dose: This is a complex relationship between coverage, spray mix concentration and pesticide mode-of-action that results in an effective result while minimizing the environmental impact.
- Target location (for example, a pest within a dense canopy or a weed on relatively bare ground)
- Spray mix rheology (that is, the interaction of spray mix viscosity and atomizer design on droplet size)
Minimum Effective Dose
This is best explained by example. Consider a systemic herbicide and a contact fungicide.
A systemic herbicide mixed according to the label will kill weeds with less volume per hectare and less target coverage than is required for some fungicides and insecticides. Specifically, a systemic herbicide can still be effective at the extremes of the swath, where there is less coverage. The higher residues found in the middle of the swath are excessive, which may or may not be a liability. For example, certain crops directly beneath the drone (such as horticultural crops or GMO’s with stressed metabolisms) may experience phytotoxic damage. A contact fungicide requires relatively higher coverage and may not be effective at the extremes of the swath.
Therefore, two missions with identical operational use cases, but different agronomic use cases, can present the same swath width during testing, but have different effective swath widths.
Target Location
Spray coverage diminishes with canopy depth. The degree depends on crop morphology and planting architecture, as well as certain operational settings such as volume, droplet size and flight speed. Simply put, a plant canopy filters out spray droplets, and this occurs both vertically and laterally. This is not represented during typical swath measurements, which tend to take place on bare ground.
Spray Mix Rheology
Most conventional hydraulic nozzle designs adhere to an international standard. This allows the operator to determine the size of droplets produced for a given operating pressure and flow rate. Droplet size is a not only a critical factor in mitigating drift and improving spray coverage, but it is often a defined pesticide label requirement.
Currently, most rotary-wing drones employ rotary atomizers. This atomizer design is not standardized, and as a result, the droplet size selected on the controller will not necessarily produce the desired results. Studies have shown that changes in tank mix partners, concentrations, the inclusion of adjuvants, the flow rate and the atomizer design can produce droplets far larger or far smaller than intended.
Further, some atomizers are prone to “flooding” when the flow rate exceeds the atomizer’s capacity, and this produces a volume of larger, less-effective droplets.
Until rotary atomizers are standardized (or there is a return to conventional nozzles), operators can only select the desired size and infer the results based on in-flight behaviour and observing the size of the stains left on samplers during swath width testing.
Practical Impact
Taken collectively, research has shown a 20 to 30% reduction in ESW for corn, wheat and soybean fungicide applications compared to swaths measured on open ground. Conversely, herbicides sprayed on bare earth or sparse vegetation can produce an efficacious response 20% wider than the measured swath width (see Figure 6).
The impact of agronomic use case on ESW must be considered during mission planning, as this may warrant further adjustments to route spacing.
Acceleration and Deceleration
Swath width produced by a rotary-wing drone varies with flight speed, up to an estimated (but not yet confirmed) limit of approximately 10 m/s. As a result, swath width increases as the drone accelerates at the start of a pass and decreases as it decelerates toward the end.
Unlike crewed aircraft—which reach and maintain target speed before spraying—current software limitations prevent drones from separating flight and treatment zones. Consequently, swath width is inconsistent over approximately the first and last 50 m of each spray pass. To maintain uniform coverage, additional headland passes may be required at the beginning and end of each flight pass (see Figure 7).
Recordkeeping
Detailed recordkeeping will help operators better understand how operational and agronomic use cases affect the outcome of a spray mission. Quality records also help mitigate against any allegations of misapplication, such as a drift complaint. The following items should be recorded, but the list is not exhaustive:
- Product name(s), rate(s) and water volume.
- Sprayer operational settings (altitude, speed, route spacing, droplet size to supplement a digital record of the mission)
- Swath measurements
- Weather conditions
- Note of buffers and sensitive areas
- Crew names and roles
- Unusual events or corrections
- Results (return to site to assess efficacy)
Conclusion
Drone technology is advancing rapidly, and best management practices will continue to evolve with new research and more experience. However, the principles in this document—proper preparation, careful mixing, responsible application, diligent maintenance, environmental awareness and swath testing—apply regardless of model or agronomic use case.
Operators must ensure they are properly licensed and comply with all applicable federal and provincial requirements, including those related to the sale, use, transportation, storage and disposal of pesticides. With thoughtful planning, practice and recordkeeping, drones can be a safe and effective means of crop protection.
Thanks to Dr. Steve Li (Auburn University, College of Agriculture) and Dr. Michael Reinke (Michigan State University Extension) for their review of, and contribution to, this article.
Resources
- Airblast101 – Your Guide to Effective and Efficient Spraying. 2nd Edition. Deveau, J., Ledebuhr, M, Manktelow, D. Jan. 2021. ISBN 9781006916335.
- How to Calibrate a Drone. Wolf, T., Deveau, J. Apr. 2023.
- RPAS Coverage and Drift in Field Corn. Deveau, J., Ledebuhr, M. Jul. 2023.
- Best Management Practices for Safe and Effective Application of Pesticides Using Unmanned Aerial Spray Systems (UASS). Unmanned Aerial Pesticide Application System Task Force, Sep. 2024.
- RPAS swathing in broad acre crop canopies. Deveau, J. Nov. 2024.
- Characterizing RPAS coverage at four cardinal points on a vertical plane: Practical implications for spraying wheat at T3. Deveau, J. Jun. 2025.
- The Carvalho Boom and the Stages of Quadcopter Flight. Deveau, J. Feb. 2026.
- Drone Tendering – Considerations before Buying or Building. Deveau, J. Feb. 2026.
- Drone-Based Herbicide Application: Opportunities and Challenges Olumide S. Daramola, Thomas R. Butts, Simerjeet Virk, Bholuram Gurjar, Ubaldo Torres, Muthukumar Bagavathiannan, J. Anita Dille, Augustine K. Obour, Koffi Badou-Jeremie Kouame. Weed Technology. Feb. 2026.
- The Hidden Shape of a Drone’s Spray Swath: What 2-D Imagery Reveals. Falk, K. Mar. 2026.
- Droplet trajectories from rotary spray drone application: Implications for swath width measurements. Deveau, J., Wolf, T. Mar. 2026.
- A Drone’s Swath Width Tapers with Speed. Deveau, J. May 2026.


