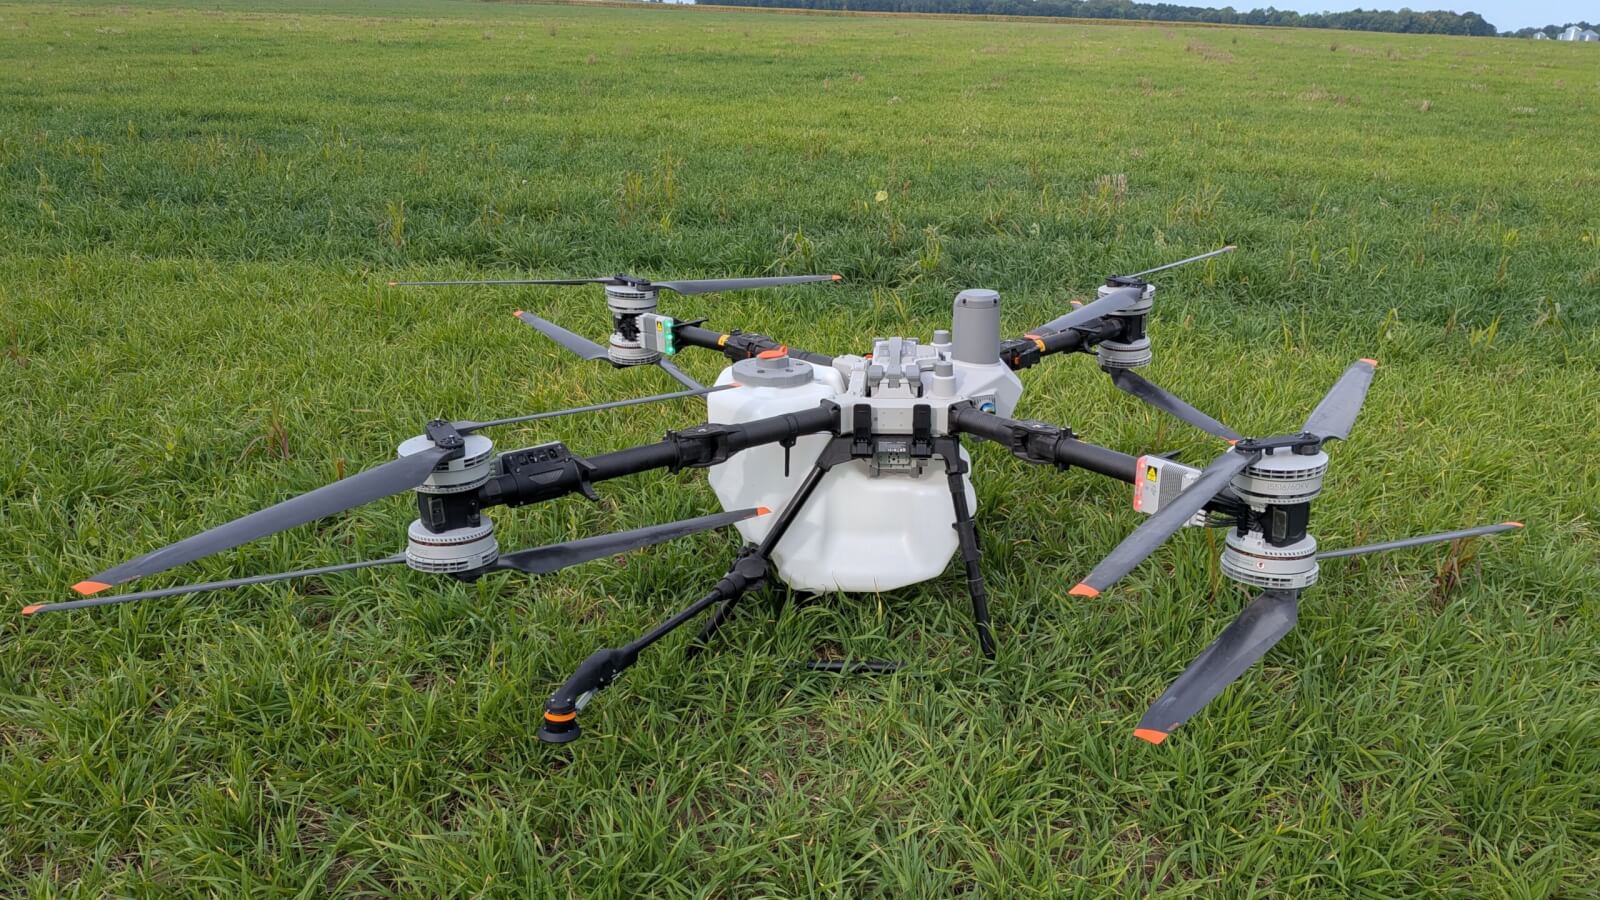
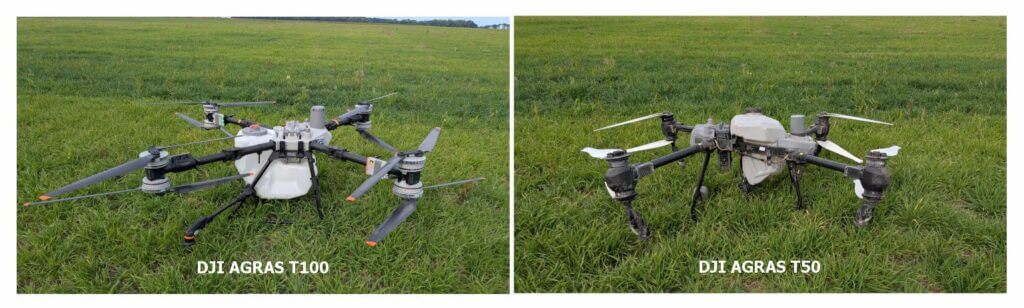
On July 15, 2025, DJI Agriculture announced the global launch of the DJI Agras T100. Compared to its predecessor, the T50, it features a larger payload for spraying and spreading and can fly at approximately twice the speed. The rotary atomizer-style nozzles (which DJI refers to as sprinklers) produce comparatively increased flow with an option to increase from two to four for orchard operations. Designed for large-scale commercial growers, it also features a new single-side spraying function to assist with sharper field boundaries and infield obstacles.
On September 13 we performed some preliminary trials comparing it to the T50. We applied Roundup Transorb HC (PMRA research authorization 0054-RA-25) in plots over a 160-acre field of wheat stubble. While the results of this study will appear in a later article, we wanted to capture our initial observations.
Weight and Dimensions
In Canada, Remote Piloted Aircraft (RPA) are regulated under the Canadian Aviation Regulations (CARs). Part IX of the CARs deals with RPA by operating weight and complexity of the operation to be conducted. Prior to recent amendments (which came into force in November 2025), Part IX covered up to and including 25 kg (55 lb) flown in visual line of sight (VLOS). Other operations like above 25 kg and Beyond VLOS operations required a Special Flight Operations Certificate.
The 2025 amendments to Part IX added operations of medium RPA that weigh more than 25 kg (55 lb) up to and including 150 kg (331 lb) and introduced rules for beyond visual line-of-sight (BVLOS), sheltered, and extended VLOS operations.
| T50 | T100 | |
| Empty weight | 52 kg | 75 kg (2 nozzles 77 kg (4 nozzles) |
| Max. takeoff weight (full liquid tank) | 92 kg | 175 kg (2 nozzles) 177 kg (4 nozzles) |
| Dimensions (arms & rotors unfolded) | 2,800 × 3,085 × 820 mm | 3,220 × 3,224 × 975 mm |
If flown full, the T100 will be 25 kg beyond the medium RPA category. Therefore, Canadian pilots will have to apply for a Special Flight Operations Certificate (SFOC). Similarly, DJI notes that when using the T100 in Australia, pilots are to follow local regulations and keep the maximum takeoff weight at 149.9 kg.
The additional size and weight may make handling and transportation more challenging (e.g. lifting the RPAS out of a vehicle). Regarding spray performance, it remains to be seen if the greater weight of the T100 will appreciably increase the magnitude of the downwash, or perhaps this will be negated by the potential for greater travel speed (see Dwell time).
Tank and nozzles
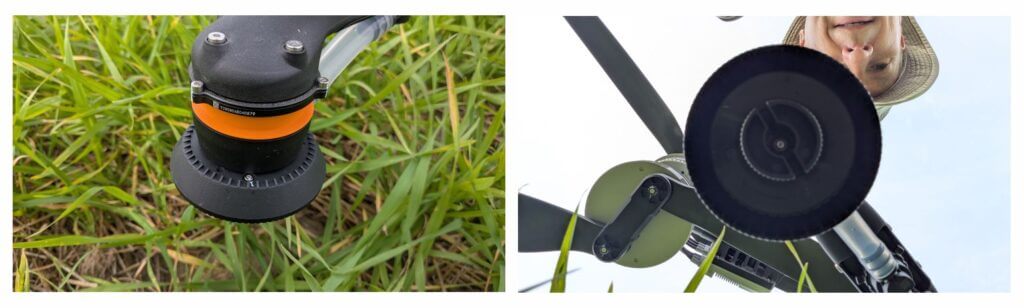
Both the T50 and T100 have HPDE tanks (neither with agitation). The rotary atomizer nozzle (aka sprinkler) design has changed. According to DJI’s promotional video, the atomizers are “water cooled”. Our assumption is that the spray mix itself serves as a heat-exchanging coolant. This will come up later in this article.
| T50 | T100 | |
| Liquid tank capacity | 40 L | 100 L |
| Atomizer model | 2 or 4 LX8060SZ standard sprinklers | 2 LX07550SX, standard sprinklers 2 LX09550SX, optional mist nozzles for orchard spraying |
| Atomizer flow rate | 16 L/min (2 sprinklers) 24 L/min (4 sprinklers) | 30 L/min (2 sprinklers) 40 L/min (2 sprinklers plus 2 misters) |
| Droplet size | 50 – 500 μm | 50 – 500 μm |
| Span between nozzles | 1,570 mm (between rear nozzles) | 1,834 mm (between rear nozzles) |
| Effective swath width | 4 – 11 at 3 m altitude | 5 – 13 m (no altitude specified) |
DJI states that droplet size was “measured by a laser particle size analyzer, with a 50-micron diameter using the Dv50 standard”. It is notable that they do not refer to ASABE S572.3 or ISO 25358:2018, which are standards that define nozzle spray quality. Canadian pesticide labels will require compliance with these standards when the application of agricultural pesticides is eventually permitted.
It would be interesting to confirm if the new atomizers can actually produce the median droplet size indicated on the controller. Historically, and to differing degrees, RPAS rotary atomizers suffer from a “flooding” issue. This is a condition where flow to the nozzle overwhelms its ability to atomize the fluid, degrading the spray pattern and creating coarser, heterogenous spray.
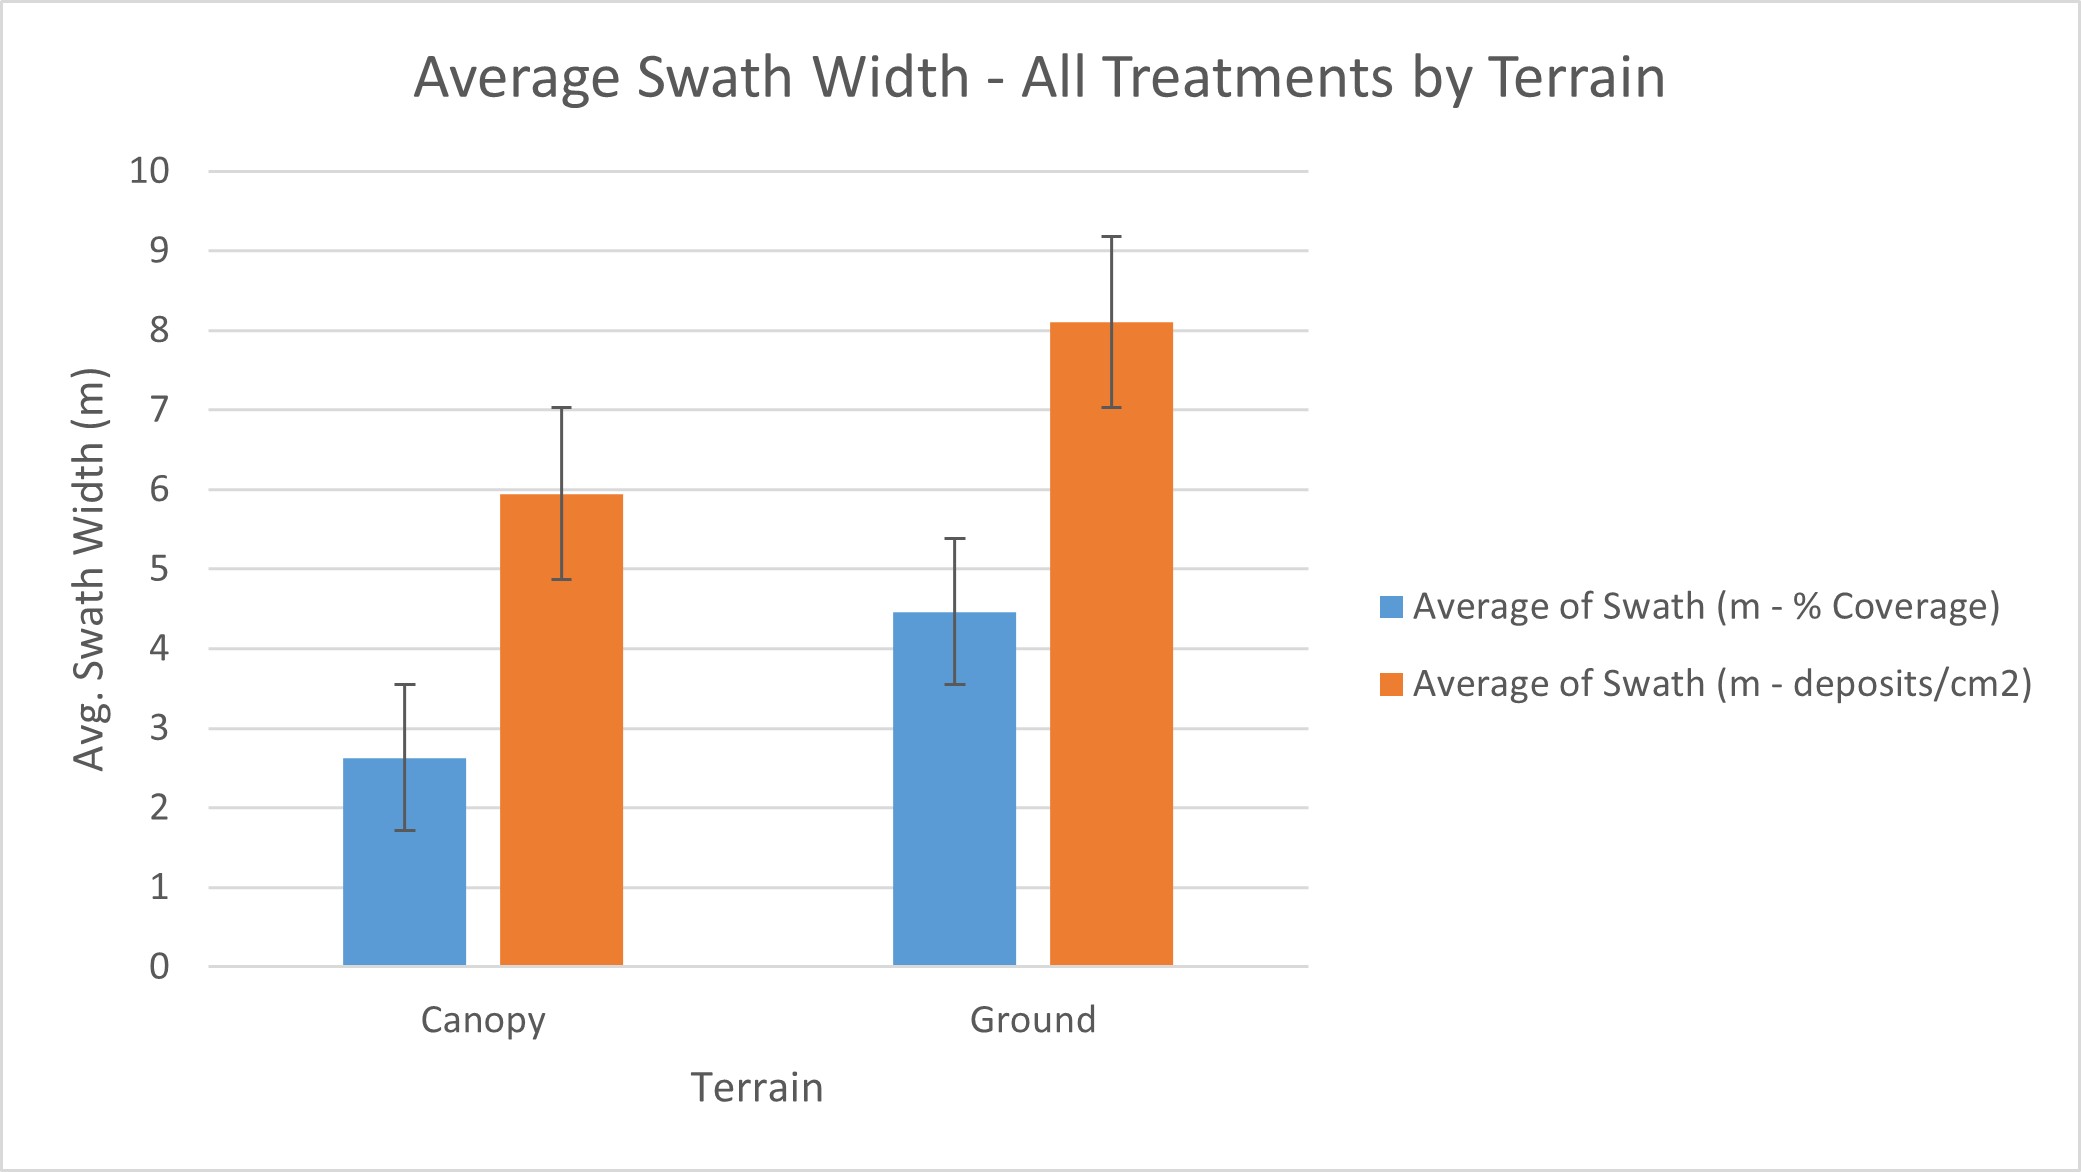
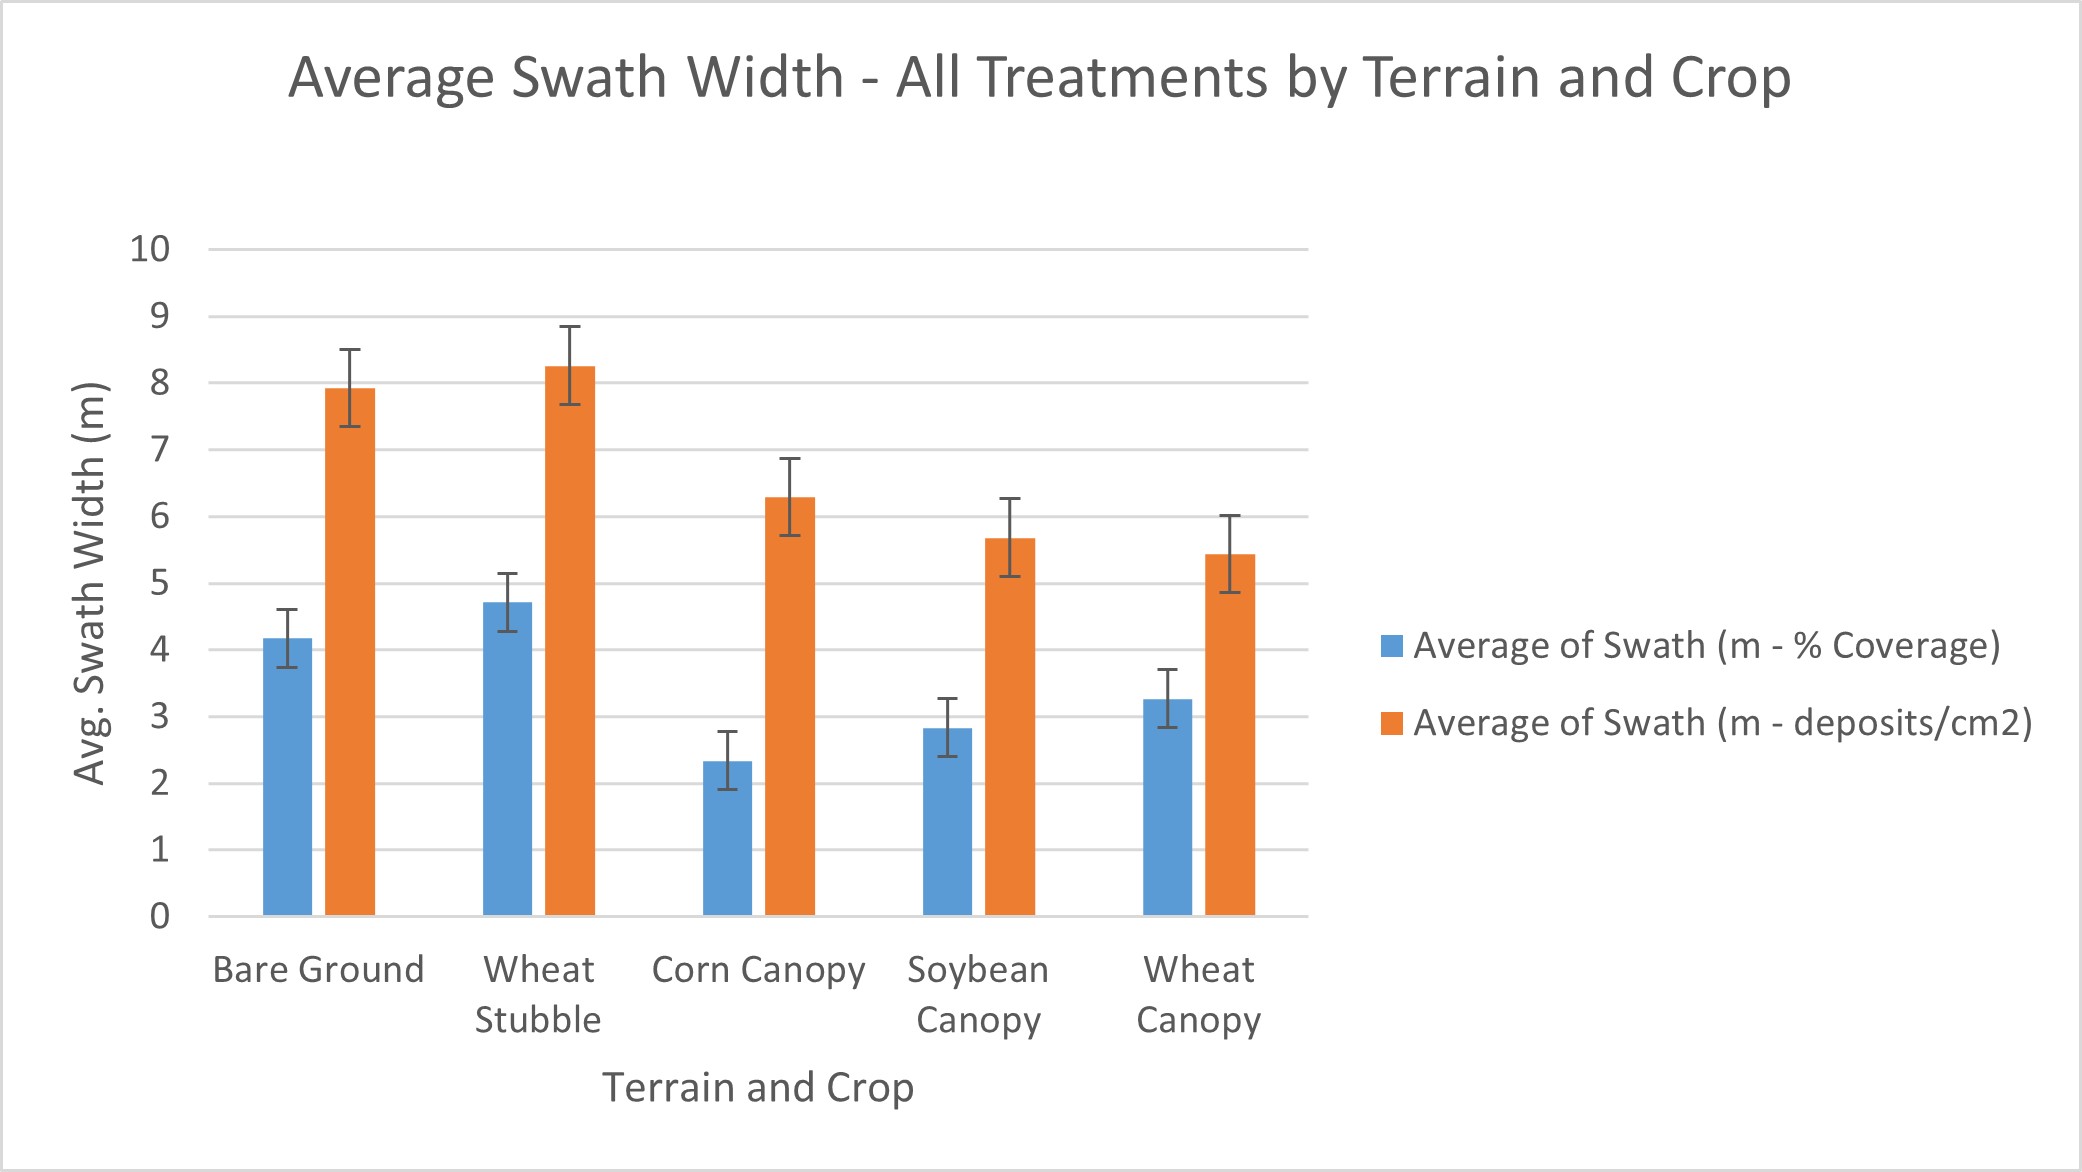
DJI states that the effective spray width depends on the “actual working scene [sic]”. Compared to the T50, the T100 atomizers are not directly below the rotor hubs, are angled slightly outward and are set further apart. This may explain claims of a larger swath width than the T50.
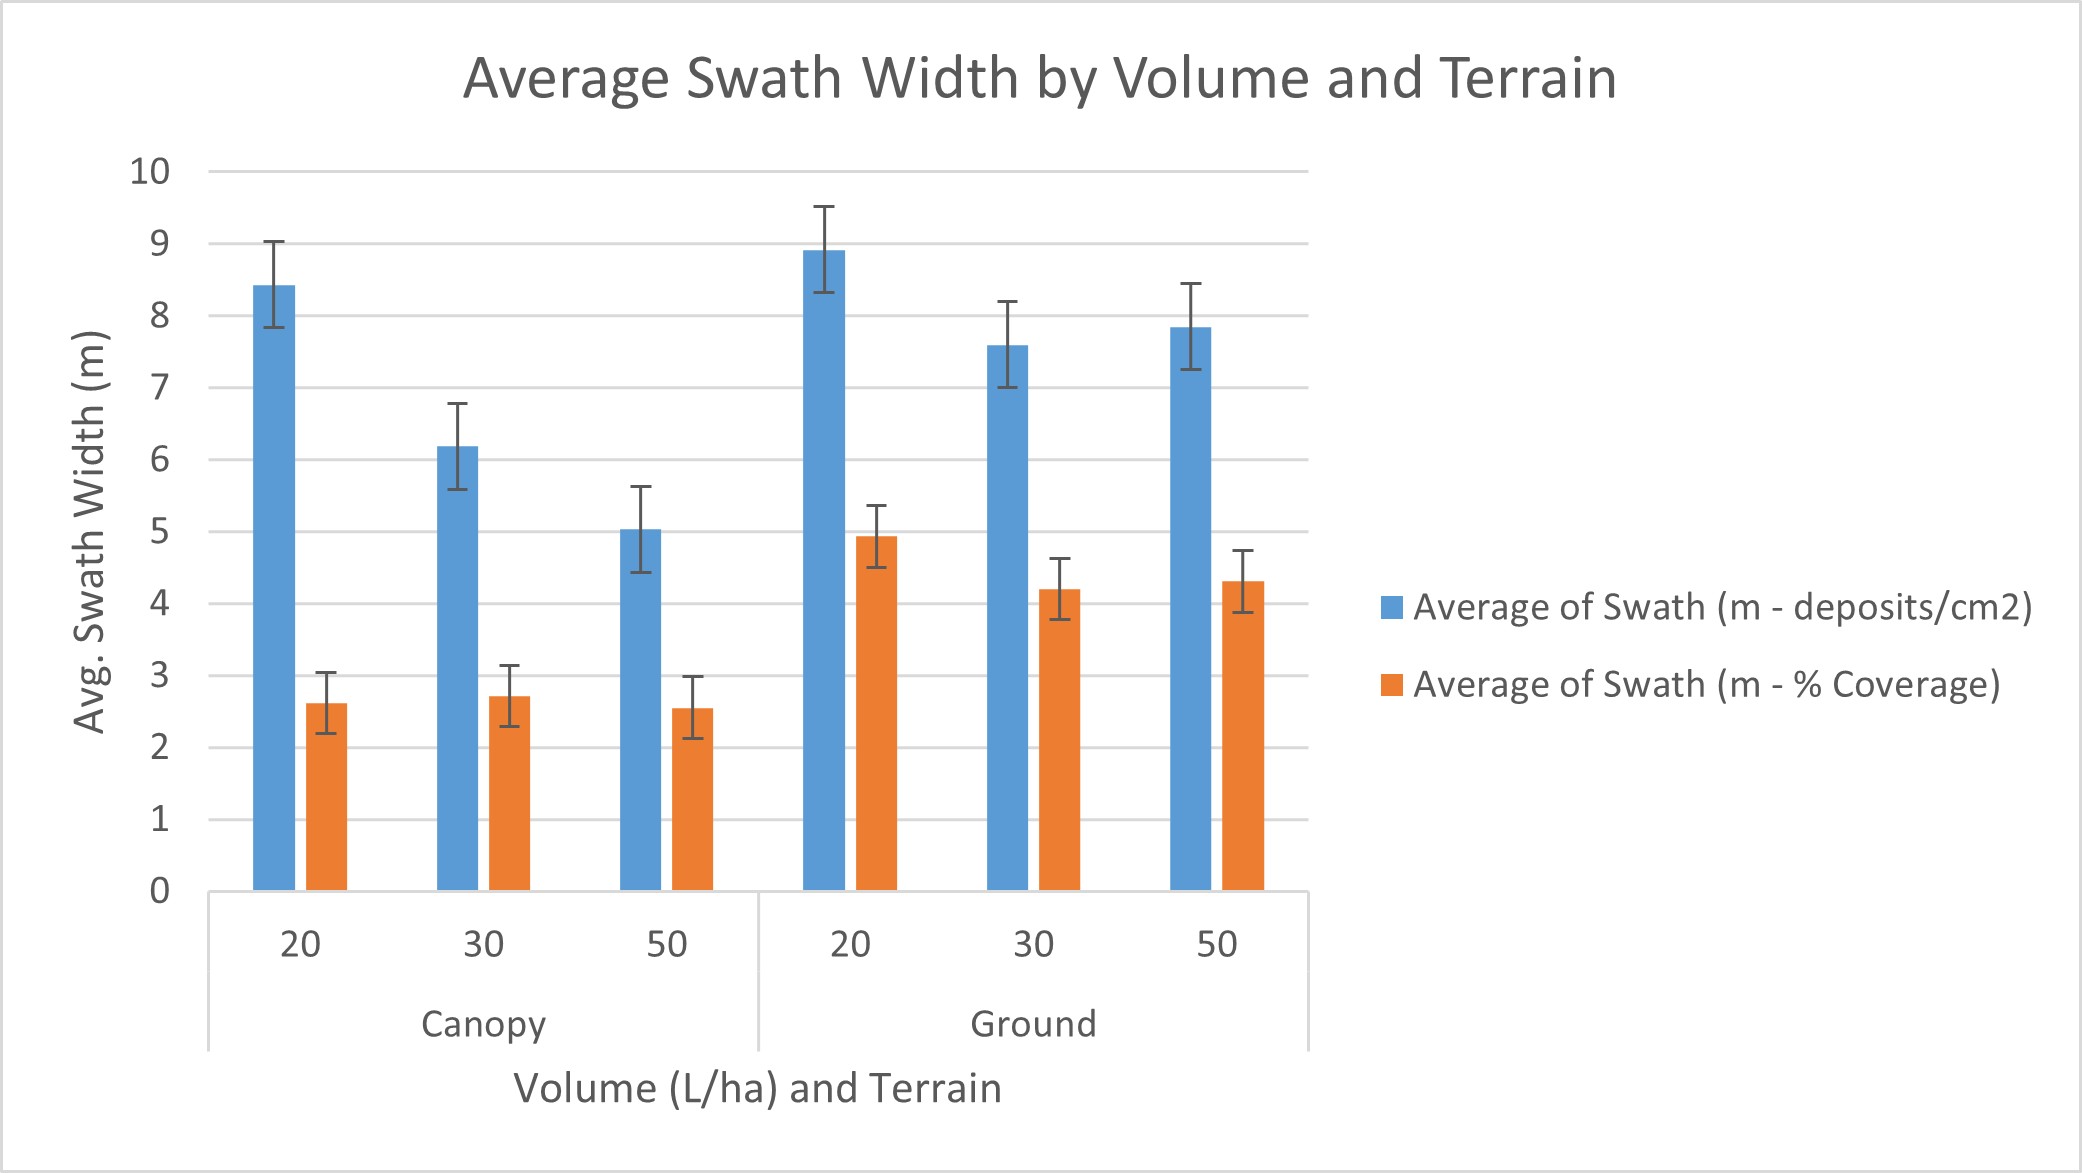
However, our studies with the T50 have determined that when flight settings are optimized for low drift and consistent coverage, the ESW for in-canopy fungicide application is no greater than 7 m. This is likely wider for herbicide applications in stubble or on bare ground, but the risk of downwind drift (i.e. not displacement) makes claims of 11 or 13 m for the T100 unlikely. Swathing runs were performed using the Speed Track and Swath Gobbler methods (results will be reported when the burndown study is analyzed).
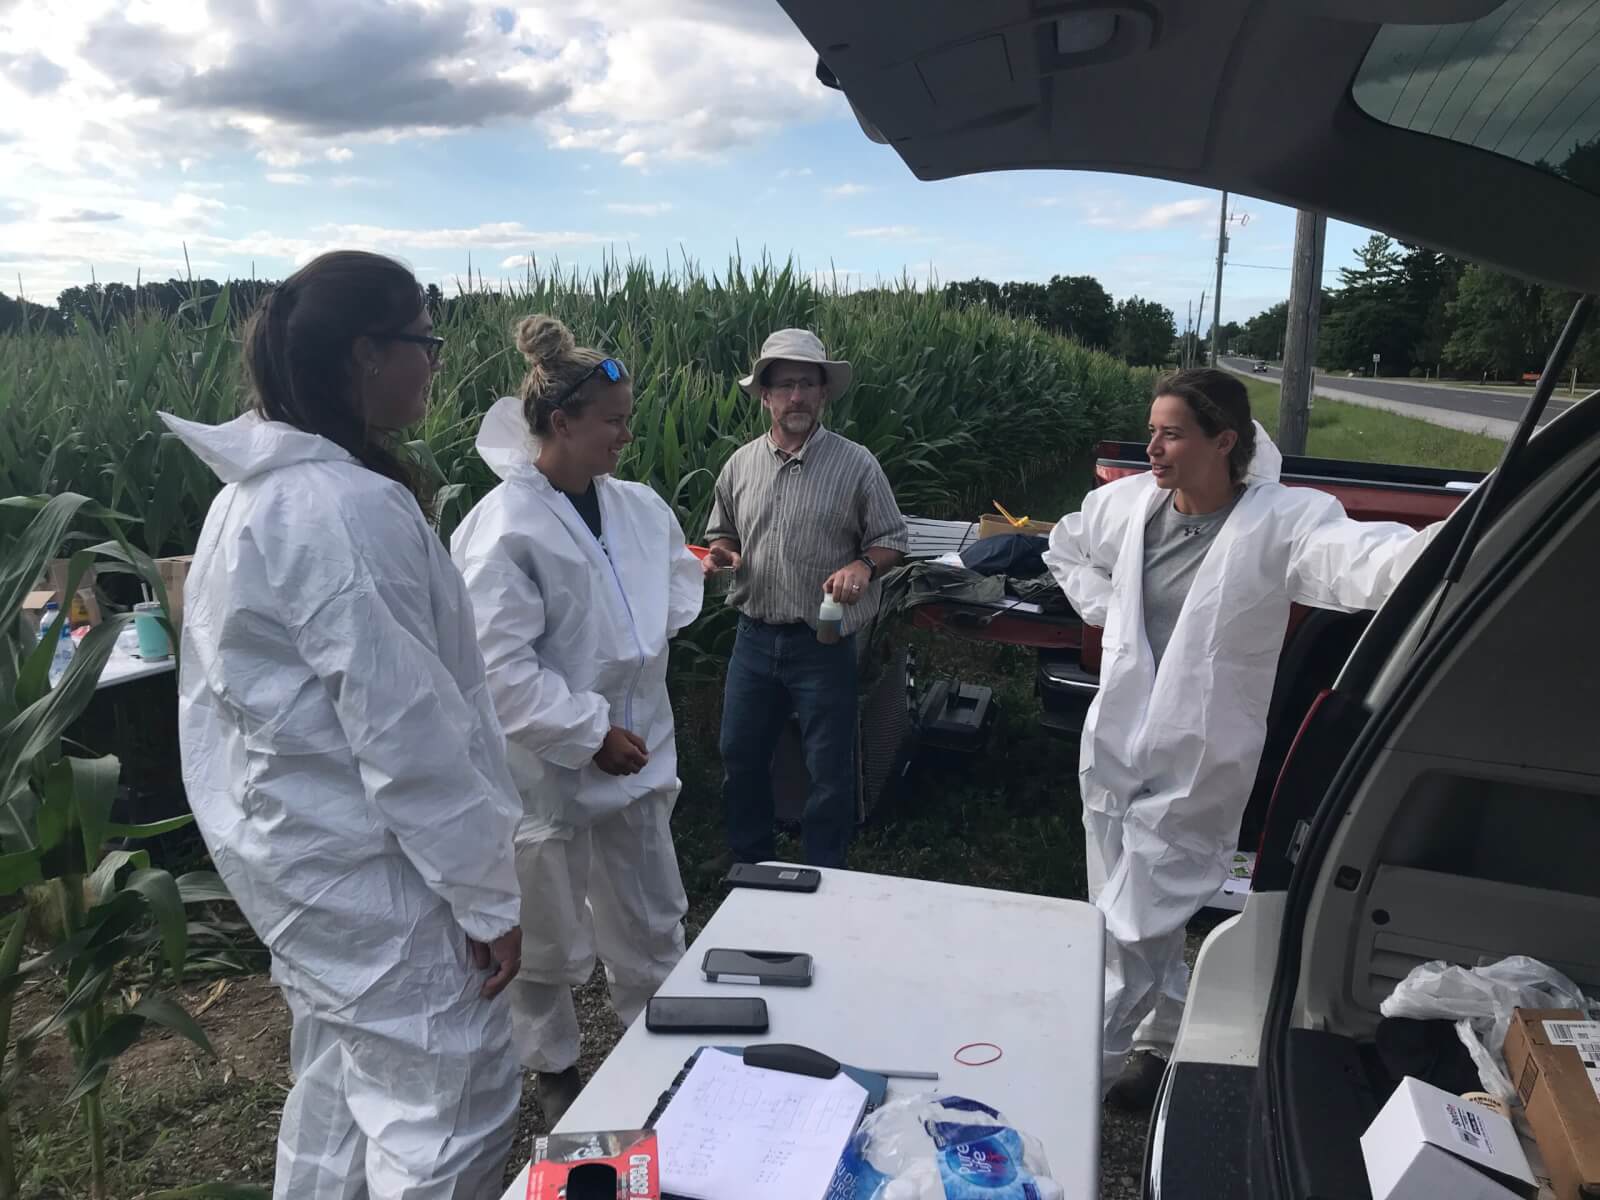
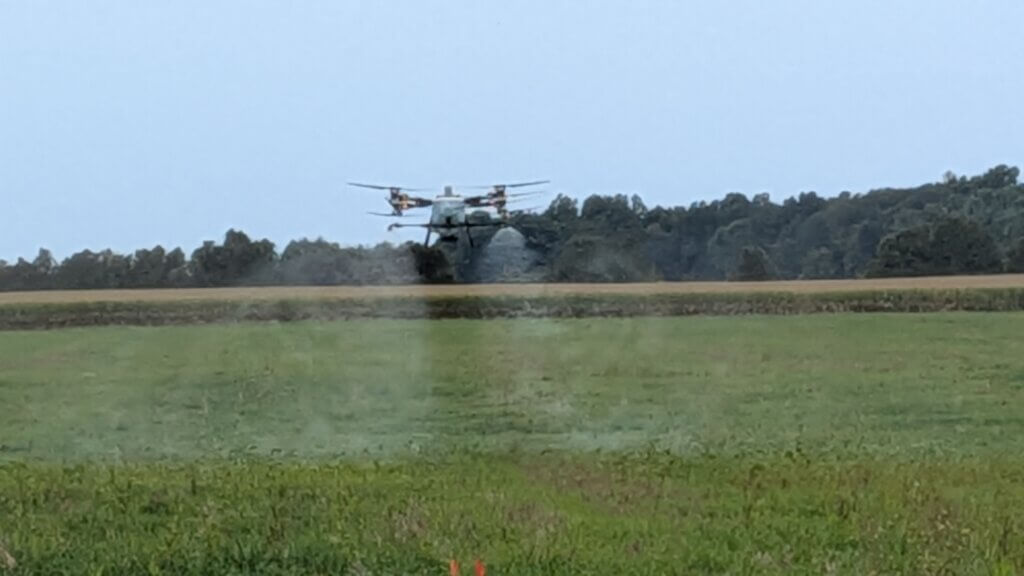
Observations during spray trial
According to DJI, both the T50 and the T100 can manage a maximum 30 L/ha (~3 gpa) at their respective maximum speeds. For the T50, this is 10 m/s (36 km/h) and for the T100 this is 20 m/s (62 km/h). This has obvious implications for greater efficiency, but we wondered what effect higher speeds might have on spray coverage and drift potential.
Succinctly, faster speeds leave droplets aloft for longer periods, subjecting them to wind, wake and vortices while reducing the influence of the downward-rearward downwash that might normally entrain and direct them to the ground. As a result, they tend to spread laterally in the direction of the prevailing wind. This is drift. To see if this was happening, our treatments included combinations of travel speed, altitude, programmed swath width and droplet size. Here’s what we saw.
Altitude
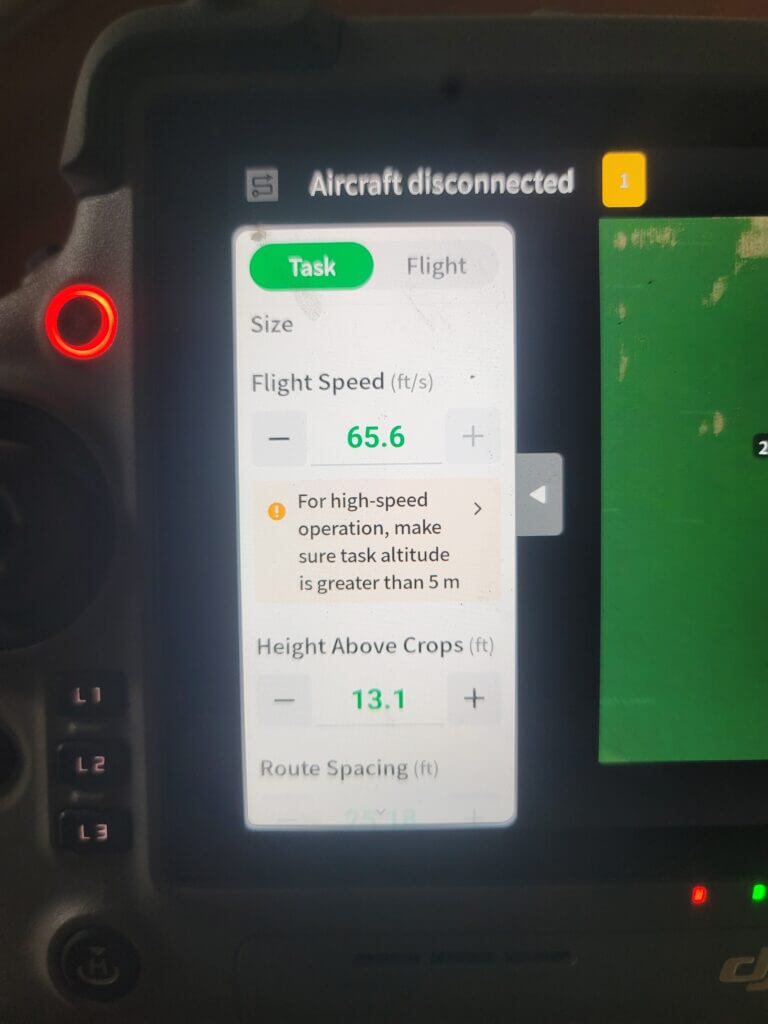
We generally fly the T50 between 3 and 3.5 m above the ground or crop canopy. Any higher creates unacceptable drift and any lower tends to leave a bimodal and inconsistent coverage pattern. However, the T100 controller advises an altitude of >5 m during “high speed operations”. Perhaps this relates to orchard operations, or it’s strictly a matter of safety for such a large drone operating at high speed. In any case, it seemed far too high for field applications.
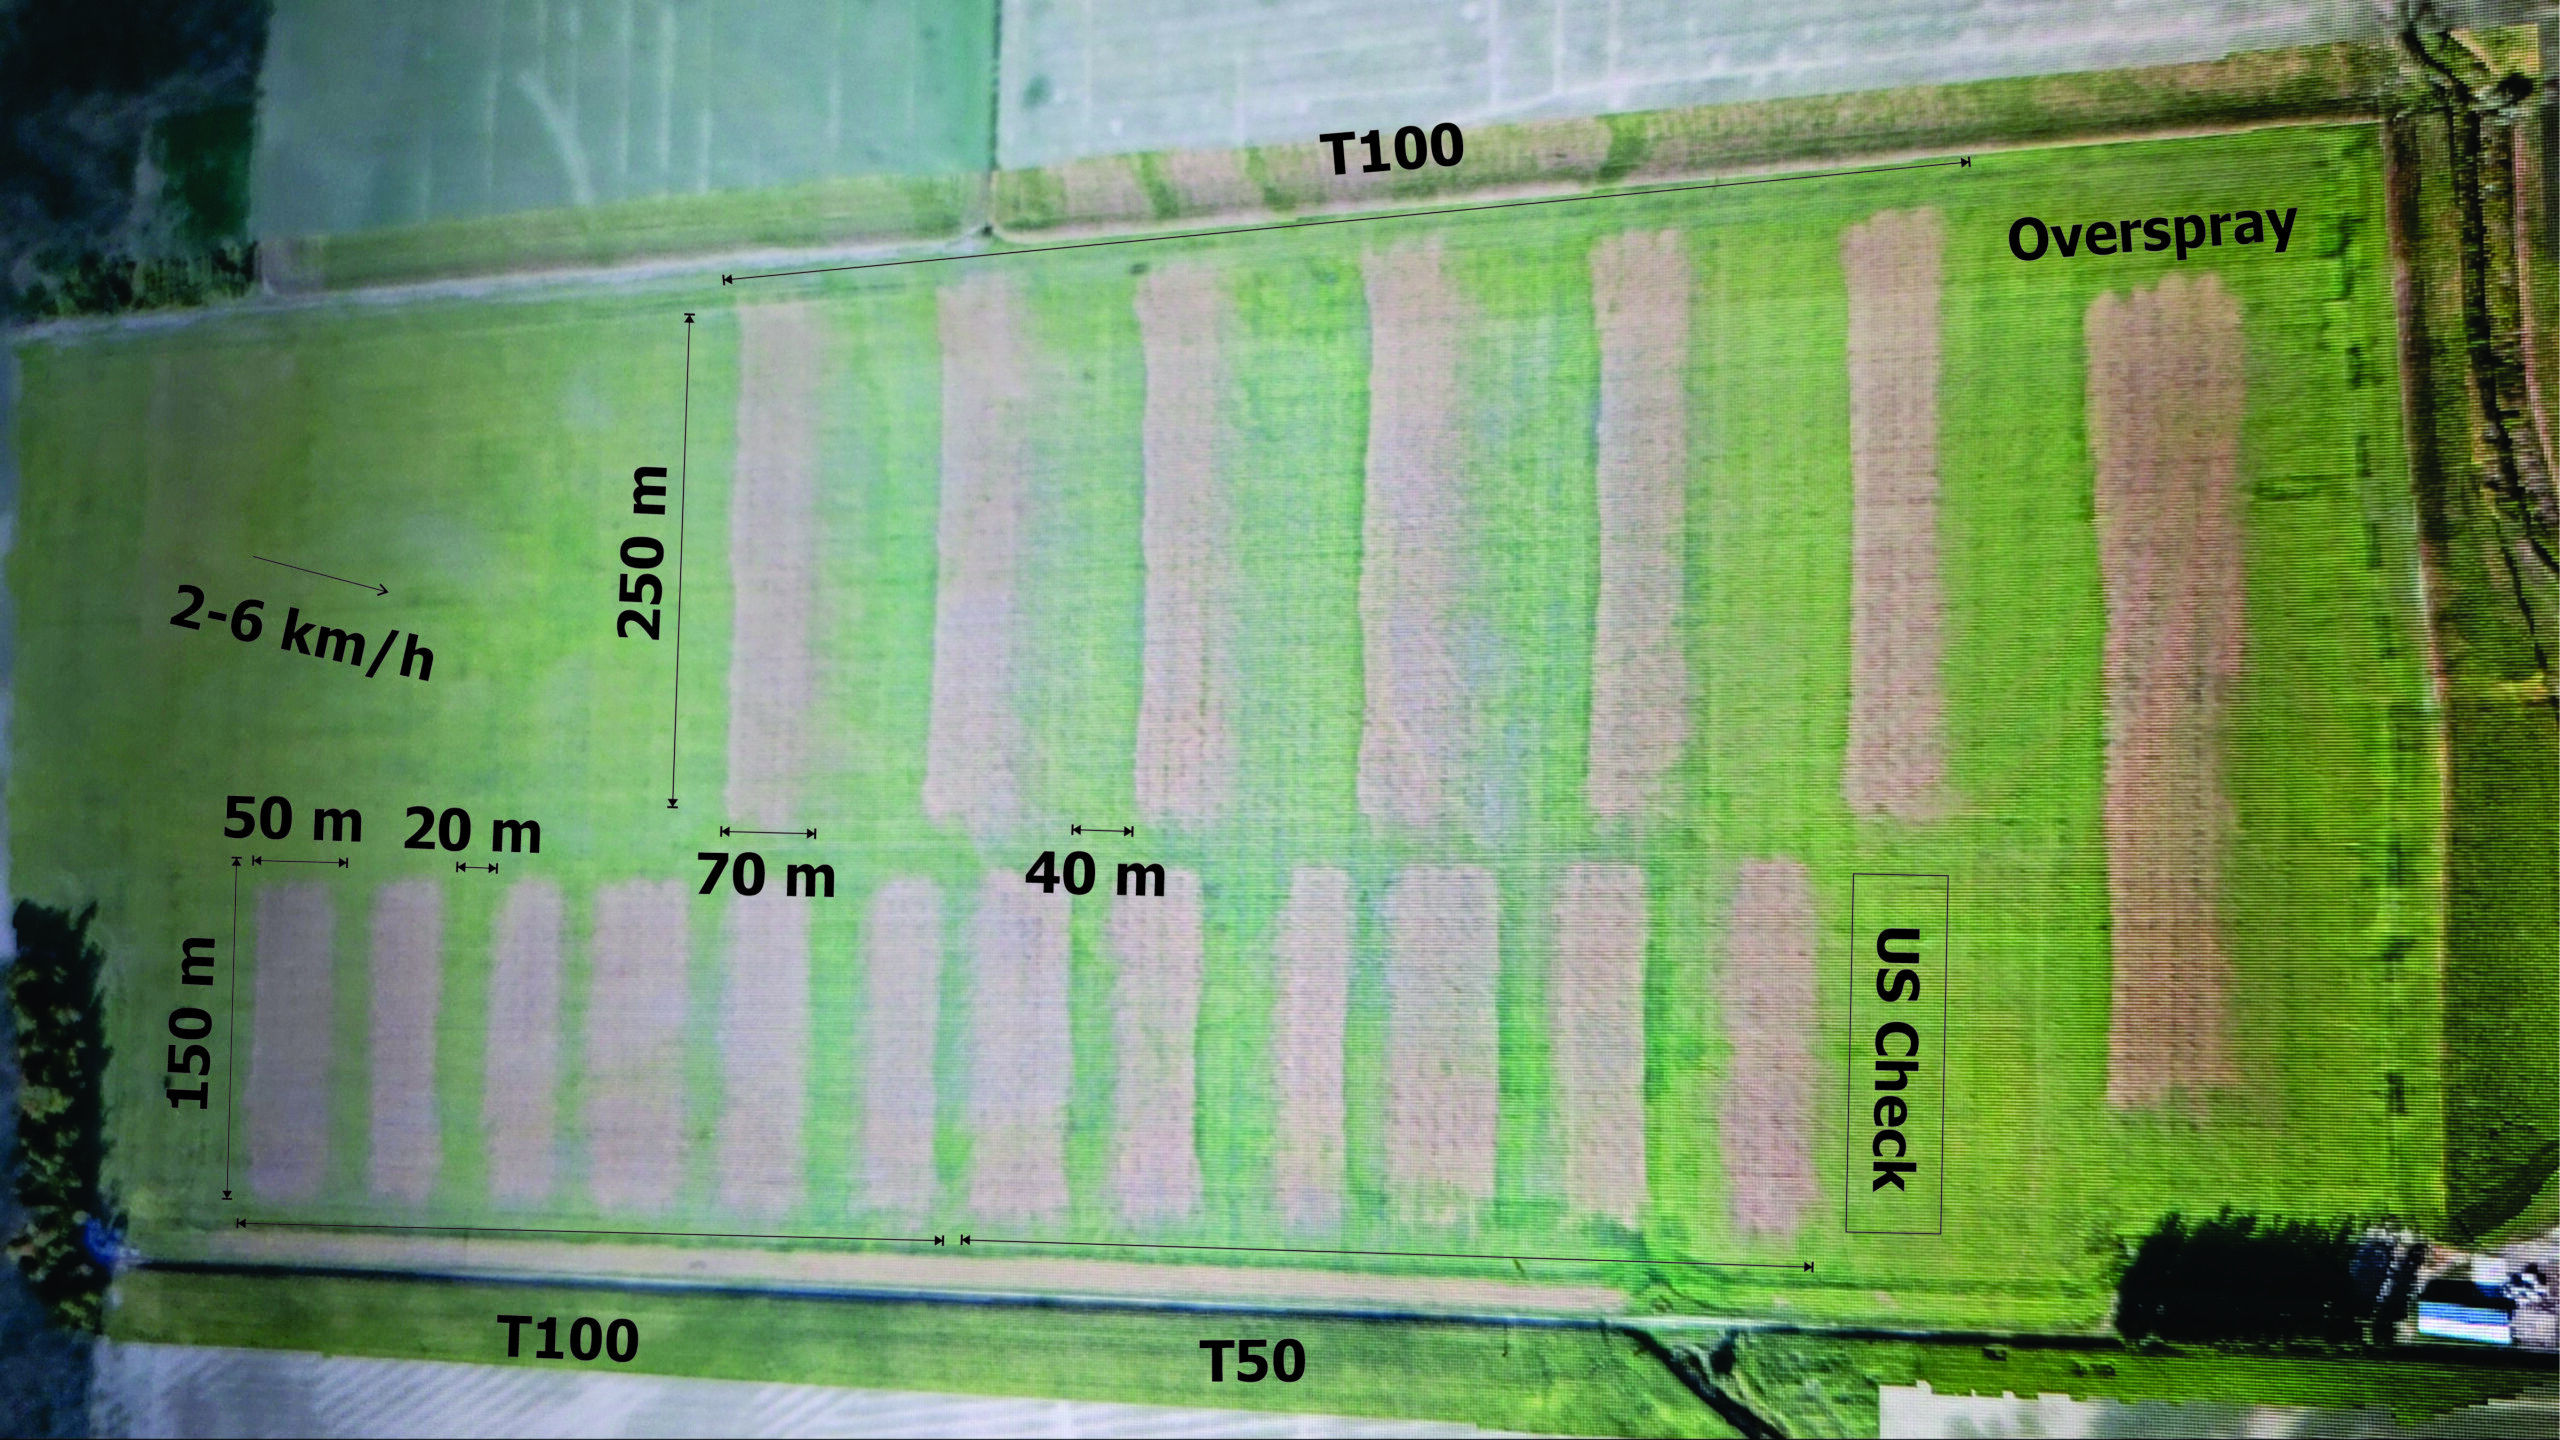
To compare the T50 directly to the T100, we chose to fly three treatments at 3 m altitude, 6 m/s and 50 L/ha (5 gpa). There appeared to be a gap in the T100 swath between the nozzles that might indicate bimodal (non uniform) deposition. This gap disappeared when we later flew at 4 m and increased the speed of the drone. Despite what we observed during the application, a preliminary inspection of the aerial images taken of the treatment plots hasn’t revealed any obvious gaps in the burndown. We hope to learn more when we have higher resolution images and when the swath gobbler data is analyzed.
Battery heat and endurance management
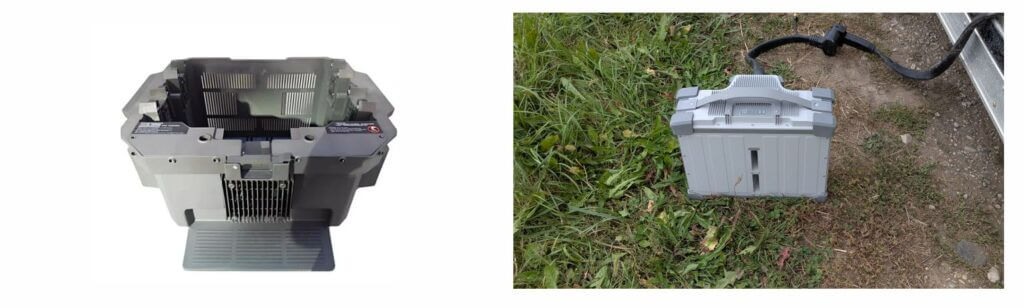
According to DJI, the T50’s DB1560 battery takes 9-12 minutes to fully charge and the T100’s DB2160 Intelligent Flight battery takes 8-9 to get to 95%. We did not have access to the recommended 3-phase generator and instead used an adaptor cable (pictured right in the following image) that allowed the use of a smaller generator at a cost of slower charging. We alternated between two batteries and did not use a battery cooling station (pictured left in the following image).
When spraying our 150 m long treatments, the drone flew four passes (two out-and-backs). During the 10 m/s, 50 L/ha (5 gpa) trials, the battery threw an “overheat” warning. We were only able to do a single out-and-back before replacing the overheated battery with a fresh one. The overheated battery was placed in an air-conditioned truck cab until it was cool enough to recharge.
This taught us that to manage battery heat, three batteries should be swapped, and the cooling station is likely not optional. Also, we gave further thought to the purpose of the water-cooled nozzles: We did not have an overheat issue during faster flights (15-18.5 m/s) and that may have been because the nozzle flow rate was considerably higher and kept the system cooler. In subsequent flights (and days), the drone sprayed at higher flight speeds and the overheat warning did not reappear. [Editor’s note] As of May, 2026, we have not encountered this overheat issue again.
Addendum
A few months after writing this article we were able to analyze the burndown data (here). There’s another possibility to explain the battery overheat phenomenon. Any operator can confirm that rotary drones expend a lot of power to remain in the air when they are full and when they are hovering. Flying at slow speed is a little more battery-efficient, but flying faster is better still. However, because rotary drones cannot achieve transitional lift, they are still not flying in a traditional sense. Rather, think of them as pushing hard off the ground, which is why they produce an extensive downwash. The faster they fly, the less the dwell time, which is the time the downwash is focused on one spot.
But this new generation of larger, faster rotary drones challenges those limitations. The T100 (and a few other brands such as the EAVision J150) are capable of far greater speeds than previous designs. There is a threshold (yet to be determined) where the drone surpasses translational lift and achieves proper flight. When that happens, the downwash is reduced or even eliminated, just as with a helicopter. This could explain why the overheat issue disappeared during faster flights. It might also explain why, beyond a certain speed, additional speed did not appear to affect swath width (see the burndown study).
This changes certain expectations about droplet movement beneath and behind the drone, as well as canopy penetration, drift potential and certainly, productivity. As drone design continues to evolve, the “rules” surrounding optimal operational settings must be reassessed. These observations are already changing research plans for 2026.
Flight speed and flow
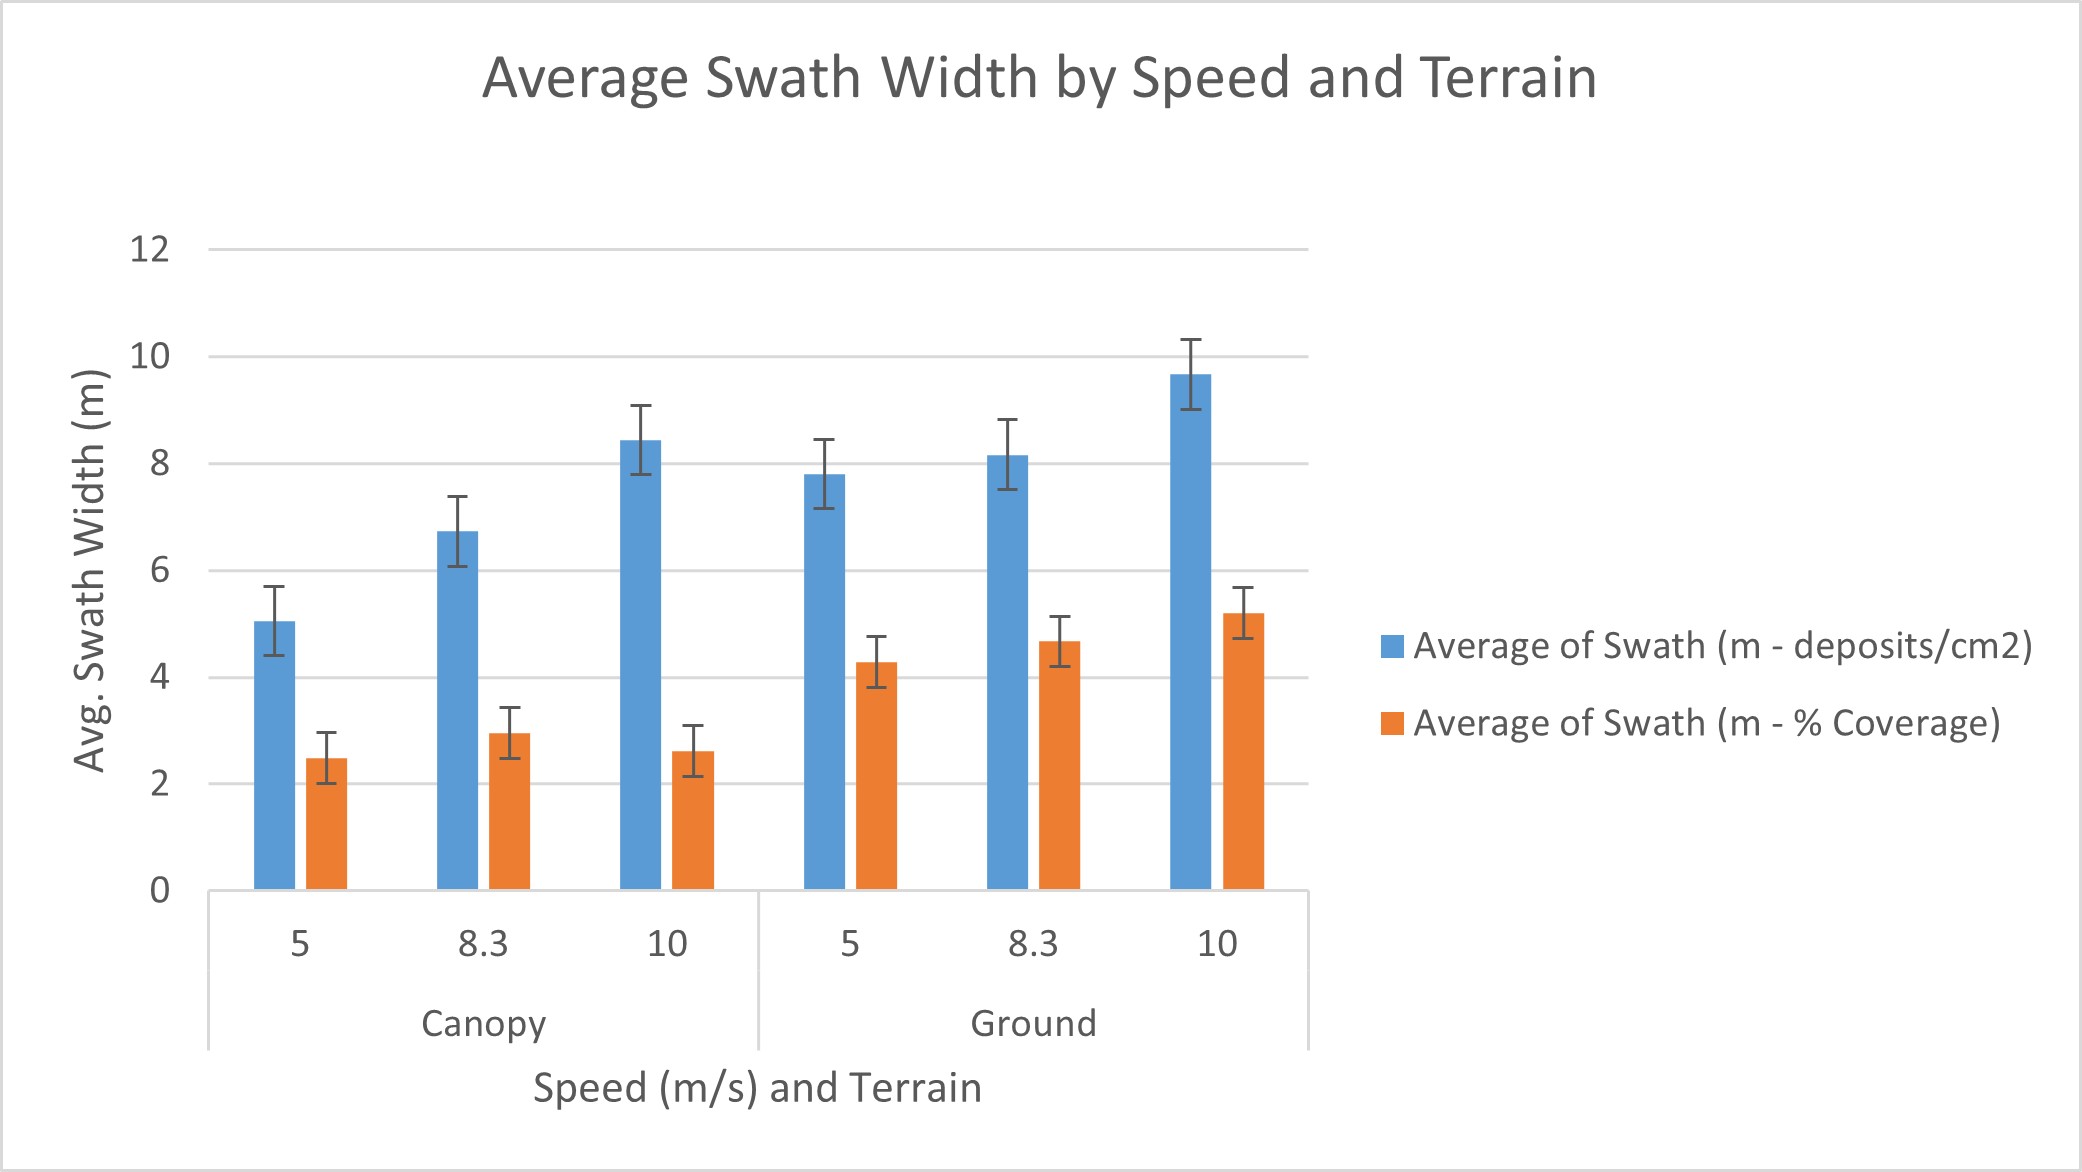
Two of our treatments explored the effect of flight speed on swathing. The first set of three treatments set the T100 at max speed (20 m/s) spraying 30 L/ha (3 gpa) at 4 m altitude on an 8 m swath using 50, 250 and 500 µm droplets. Then, the next set of three treatments held droplet size at 250 µm and the dependent variable became speed at 10, 15 or 20 m/s.
We found the controller set limits on certain combinations of settings. For example, at 20 m/s we could not select any lower than a 200 µm droplet. In fact, the lowest combination of settings was 80 µm and 12.5 m/s. We thought this might be a drift mitigating measure, but it’s more likely a pump or nozzle flow limitation. We also found that we were unable to exceed 16.7 m/s when applying 30 L/ha (3 gpa) using 250 um droplets on a 10 m swath.
Once we started flying the treatments, we found the drone was not able to exceed 18.3 m/s over the 250 m treatment distance. It took roughly 200 m to get up to 18.3 m/s before the drone began to slow in anticipation of the end of the treatment block. This is not to suggest the drone was under- or over-applying up to that point, because it’s assumed the flow rate compensated for a changing travel speed. It does reflect observations with other rotary RPAS that they take some time (and distance) to achieve a consistent spray state.
Conclusion
The T100 shows promise for spraying larger fields more efficiently. Early indications suggest a higher travel speed and altitude will be required for battery management and to maintain consistent coverage over potentially wider swaths. However, research is required to determine how this will affect the balance between coverage, drift and productivity. The results of the burndown study can be found here.
Acknowledgements
Adrian Rivard and Stuart Hunter (Drone Spray Canada), Adam Pfeffer (Bayer Canada) and Mike Cowbrough (Ontario Ministry of Agriculture, Food and Agribusiness) are gratefully acknowledged for their participation, and both in kind and financial support of this study.