This article has been modified with kind permission from an article on Retrofit Parts.
Liquid pressure in an agricultural sprayer must be controlled so as to apply the correct volume of spray per hectare.
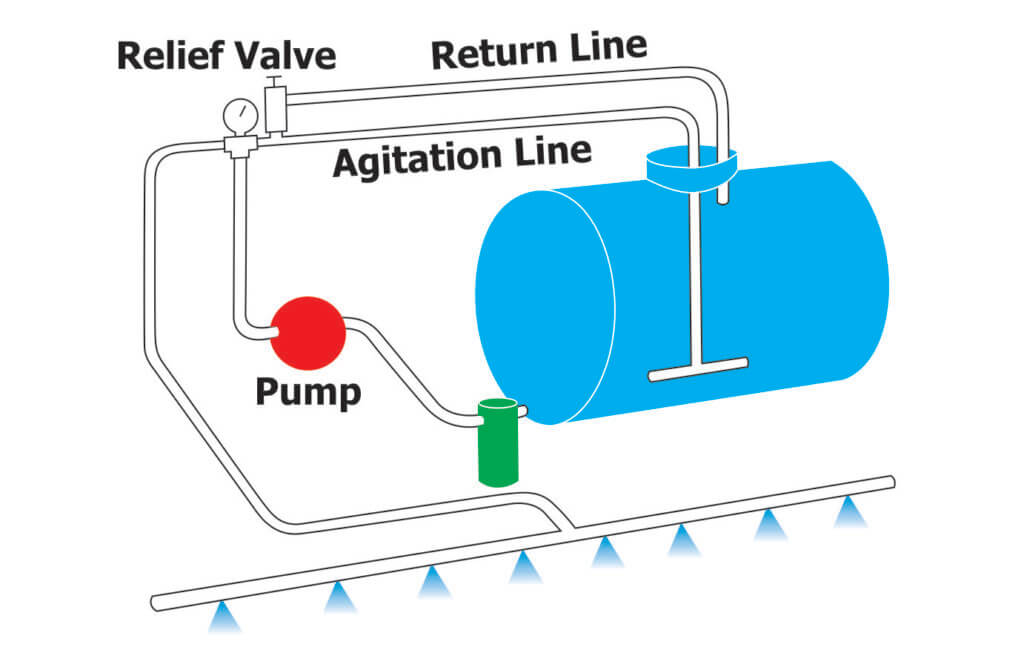
For sprayers that use positive-displacement pumps driven by the tractor’s power take-off, higher flow rates are produced than are actually required. Part of the pump’s output is therefore returned to the tank through a bypass line (aka return line), and spray pressure is controlled by a regulating or relief valve in this bypass line.
Ordinary regulators can maintain a constant pressure if the volume of liquid does not vary too much. But when it’s necessary to shut off part of the spray-boom in order to avoid double-spraying, (or in the case of an airblast sprayer, shut off one side), there is a large increase in the bypass flow and this causes the pressure to rise unless special compensating valves are fitted and correctly set.
Ramsay (or Ramsay Nocton) pressure-sets automatically maintain constant pressure over a far wider range of variation in flow-rate; for example the bypass flow through Retrofit’s model can increase from 1 to 100 L/min with an increase in pressure of only 0.2 bar (~3 psi). Lechler also offers 1 1/4″ and 2″ thread models called “AirPress” with different flow and pressure metrics. Each model allows the spray boom to be shut off with ordinary diaphragm check valves and also allows the operator to change gear (and so change the pump speed) without affecting the pressure.
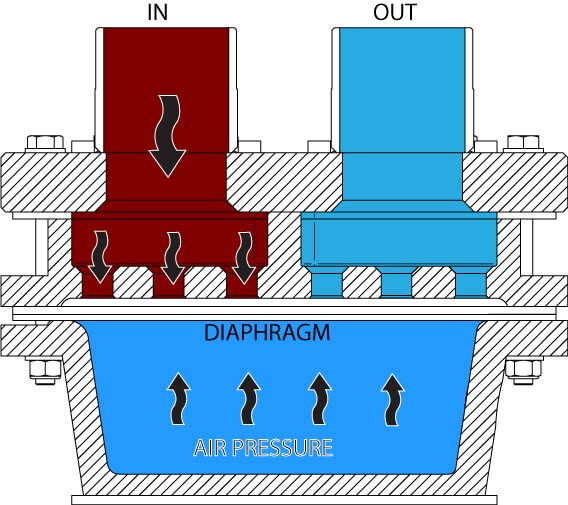
Ramsay pressure-sets are non-electric, and the only moving part is a flexible diaphragm. The working pressure is set by inflating the pressure-set with air.
It is often desirable to vary the pressure while spraying, either automatically or manually. This can be done by a small electric air compressor and two valves which respectively increase or reduce the air pressure behind the diaphragm. These valves may be actuated by an electronic ground-speed-related system, or controlled manually by the operator.
How it Works
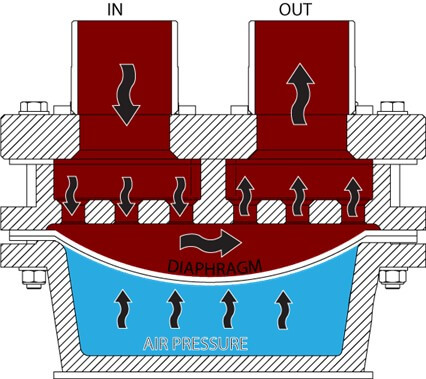
When the pressure in the IN chamber exceeds the air pressure it pushes the diaphragm away from the holes (as shown below) allowing some of the liquid to pass across to the OUT chamber, thus relieving the pressure (A backing plate, not shown in the diagram, prevents the diaphragm from being stretched too far).
A Ramsay valve with the diaphragm closed. Pressure in the IN chamber does not exceed the air pressure behind the diaphragm.
In practice, the diaphragm opens just as far as it needs to for the liquid pressure and the air pressure to come into equilibrium. When a boom is shut off and more flow needs to return to the tank, the diaphragm opens wider and remains in equilibrium in its new position.
A Ramsay valve with the diaphragm open. Pressure in the IN chamber exceeds the air pressure behind the diaphragm and can flow past to the OUT chamber.
Consequently, as long as there are no restrictions in the line back to the tank, the pressure remains constant even when there are large changes in pump speed or spray speed-boom demand. Pressure varies only slightly as the compression of the air in the air-reservoir varies with the movement of the diaphragm.
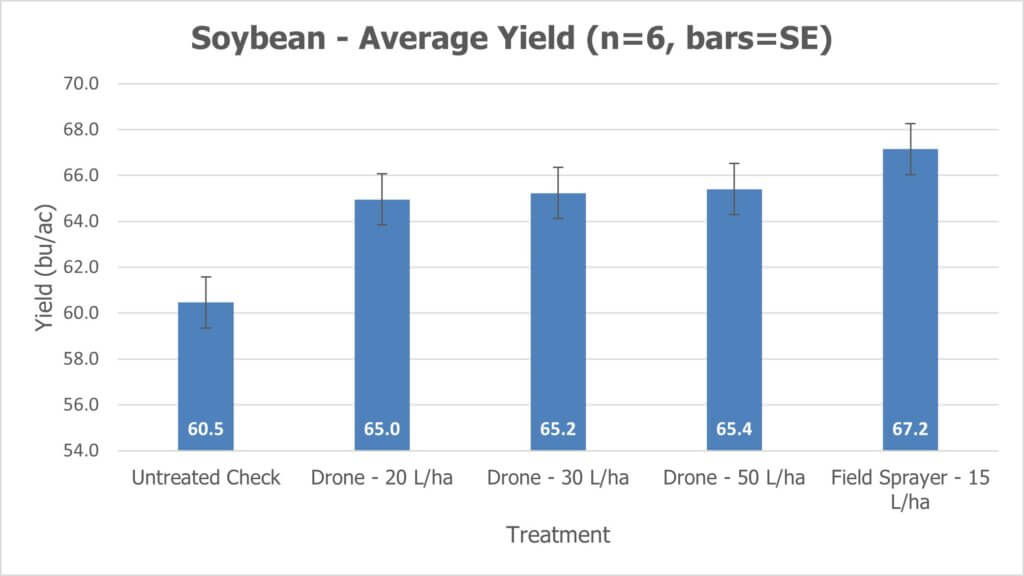
White mould is caused by the fungus Sclerotinia sclerotiorum and it’s an annual threat to soybean when cool, wet conditions correspond with flowering. Variety selection (e.g. high tolerance) and cultural control (e.g. crop rotation and wider row width) are important management tools, but ultimately the application of a crop protection product between R1 and R2 is required for high-risk fields. (Learn more here).
This article describes the results of an experiment exploring soybean canopy coverage and fungicide efficacy from a rotary spray drone. All work was performed under PMRA research authorization. There are currently no labels to apply crop protection products in Canada.
Experimental design
For the spray coverage trials, two locations were selected in southern Ontario (one south of Sparta and one west of Talbotville). This was a full field-scale trial with a single application made at R1.5 on July 18 (Sparta area) and July 22 (Talbotville area), 2023. There were two replications in each field and treatments were laid out parallel with the planting direction in a randomized design. Four other locations in Ontario and Quebec were also used in the larger efficacy/yield study. All locations had some level of white mould infection.
New Holland 345 – 150 L/ha (TeeJet XR11006 nozzles on 50 cm spacing) *Not included in spray coverage trial
We established an effective swath width of approximately 4 m (13.1 ft). The drone made three passes to cover the 12 m (40’)-wide treatment area, corresponding to the widths of the 9 m (30’) or 12 m (40’) headers later used to harvest in each field. Buffers were left on either side the treatment area. Fungicide was applied at label rate plus 0.125% Activate.
Target placement and retrieval
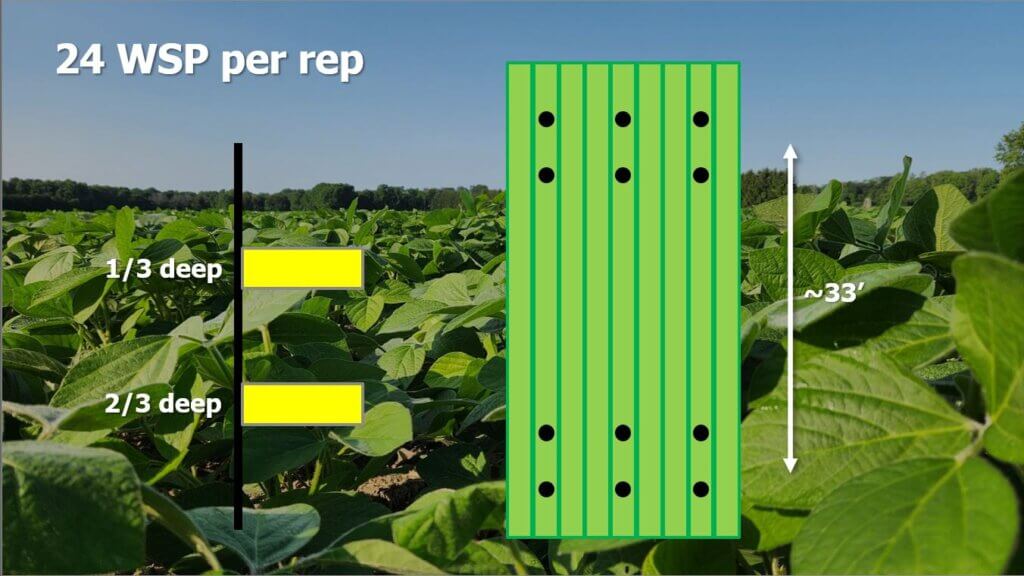
Soybeans were planted on 38 cm (15”) row spacing. The coverage sampling area was positioned in the middle of the treatment area. A length of rebar was positioned in-row and sheathed in PVC tubing. Two SpotOn brand water sensitive papers (WSP) from the same production run were secured face-up approximately 1/3 and 2/3 deep in the canopy. A block of six such samplers were positioned in a 3 x 2 grid (every third row and approximately 2 m apart in row). This block was then repeated 10 meters (33’) further into the block for a total 24 water sensitive papers per replicated treatment (see below).
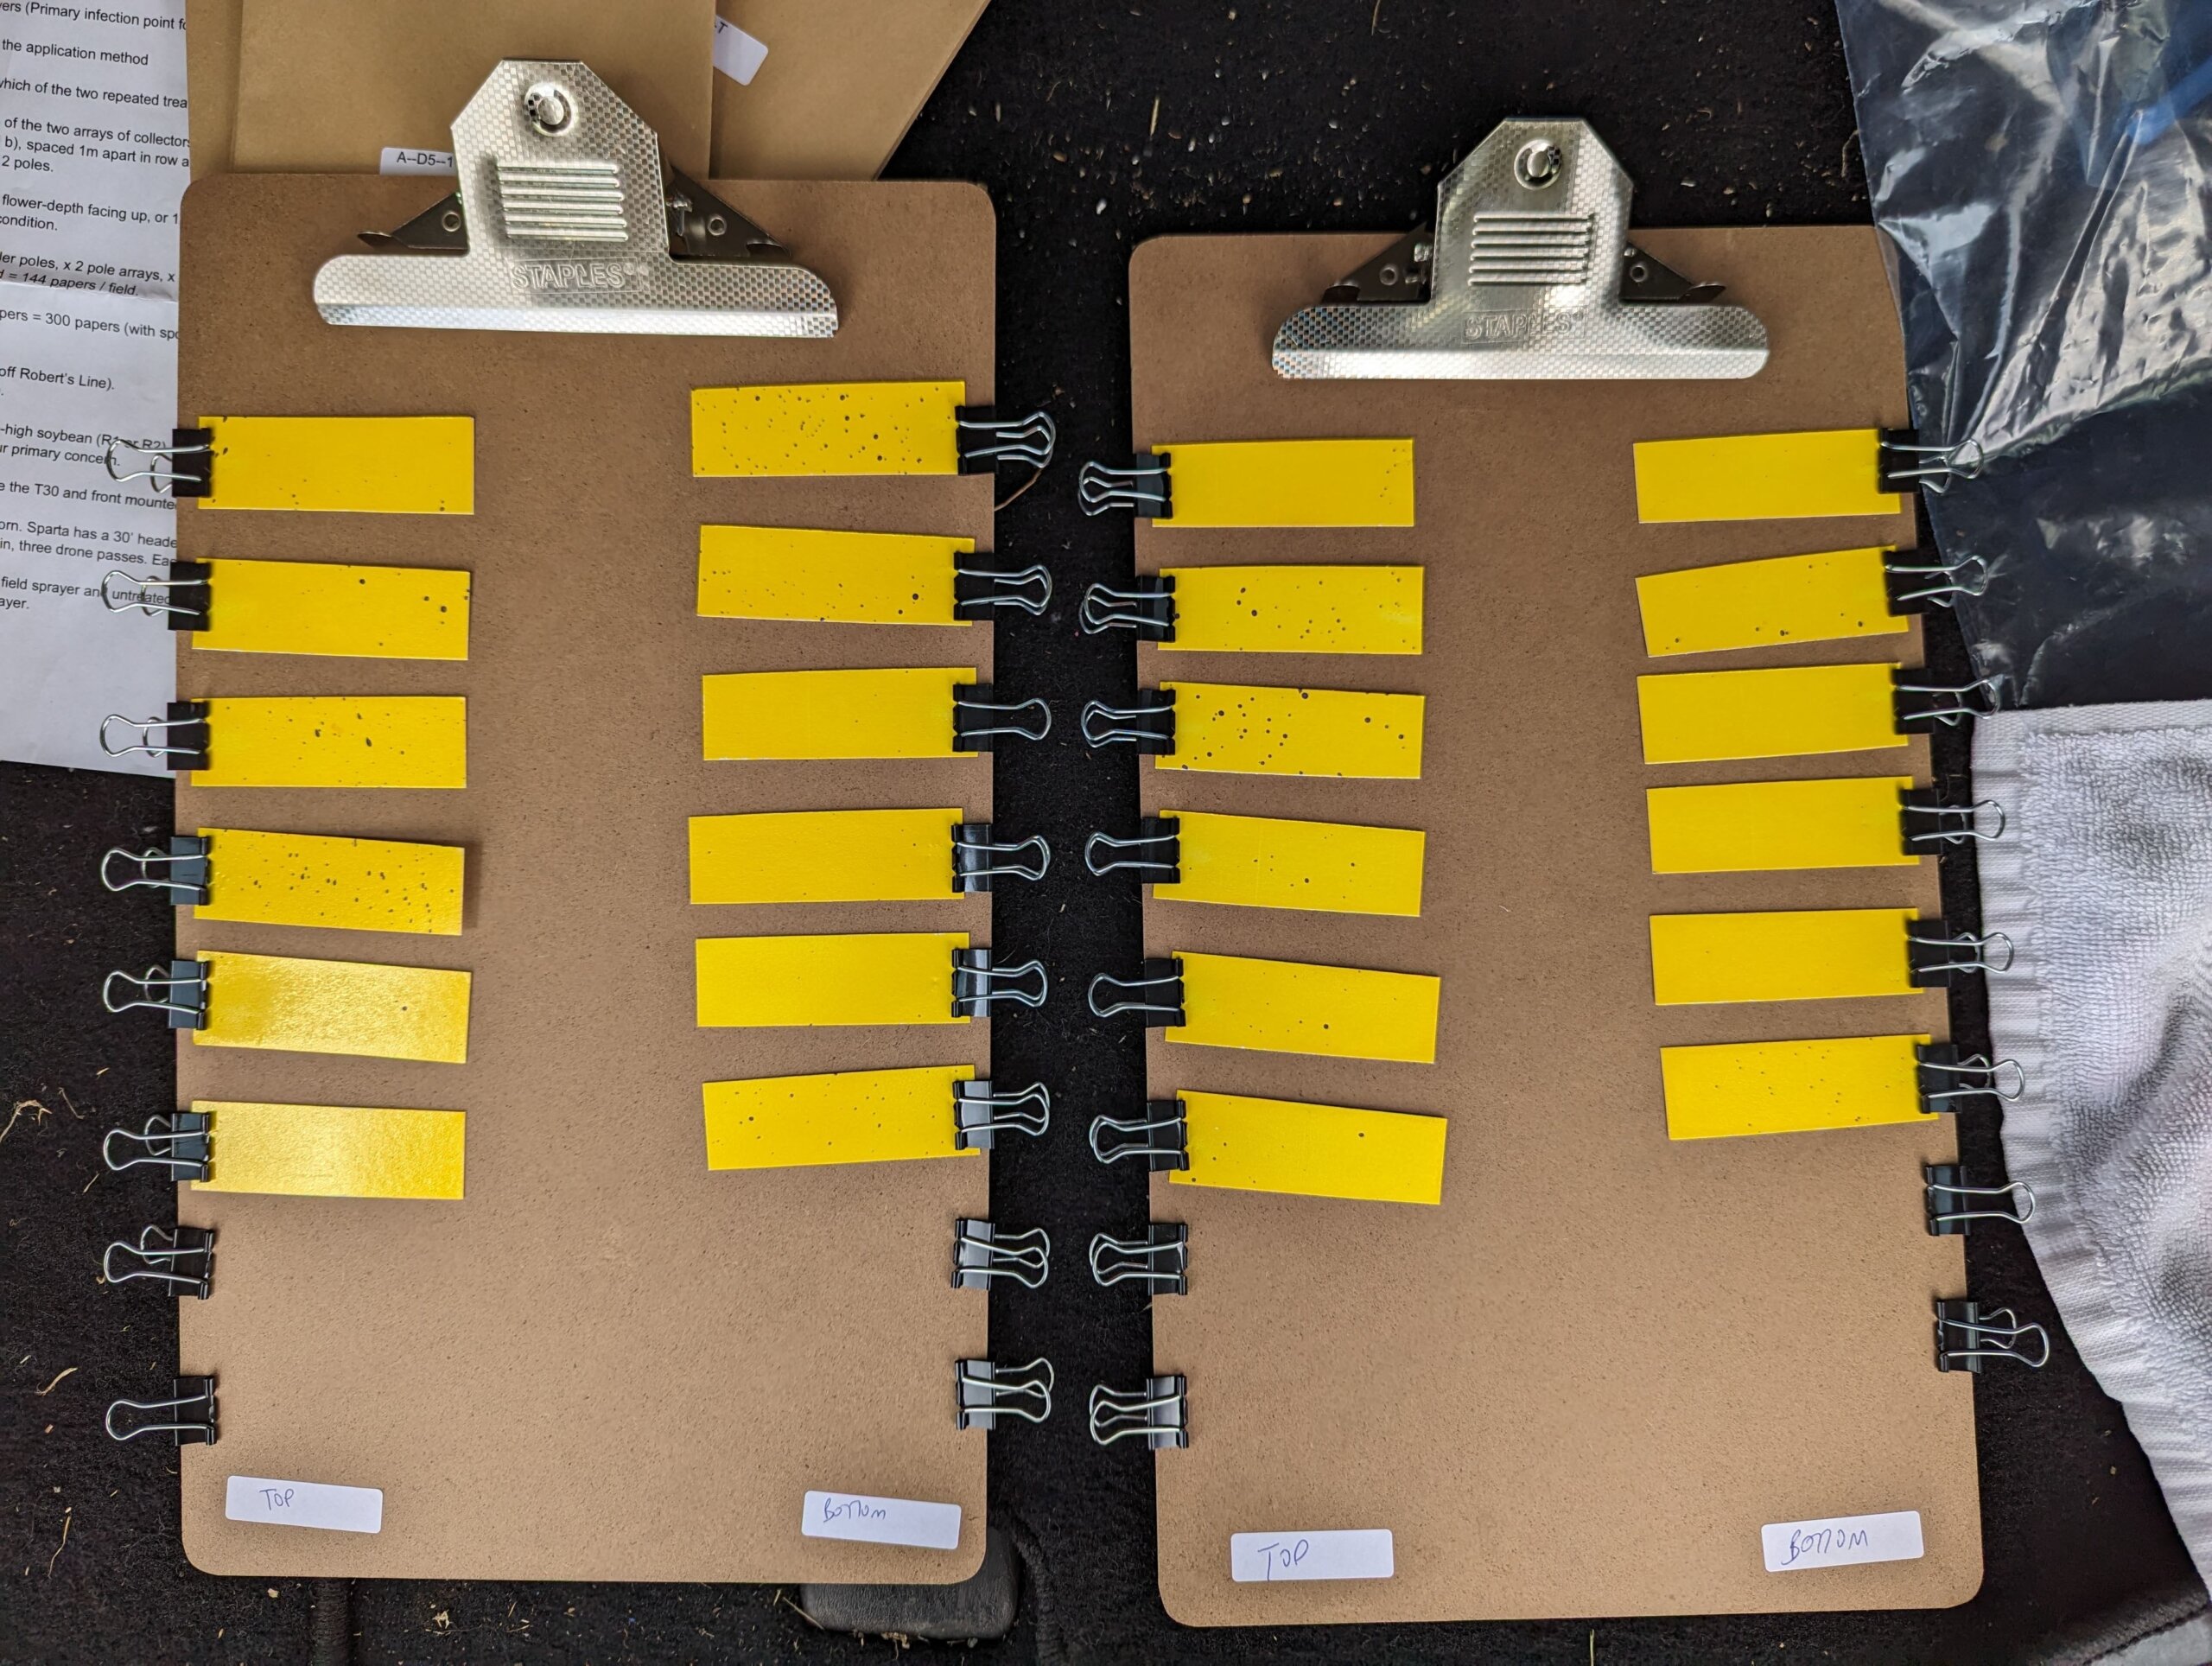
The papers were retrieved and temporarily placed on clipboards to dry before they were placed in paper bags for short term storage. They were digitized using a SprayX DropScope within 48 hours of retrieval on the “ground sprayer” setting, measured as percent surface covered (% area), and deposit density (# deposits/cm2).
Weather during coverage trials
Weather data was monitored using a Kestrel 3550AG weather meter (Kestrel Instruments) in a vane mount positioned 1.5 m (5 ft) above the ground. Wind speed fluctuated during the treatments, but wind direction remained relatively stable at 90 degrees to the flight path. The Sparta location averaged 6.4 km/h (4 mph) while the Talbotville location was considerably higher at 14.4 km/h (9 mph). Nevertheless, targets remained within the swath, despite any offset, as indicated by visual confirmation as well as the consistent coverage observed on the windward WSP compared to other, downwind samplers in each pass. Cloud cover was high at both locations.
Results
Coverage
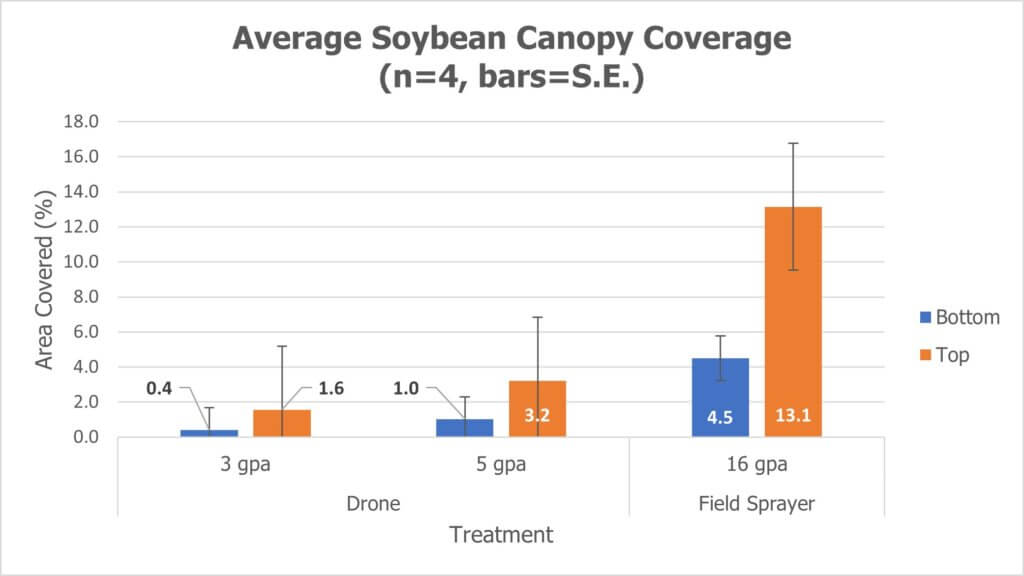
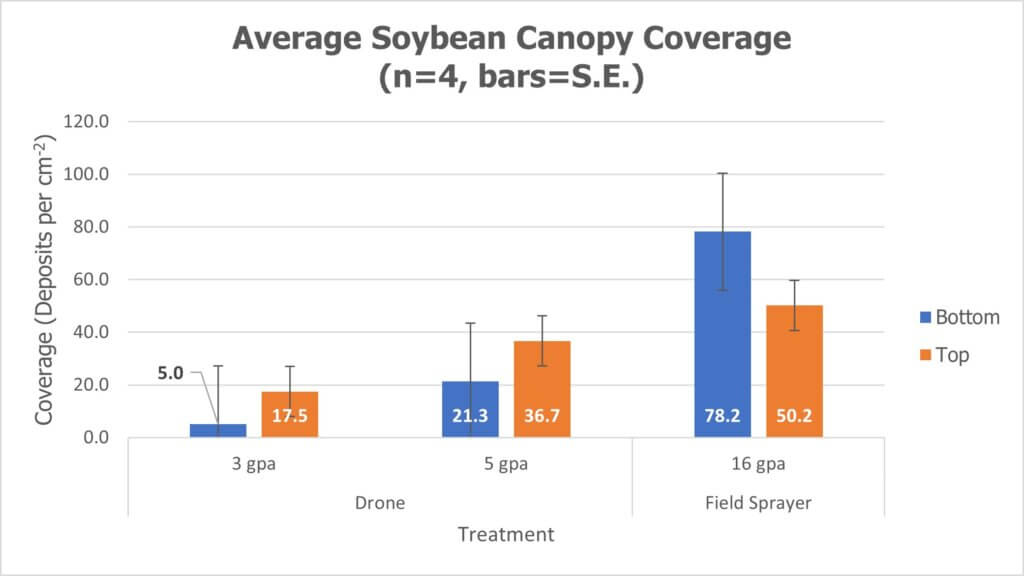
The coverage recorded from each WSP was averaged by canopy position (bottom 1/3 or top 1/3 of canopy) and presented in the following histograms with standard error. There were some spoiled collectors, primarily in the lowest canopy position, ruined by high humidity and physical contact with the plant. However, the lowest n for any treatment was 31 collectors and the highest was the full 48. Coverage is presented both as % area covered and as deposit density in counts per cm2.
Efficacy and yield
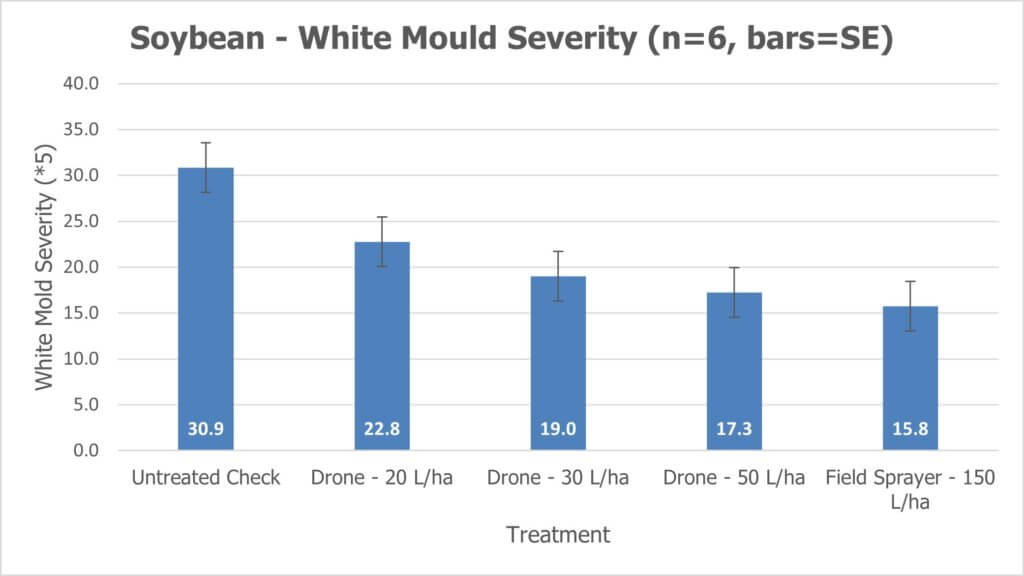
Three phytotoxicity ratings were performed 7, 14 and 21 days after treatment. White mould was rated at harvest and final crop yield reported in bu/ac.
Observations and Considerations
As expected, both water volume and canopy depth share direct relationships with percent-area covered (i.e. lower water and lower canopy depths mean lower coverage). Water volume also shares a direct relationship with deposit density for a given droplet size, but canopy depth is more complicated as smaller droplets tend to penetrate more deeply into canopies and low water volumes tend to produce smaller droplets. However, as a general observation, less water translates to less coverage no matter the metric for coverage, and this has been shown to reduce product efficacy.
How, then, can we reconcile the claims of efficacy from low-volume drone applications? It’s typical that the % area covered from a 50 L/ha drone application is ¼ or less than that of “conventional” field drop systems which in North America tend to employ 150-200 L/ha. In speaking with Mark Ledebuhr (Application Insight LLC) about how low volumes could possibly be efficacious, he explained that in sugarcane production in Guatemala, the condensing humidity is likely the reason why their 1 gallon/acre applications are working. The droplet survivability, and the re-hydration and secondary movement of the deposits were a good thing.
In the case of contact fungicides in North America, it may be humidity as well, but also the deposit density, combined with higher concentrations of active ingredient, that explain the similar efficacy and yields as seen here between the 50 L/ha (drone) treatment and the 150 L/ha (field sprayer) treatment. This would concentrate both the active ingredient (possibly increasing uptake rate, or residue persistence, depending on the product mode of action and the target’s physiology) as well as the adjuvant load (possibly improving sticking/spreading of deposits).
Another consideration surrounds how deposit spread is analyzed. Water sensitive paper underestimates the spreading effect that can occur on plant surfaces (especially where surfactants are used). This is why WSP tends to be used as a relative index, meaning that papers should only be compared to other papers. Perhaps deposits are spreading more on the plant surfaces in the low-volume drone application (again, given the higher concentration of formulated adjuvants) than the water sensitive paper is indicating, and that is improving efficacy.
This concept of how low-volume applications might affect coverage and subsequent efficacy, and the potentially positive impact of re-formulating products to include higher adjuvant loads, is well-described in this precis by Dr. Andrew Chapple and Malcolm Faers. Currently, accepting that the amount of control provided by the drone application falls short of that provided by a field sprayer, this study indicates that drones have the potential to produce acceptable results in fungicide applications if conditions are suitable, timing is optimal and water volumes are sufficiently high.
This study was a collaborative effort with Bayer Canada and Drone Spray Canada.
In 2016, Ontario berry growers were surveyed to determine the typical spray volume they used to apply unspecified crop protection products. For strawberry growers (day-neutral and June-bearing), the results spanned 50 to 1,000 L/ha (~5 gpa to ~100 gpa). In an earlier survey (2013), respondents specified 250 to 650 L/ha (~26.5 to 70 gpa) for fungicides, herbicides and insecticides. Miticide applications were as high as 750 L/ha (80 gpa).
This rather wide span of carrier volumes shouldn’t be surprising. No matter the horticultural cropping system, the choice of carrier volume reflects the operation’s unique pressures and priorities. These variables include, but aren’t limited to, operation size, spray equipment, crop varieties/staging, geography, and pest profiles. The ultimate goal is to achieve threshold coverage (i.e. efficacy) while maximizing productivity.
However, even the highest carrier volume reported did not reach the volumes required for those crop protection products intended to drench the soil. These products can span a range of 1,200 to 2,000 L/ha (~128 to 214 gpa). Experienced matted-row strawberry growers employ different methods to apply soil drenches, and we will discuss them later in the article. But first let’s address three common factors that must be considered:
Know the target
If (for example) the target is white grubs in the root zone, or phytopthora root rot, then the spray should be focused at the base of the plant in a banded application. Performing a broadcast application that covers the alleys as well as the plant rows may represent wasted spray. Knowing the target can help make the most efficient use of carrier.
Know the soil
Soil that is compressed or has high clay content won’t soak up water as quickly as drier, looser or sandier soil. If the beds are raised and resist absorption, much of the volume will run off into the alleys. This may not be desirable if the target is the raised bed itself. The following basic water movement principles come from the Manitoba Agriculture, Food and Rural Initiatives Soil Management Guide.
Water flows more quickly through large pores (sandy soils) than small pores (clay soils); water is held more tightly in small pores (clay soils) than in large pores (sandy soils).
Water moves from wet areas to dry areas (not necessarily by gravity) due to forces of adhesion and cohesion. This is called matric flow.
Water will not move from small soil pores to large soil pores unless conditions are saturated.
Know the weather forecast
Spraying on a hot, dry day means a higher rate of evaporation. As the carrier evaporates, the product will have less opportunity to infiltrate the soil. Conversely, applying product just before a heavy rain can result in a much diluted product being rinsed too deeply into the soil and beyond the target area.
Consider that one millimetre of rain on one hectare of land is 10,000 litres. That seems like a lot, but how deeply does it infiltrate into soil? One way to know is to use calculations based on soil porosity and bulk density. From these calculations it can be generalized that 25 mm of rain will infiltrate 45 mm into dry, sandy soil, but only 32 mm into dry clay soil. Remember, that 25 mm of rain represents 250,000 L/ha!
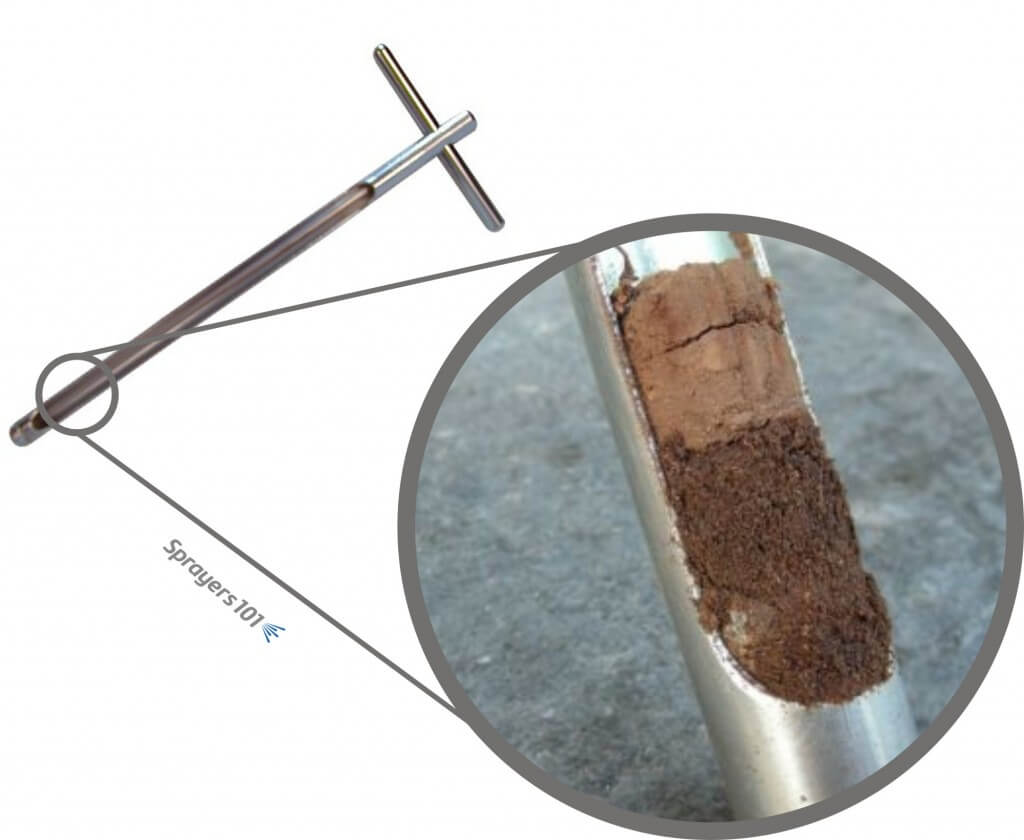
Perhaps the best way to know how far water will infiltrate the soil is to use a soil probe (aka soil sample tube). They can be purchased from local dealers for about $100.00 CAD, or they could be borrowed from whomever provides soil sampling services in the area. For the best results, perform this test in multiple locations in the field.
The soil probe. See how far water infiltrates soil by taking core samples.
So what methods do strawberry growers employ to apply a drench? Here are the top three:
1. Slow down
Some growers elect to use their existing sprayer setup, but they slow down to get more volume on per hectare. For example, if the grower normally applies 500 L/ha (53.4 gpa) driving at 5 km/h (3.1 mph) they would have to drive 1.25 km/h (0.78 mph) to achieve the 2,000 L/ha some labels require. If the sprayer tank held 1,500 litres (~400 US gallons) that would mean doing 0.75 hectares (1.9 acres) to a tank compared to the normal 3 hectares (7.5 acres). That would be four times as long, without considering the time for the extra refills.
Alternately, but related to slowing down, is double-pass spraying. In this case the tank is mixed at half-rate and the operator makes a pass through the field. Then, a second half-rate tank is applied immediately afterwards, ideally driving from the opposite direction. This effectively gives a full rate of product in a higher volume of water.
2. Re-nozzle
When slowing down is not enough (or not an option), some growers elect to re-nozzle. It may be tempting to increase the operating pressure to increase output on existing nozzles, but that makes finer droplets which tend to drift off target. The largest hollow-cone nozzles will only emit ~870 L/ha at 5.0 km/h (93 gpa at 3.1 mph) and that’s at 125 psi, which many trailed sprayers cannot manage. Further, many labels indicate a need for Coarse droplets in a drench, and hollow cones cannot produce such large droplets.
There are a limited number of flat fan nozzles that can achieve sufficiently high rates, and even then they must be used at slightly slower travel speeds. For example, the TeeJet AI11008 used at 70 psi will apply 145 gpa (~ 1,350 L/ha) with a Very Coarse spray quality at 4 mph (6.4 km/h). Driving slower can rise those volumes considerably. Alternately, streamer nozzles (e.g. TeeJet’s 5 or 7 hole StreamJets) require lower pressures (up to 60 psi) to emit as much as 2,310 L/ha at 5.0 km/h (247 gpa at 3.1 mph). The grower can maintain their travel speed, but will still have to refill more often.
3. “Wash In” the spray
Still another choice is to apply the product using the existing sprayer set-up, using a typical carrier volume, just prior to a rain event or sprinkler (not drip line) irrigation. For example, if the grower normally applies 500 L/ha (53.5 gpa), they would continue to do so. If the grower is relying on rain to wash the product in, it should be sufficient precipitation to move the product to the desired soil depth. Where sprinklers are an option, this can be controlled, and the depth of infiltration tested with a soil probe. Washing in the spray should take place as soon after application as possible to ensure the product is distributed evenly into the soil.
Thanks to Pam Fisher, former OMAFRA Berry Crop Specialist, and Anne Verhallen, former OMAFRA Soil Management Specialist, for their contributions to this article.
We’ve written extensively about angled flat fan nozzles and their ideal operating parameters (i.e. pressure, boom height, droplet size, volume and travel speed) for spraying wheat heads. Generally, coverage on the sprayer-approach side of a wheat head (aka the advance side) is easier to achieve because droplets from a conventional flat fan geometry tend to follow a downward-forward vector. Imagine dropping a ball from the window of a moving car. An outside observer would see it travelling forward as it fell.
The back of the wheat head (aka the retreat side) and the sides are harder to hit. When we introduce a rearward angle to coarser, fast-moving droplets, the high momentum and downward-rearward vector deposits spray on the retreat side of the wheat head after the sprayer passes over. Mythbusters produced a cool video segment that illustrates this concept by matching the rearward velocity of a soccer ball to the forward velocity of a truck; the ball falls straight down. Of course, in our case we want it to shoot backwards.
A great deal of independent research has determined that low booms coupled with dual fans that produce coarser spray and higher volumes will optimize coverage on any vertical target. Asymmetrical nozzles that have a more aggressive rearward angle perform better still. Of course both of these claims assume a “reasonable” wind speed, because the finer droplets in the spray experience a comparatively lower degree of inertia. Inertia is a property of matter that describes the resistance of an object to changes in its state of motion and it’s related to the object’s mass. What this means is that smaller droplets slow quickly, are easily deflected by wind, and tend to deposit on the windward side of the wheat head.
So, maybe you already knew all that. What’s new?
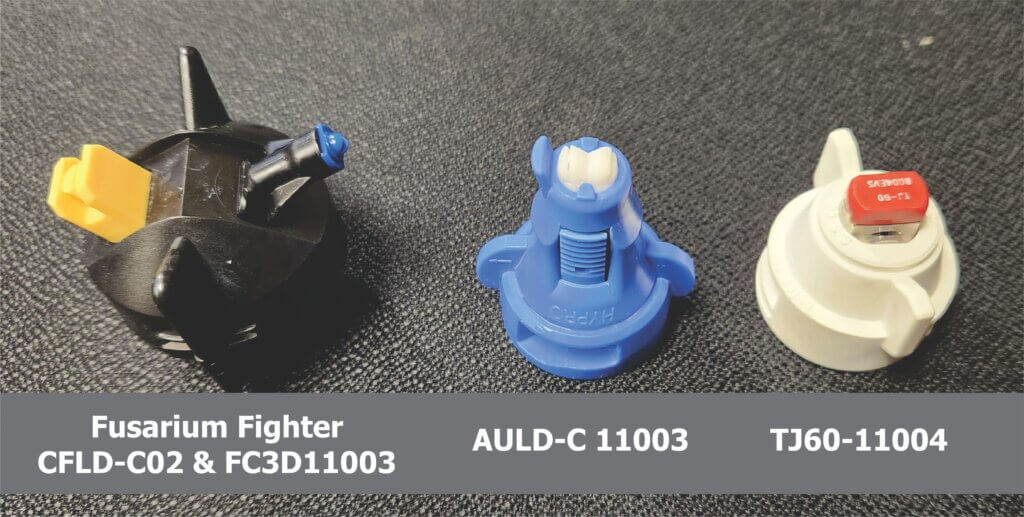
Two asymmetrical tips have been introduced in recent years and we wanted to characterize their coverage (Figure 1).
The first is the “Fusarium Fighter” which is a combo-tip developed by Nozzle Ninja in Stettler, Alberta. It combines Pentair Hypro’s FC-3D100 (a non-AI tip with a 2 star rating from LERAP and a 100° wide fan) with ASJ’s, Compact Fan Low-Drift Coarse with its 120° wide fan. The 3D already has a 55° angle from vertical and the twin cap brings that to a very steep 65°.
The second is Pentair Hypro’s Asymmetric Ultra Lo-Drift AI Ceramic. This is the same as the Lechler IDTA where the front angle is 120° wide, angled 30° forward from vertical and sprays 60% of the spray volume. The rear fan is 90° wide, angled 50° back and sprays the remaining 40%.
Finally, and only to illustrate how symmetrical fans and finer droplets are perhaps not ideal for reliable wheat head coverage, we ran TeeJet’s TwinJet Twin TJ60-110VS. This is two 110° flat fans and the angle between them is 60° (30° fore and 30° back from vertical).
Figure1. Evaluating coverage from three nozzles in winter wheat.
For each treatment, five nozzles were positioned mid-boom on a Deere 410R to minimize any turbulence from the sprayer wheels and chassis and to reduce the degree of yaw. Extensions were used on all tips to ensure the spray did not impact the boom itself. All other nozzles were turned off. Nozzle bodies were on 50 cm (20″) centres and positioned 50 cm (20″) above the average wheat head. Travel speeds were selected to achieve 187 L/ha (20 gpa) at a pressure ideal for the tip in question and this is recorded in Table 1. Contractors and other such custom applicators may find these speeds low and the volumes high, but in this study we chose to emulate usage in smaller operations. The effect of travel speed on coverage is debatable but likely quite minor. More can be found on the subject in this article.
Nozzle
Spray Quality
Speed
Pressure
AULD-C 11003
C
6.6km/h (4.1mph)
483kPa (70psi)
FF (CFLD-C02 & FC3D11003)
VC & M
8km/h (5mph)
207kPa (30psi)
TJ60-11004
F
8km/h (5mph)
207kPa (30psi)
Table 1. Operating parameters for three nozzles applying 187 L/ha (20 gpa) to wheat heads.
The weather was 25°C, 40% R.H. and there was a very light and consistent tail wind of 2-4 km/h (1.2-2.4 mph). These were ideal conditions because it was not hot or dry enough to evaporate finer spray appreciably, and not windy enough to deflect the spray.
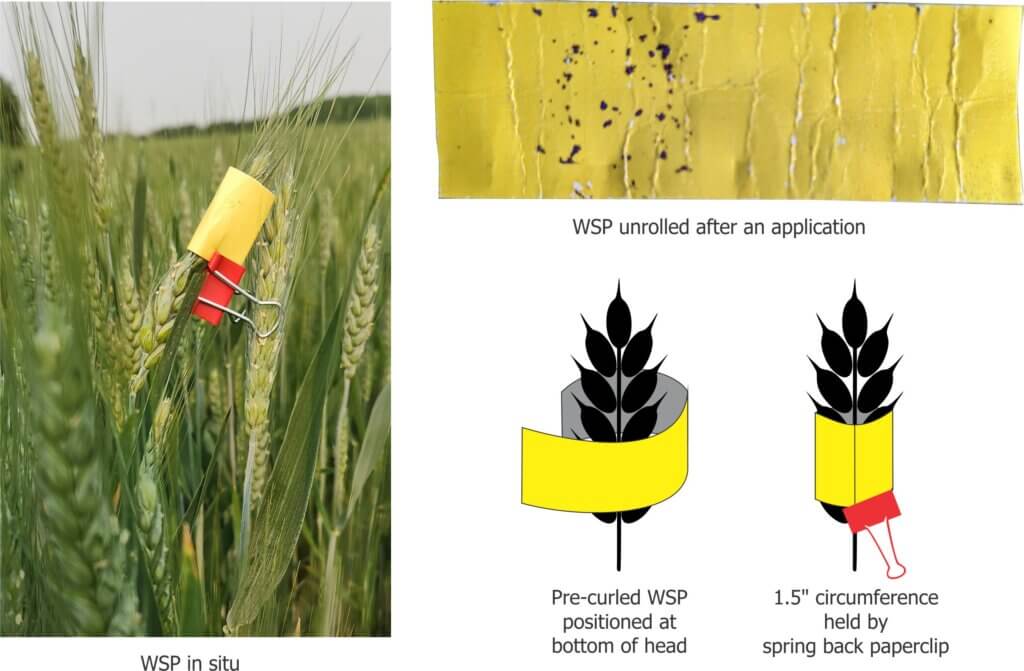
Water sensitive paper (Syngenta) was wrapped around the wheat head and held by a paper clip (see Figure 2). This gave a panoramic representation of coverage. Two more were mounted nearby on a length of rebar at wheat head-height; One faced the sprayer advance and one faced the retreat. Three such sets were positioned inline, spaced about 1 m apart and centered on the swath produced by the five nozzles. This was repeated 2x for each nozzle. Papers were retrieved, digitized and analyzed per the method described in this article.
Figure 2. WSP wrapped around a wheat head.
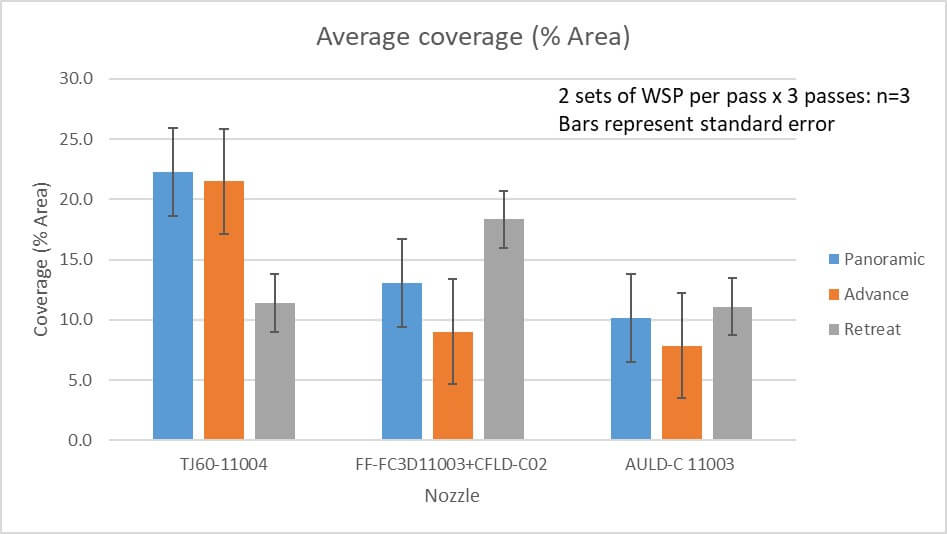
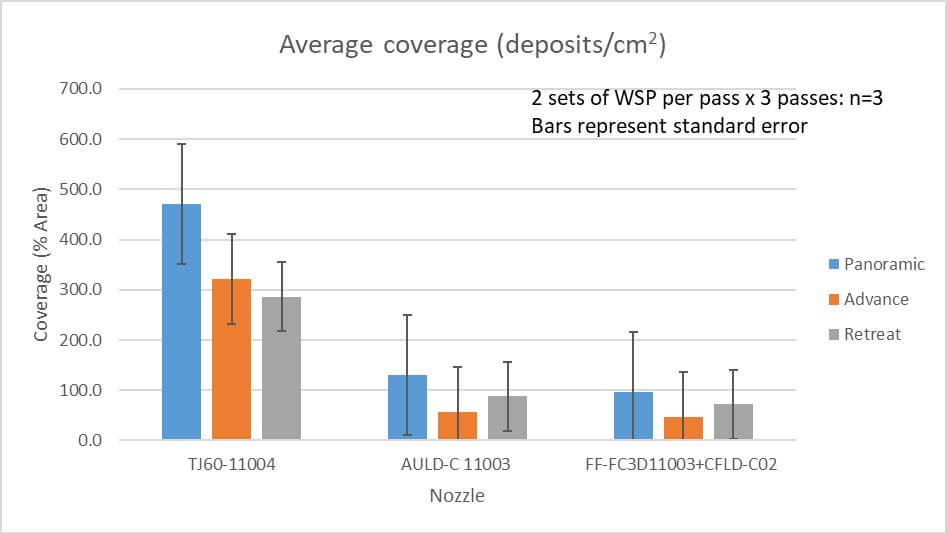
The resultant coverage is recorded in Table 2 and graphed in Figures 3 and 4.
Nozzle
Panoramic: Area covered (%) & deposit Density (#/cm2)
Advance: Area covered (%) & Deposit density (#/cm2)
Retreat: Area covered (%) & Deposit density (#/cm2)
AULD-C 11003
10.2% 130.4 deposits/cm2
7.9 % 56.1 deposits/cm2
11.1% 87.7 deposits/cm2
FF (CFLD-C02 & FC3D11003)
13% 97.5 deposits/cm2
9.0% 46.9 deposits /cm2
18.3% 72.4 deposits/cm2
TJ60-11004
22.3% 471.0 deposits/cm2
21.5% 320.9 deposits/cm2
11.4% 286.1 deposits/cm2
Table 2. Average coverage from three nozzles applying 187 L/ha (20 gpa).
Figure 3. Comparison of average percent area covered for three nozzles.Figure 4. Comparison of average deposit density for three nozzles.
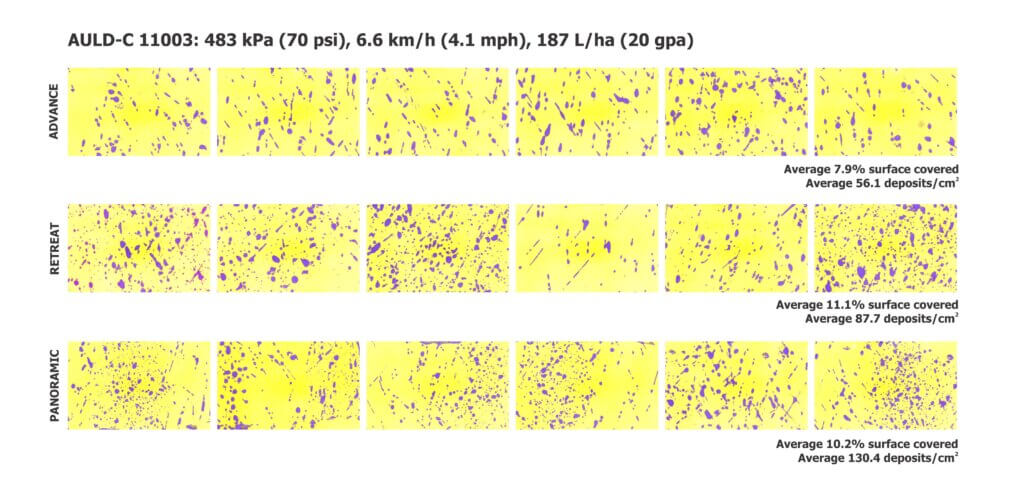
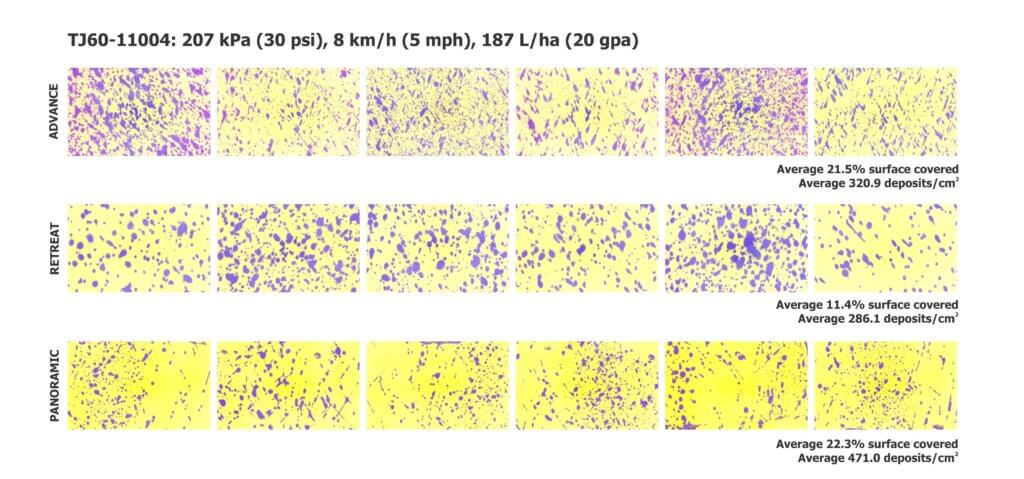
Unless you are experienced with interpreting coverage data, these numbers and graphs may not convey what coverage truly looked like. And since we saw some unexpected results, we felt it would be best to digitize the papers from each nozzle and create graphics to support our observations and opinions on how they performed. Each image shows six replications of each orientation. We’ll begin with the AULD in Figure 5.
The AULD was operated at a relatively high pressure to create the Coarse droplets recommended by the nozzle manufacturer. The steep rearward angle produced a higher degree of coverage on the retreat side compared to the advance. The streaky or tear-drop shaped deposits indicate a droplet that “scuffed” along the paper surface, almost but not quite in parallel. On the panoramic targets they tend to correspond with the sides of the paper, where the droplets are not aimed directly at the surface as in the “advance” and “retreat” surfaces. All in all, this nozzle performed well and created droplets large enough that we feel they would stay on course in a higher wind and not get tied up on the awns of the wheat head.
Figure 5. Digital scans of water sensitive papers from the AULD nozzle. Spray quality was C.
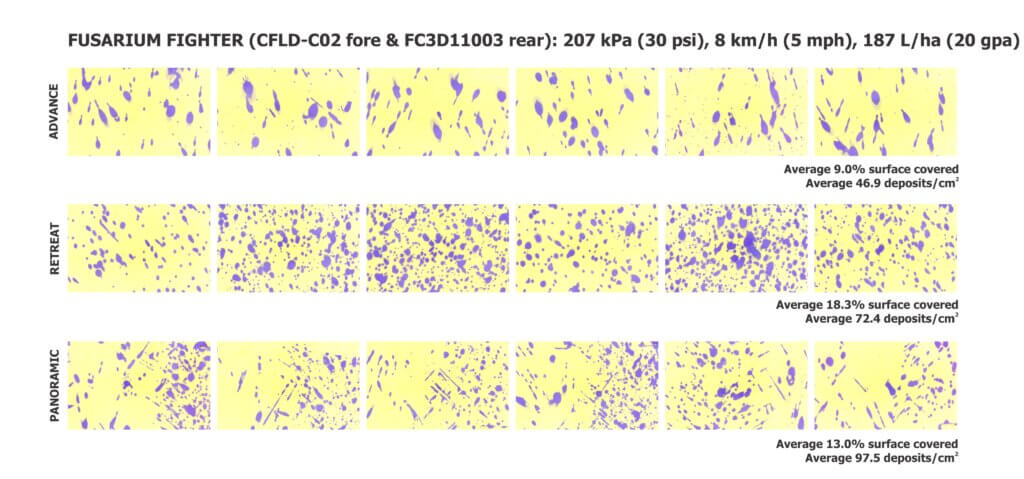
Next is the Fusarium Fighter. This nozzle was developed in Western Canada where, on average, sprayers tend to travel faster than they do in Ontario. Certainly this isn’t the case for all Ontario fields, but we chose to emulate usage in home farm operations where fields may be smaller and less level. This is relevant because faster travel speeds permit the use of a larger 3D nozzle to achieve 20 gpa, which in turn produces a coarser spray quality. In our trials, we traveled more slowly and that necessitated a smaller 3D that produced only a Medium droplet size. We hypothesized that those smaller droplets may not stay on course, but the papers show otherwise (Figure 6).
Figure 6. Digital scans of water sensitive papers. Spray quality was VC and M.
Coverage on the retreat side was very good and far outstripped the coverage on the advance side. In fact, the Very Coarse spray quality from the CFLD-C may be too large. Dropping from VC to C would create more droplets and a higher deposit density on the advance. We did see some gaps in the panoramic papers that likely reflect the lack of finer droplets which tend to move more erratically and contact the sides. Recall that we said weather conditions were ideal. It is still questionable how well a 3D producing a Medium spray quality would perform in windier conditions or on the boom ends where yaw tends to lift tips well above the ideal operating height.
Figure 7. All three tips operating on a stationary sprayer at 40 psi. The Fusarium Fighters (foreground), the TwinJets (middle) and the AULDs in the background.
Finally, the TwinJets (Figure 8). We used this nozzle only to demonstrate how the lack of an aggressive rearward angle and a Fine spray quality was not conducive to reliable wheat head coverage. Many studies have demonstrated that such a nozzle outperforms a single, conventional flat fan, but it is not the best choice of angled nozzles. Once again recall that these nozzles were positioned centre-boom where yaw and sprayer-induced turbulence were not an issue and in absolutely ideal environmental conditions.
We saw tremendous coverage on the advance side and while we saw comparatively less on the retreat side, it still performed well compared to the other nozzles. The panoramic targets also indicated suitable coverage, both as percent area covered and deposit density. BUT, if we have some questions about how the Medium spray from the 3D would perform in more challenging conditions, we are far more concerned about the fines from this tip. Having used this nozzle in past demonstrations we are well aware of how non-uniform and erratic coverage can be, and that translates to poor efficacy and increased drift. However, sometimes circumstances conspire to create exceptions, and the coverage we saw in this trial is hard to fault.
Figure 8. Digital scans of water sensitive papers. Spray quality was F.
This trial was not intended to rank nozzles, but to explore the merits of a few new designs and evaluate their respective coverage. If anything the results reinforce the need to operate angled sprays correctly and in appropriate weather conditions. Water sensitive paper remains a quick and easy method for sprayer operators to evaluate their own coverage and inform any corrective actions to improve results in their own unique circumstances.
Thanks to Dan and Paul Petker (Petker Farms) and Don Murdoch (Simcoe Research Station, University of Guelph) for providing the fields and operating the sprayers. Nozzle Ninja is gratefully acknowledged for the donation of AULD and Fusarium Fighter nozzles, and Spraying Systems Co. for the TwinJet nozzles and water sensitive paper.
This work was performed with Mark Ledebuhr (Application Insight LLC.), Adrian Rivard (Drone Spray Canada) and Adam Pfeffer (Bayer Crop Science – funding partner). Amy Shi is gratefully acknowledged for her assistance with statistical analysis.
Introduction
In June 2017, Transport Canada cleared the general use of drones. In 2018, Health Canada clarified that the use of Remote Piloted Aircraft Systems (RPAS) for pesticide application is not permitted under the Pest Control Products Act without sufficient data to characterize any associated risk. Currently, there are no liquid pest control products registered for application by drone in Canada.
Stakeholders want to use drones to apply pest control products in Canada. To that end, several research trials have been approved by Health Canada. However, multi-rotor drones represent a unique application technology more akin to air-assisted ground sprayers than manned aircraft. As such, conventional models for drift, exposure and efficacy may not apply. Fundamental questions surrounding the utility of drones must be addressed before efficacy and residue can be considered in any relevant context.
Research and user experience has identified, and is beginning to understand the relative influence of, external factors such as crop morphology, planting architecture, topography, and environmental conditions. Considered with the product mode of action, these factors inform operational settings such as altitude, travel speed, nozzle choice, and application volume to optimize applications. This collective “Use Case” depends on drone design, which is highly variable and rapidly evolving.
Having performed preliminary work characterizing effective swath width, and recognizing its popularity in North America, we used DJI’s Agras T10 in this study. Our objective was to evaluate fungicide efficacy on Northern Corn Leaf Blight, Tar Spot, Grey Spot and Common Rust in field corn, as applied using the T10. Drift and coverage would be characterized to provide context for the efficacy analysis, but also to develop data to inform best practices and possibly regulatory decisions surrounding risk. Aspects of the study would be repeated using conventional ground sprayer technologies to form a basis for comparison.
Objectives
Quantify spray coverage in field corn at three canopy depths, on adaxial and abaxial surfaces, as recovered tracer dye (indexed to % of applied rate ac-1), area covered (%) and deposit density (deposits cm-2).
Quantify drift as recovered tracer dye (indexed to % applied rate ac-1) collected using the horizontal flux method up to eight meters high on the immediate downwind edge of the application.
Evaluate the fungicide efficacy, applied using the T10, at 2 and 5 gpa as compared to a conventional overhead broadcast treatment at 16.7 gpa.
Material and Methods
Design
Trials were conducted between July and August of 2022 in three Ontario corn fields. The locations, the application methods and data collected are detailed in Table 1.
Field
Location
Corn Variety
Application Method
Rate (gpa)
Data Collected
1
Jaffa (42°45’56.6″N 81°02’06.5″W)
DKC45-65RIB
Agras T10
2 and 5
Drift, Coverage, Efficacy
Overhead Broadcast
16.7
Coverage, Efficacy
2
Fingal (42°42’17.9″N 81°15’15.3″W)
DKC49-09RIB
Agras T10
2 and 5
Drift, Coverage, Efficacy
Overhead Broadcast
16.7
Efficacy
3
Port Rowan (42°35’53.6″N 80°30’43.2″W)
P0720AM
Directed (Drop hoses)
20
Coverage
Table 1 – Trial sites by application method and data collected
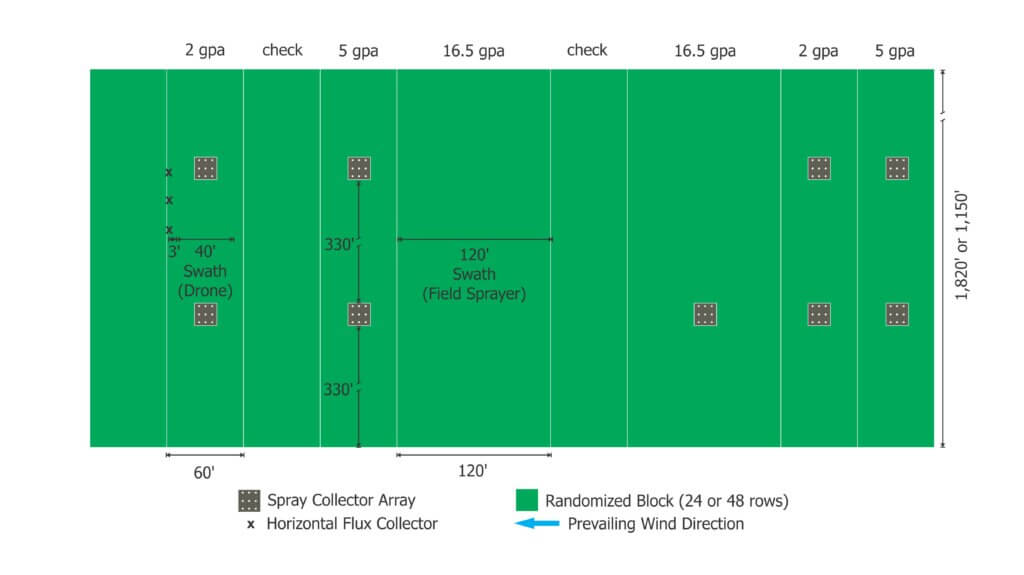
Treatments were arranged in a randomized complete block design (Figure 1). Corn was planted on 30″ centres, with about 6” in-row spacing between stalks. We targeted spray for the R1 stage of development (approx. 8’ high). Fields 1 and 2 each hosted two replicated treatments of 2 gpa, 5 gpa, and 16.7 gpa, as well as two unsprayed checks. In field 1, blocks were 60’ (24 rows) wide by 1,150’ long for the T10, and 120’ (48 rows wide) by 1,150’ long for the broadcast field sprayers. A single, 120’ swath was applied using the field sprayers, and four 10’ (4 row) swaths were required to spray the centre 40’ (16 rows) of corn using the T10. This was based on a 10’ effective swath width determined in previous research. Field 2 had a similar layout but was 1,820’ long.
Figure 1- Sample experimental layout for Field 2. In this example, horizontal flux collectors are positioned 3’ downwind to intercept any off-target drift from the edge of the adjacent 2 gpa treated area.
Coverage Analysis
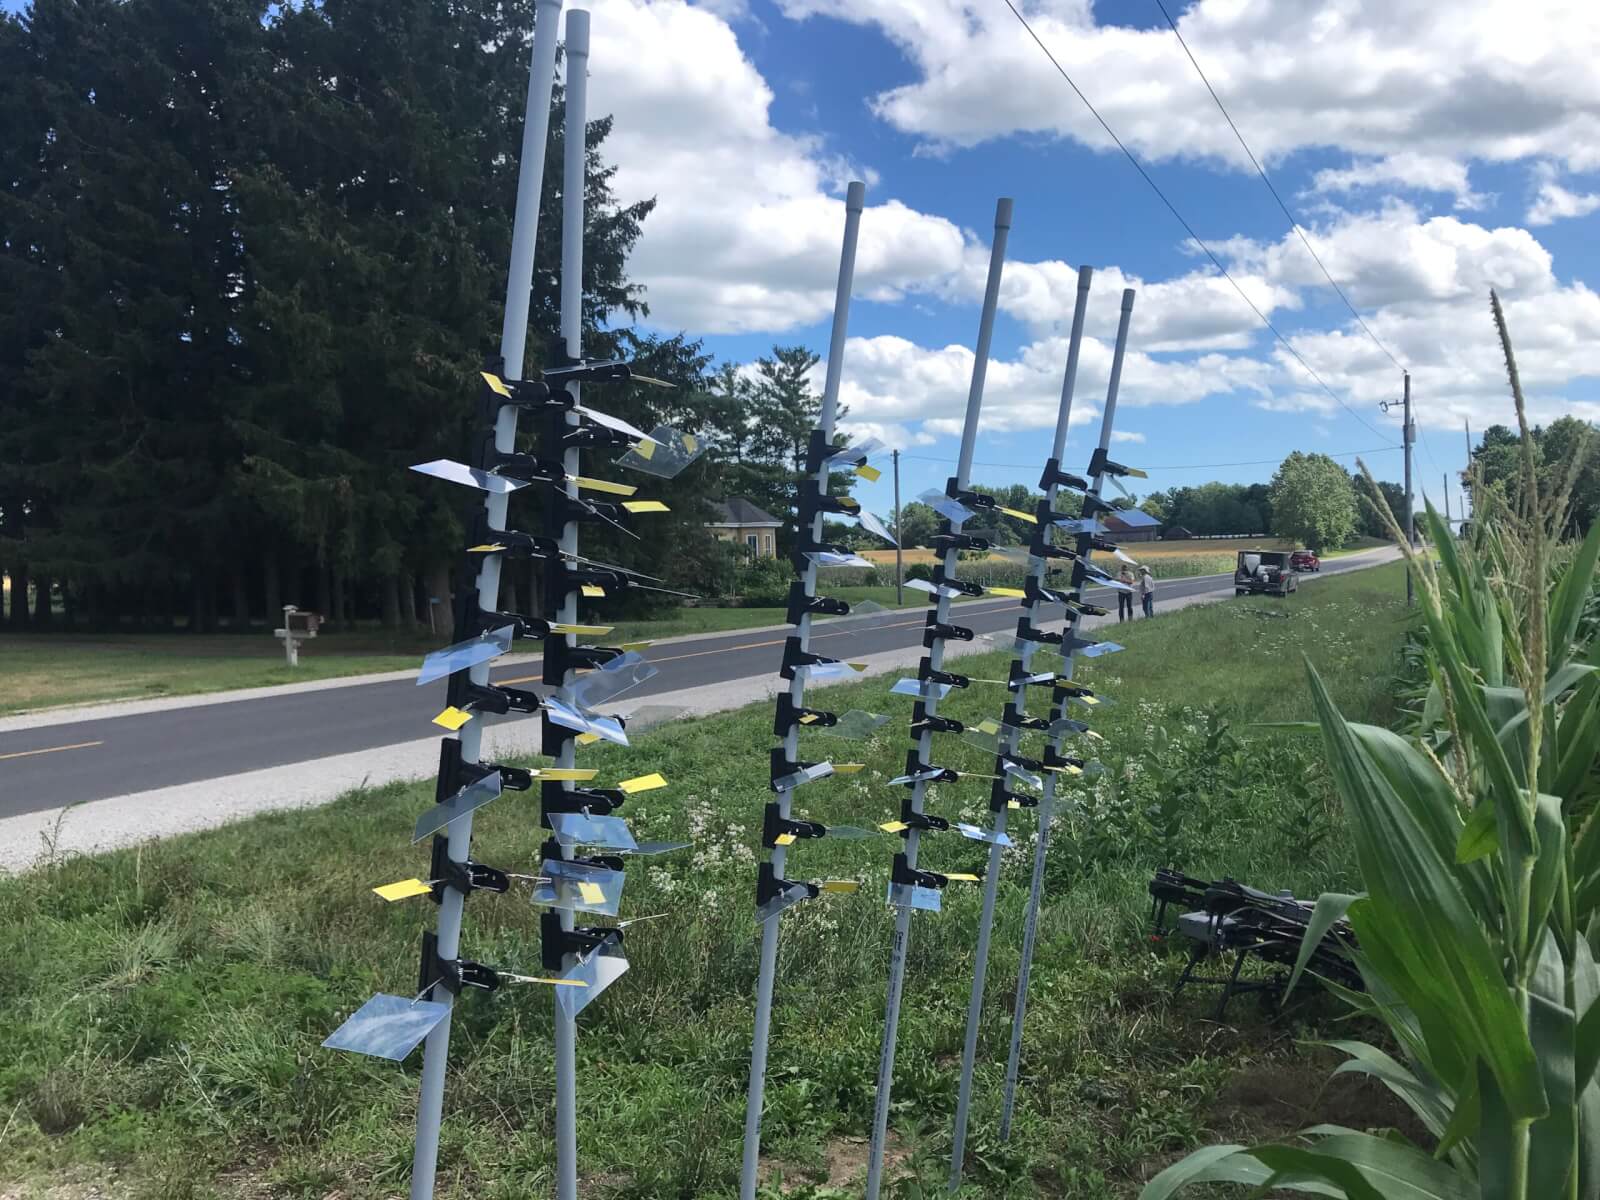
To account for variability, each treatment block was subdivided into two regions, each containing an array of nine spray collectors. Each spray collector (Figure 2) consisted of a vertical, 8’ pole in-row between corn plants. Samplers were attached at three depths to span the silking region: Top: 1.5’-2’ below the tassel. Bottom: 1.5’-2’ from the ground. Middle: halfway between them. Samplers were parallel with the ground to ensure the highest degree of spray interception. On one side, two 1”x3” water sensitive papers (WSP; Innoquest Inc.) were clipped back-to-back with a sensitive side positioned up (adaxial) and facing down (abaxial). The other clip held two 4” square sheets of Mylar in the same orientation. Sampler type was alternated vertically (e.g. Mylar – WSP – Mylar or WSP – Mylar – WSP).
Figure 2- Spray collectors temporarily loaded with WSP and Mylar samplers. These were held above the tassels as they were carried to the collection sites in each block. Three clips were positioned per pole, alternating Mylar and WSP samplers on each side, on two arrays of nine poles, as previously described.
This study used 864 WSP and 864 Mylar samplers for the RPAS treatments, and 162 WSP for the overhead broadcast and directed applications. Following the application, samplers were retrieved as soon as they were dry enough to handle (about 30 minutes) and individually placed into pre-labeled sealable plastic bags, each uniquely coded to the exact position and orientation of the collector.
Operational Use Cases
5 gpa: DJI Agras T10 was operated at 3.3 m/s, 2 m above tassels. TeeJet 11002 AIXR nozzles equipped with 50 mesh filters were operated at 70 psi.
2 gpa: DJI Agras T10 was operated at 7.0 m/s, 2 m above tassels. TeeJet 11002 AIXR nozzles equipped with 50 mesh filters were operated at 45 psi.
16.7 gpa: Overhead broadcast condition. Field 1 ran a John Deere 4038R operated at approx. 10 mph with TeeJet XR11006 nozzles on 20” spacing. Pulse width modulation (ExactApply) was engaged. Field 2 ran a New Holland 345 front-mounted boom sprayer with TeeJet XR11006 nozzles on 20” spacing.
20 gpa: Directed condition. John Deere R4038 operated at approx. 4.5 mph with Beluga drop hoses suspended on 30” centres to correspond with alley spacing. Two nozzle bodies were positioned 15″ apart equipped with Greenleaf Spray Max 110015 nozzles to span the silking area.
Drift Analysis
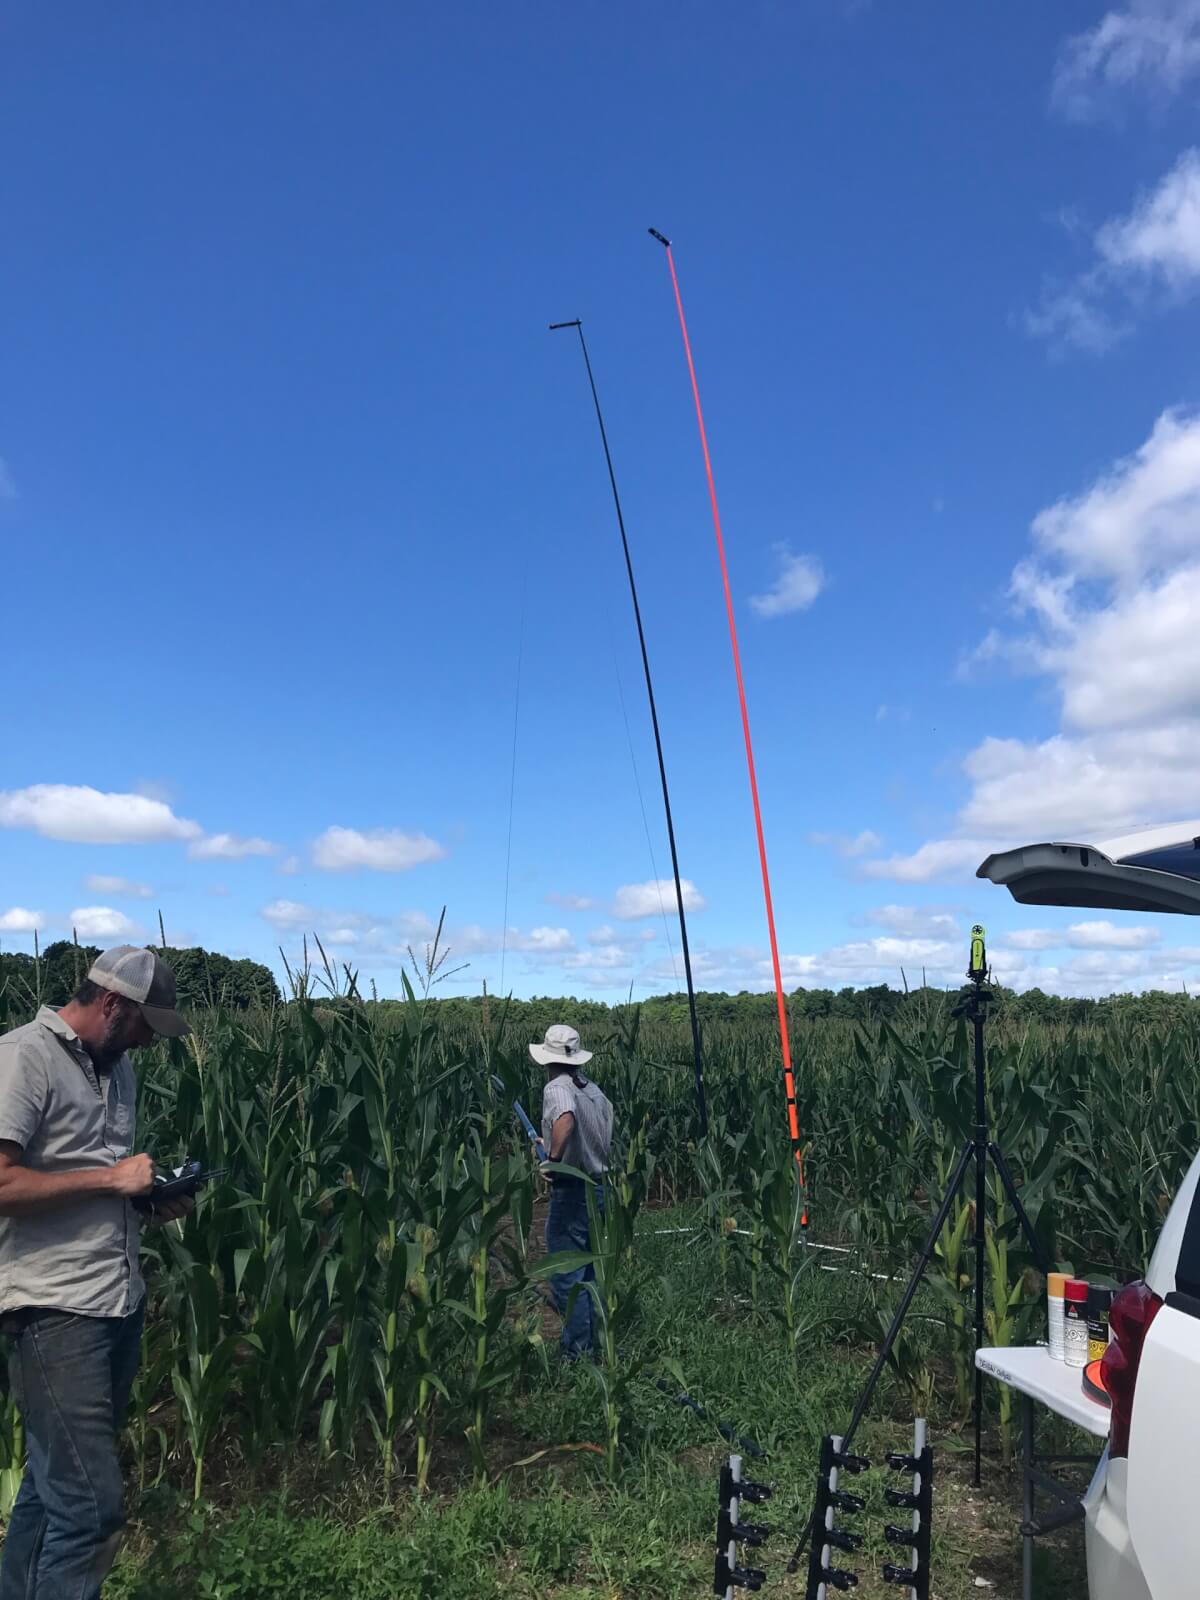
Three free-standing 26’ (8 m) horizontal flux collectors were positioned in the corn field approximately 3’, or 1.5 rows from the downwind edge of the spray plot downwind of the area treated by drone (Figure 3). The sampling poles were positioned about 30’ apart parallel to the treatment block. Sterilized, 1.8 mm braided polyethylene collector line was run up the poles on pulleys just prior to application. Following applications, the line was collected in 1 m lengths into sealed bags.
The assumption was that by placing the horizontal flux samplers as close to the “zero” downwind edge position as possible, nearly the entire off-swath movement of drift would be captured. A compromise of placing the samplers in the middle of the first row past the downwind swath edge was made due to the scale of the sample and the relative low swath precision of the drone. Placing the samplers closer to the zero downwind line was deemed to be too high a risk of inadvertently sampling in-swath.
Figure 3- Moving horizontal flux poles into the field prior to positioning them for trials. String collectors were run up the poles just before spray application and retrieved immediately afterwards.
Spray Solution (Formulated Product plus Tracer)
Fungicide was applied at field rates (8 oz/ac or 586 mL/ha). The field sprayer applied this at 16.7 gpa. The drone applied it at 2 or 5 gpa but also included tracer solution at 0.2% (20 ml/10L solution) vol./vol. of a 20% mass/mass solution of PTSA in dH2O. PTSA residue data assumes 100% recovery and 0% degradation of the tracer. Tests of PTSA with fungicide prior to the study showed no physical antagonism and >98% tracer recovery. Prior testing of PTSA showed an acceptable 1-2% solar degradation in the timeframe required to collect samplers. Tank samples were drawn from the drone at the beginning and end of each trial and used to confirm tank concentration and to establish fluorescence curves.
Weather Conditions
Weather data was collected using a Kestrel 3550AG weather meter (Kestrel Instruments) in a vane mount positioned 1 m above the tassel (approximately 1 m below drone altitude). Data was logged every 5 seconds. Issues with data loss required us to supplement local data with Field Level Weather Summary data (Table 2).
Date (2022)
Field
Vol. (gpa)
Avg. Temp. (°C)
Avg. Windspeed (km/h)
Start Time
Duration (min.)
Jul 25
1
5*
22.3
6.2
13:00
35
Jul 25
1
5
21.4
7.5
18:45
35
Jul 26
1
16.7
18.8
5.4
10:00
45
Jul 26
1
2
23.9
7.7
15:30
25
Jul 29
2
5**
n/a
16.4
11:00
35
Jul 29
2
2***
23.6
21.0
14:00
25
Aug 12
3
20****
25.4
6.3
13:30
15
Table 2- Date, location, and weather conditions for each treatment *Trial pass over spray collectors only – no horizontal flux collectors employed. **All bottom-level water sensitive paper samplers spoiled by high humidity. Wind changeable and horizontal flux poles moved 2x before application to orient downwind. ***Noted flocculation in tank samples likely from rainfastness adjuvant. Did not affect analysis. ****Coverage data from a single array of nine spray collectors with water sensitive paper samplers.
Results
Statistics
The % applied rate ac-1, % area covered, and deposits cm-2 were subjected to analysis of variance using SAS® OnDemand for Academics PROC GLM. When a significant treatment effect was found, means were compared using Tukey’s honest significant difference test (HSD) at p=0.05.
Data Collation
Each spray collector was a vertical structure that supported Mylar samplers at three depths. Each depth held two samplers oriented abaxially or adaxially, in parallel with the ground. When discussing the amount of PTSA recovered by sampler depth or by sampler orientation, the % applied rate ac-1 of each of the nine related samplers were averaged within each array (n=2 arrays per block times two replicates equal n=4 per treatment).
When considered from above, the six Mylar samplers are vertical cross-sections of the same area of ground. Therefore, the % applied rate ac-1from each sampler was added to represent the total mass of tracer intercepted per collector. When these nine sub-samples are averaged, we arrive at the average % applied rate ac-1 per array.
Similarly, the % applied rate ac-1 from each 1 m length of string on a horizontal flux collector could be averaged across collectors by relative position to explore drift by height (n=3 poles per block times two replicates equal n=6 per treatment). Alternately, the total PTSA recovered per pole could be calculated (n=3 poles per block times two replicates equal n=6 per treatment). This interpretation allowed us to perform a mass balance accounting of residue in-canopy and as drift compared to the known applied rate ac-1.
It was not possible to collate the data in this fashion for the WSP because it was not possible to index % area or deposits cm-2 on a 1”x3” area to a theoretical maximum. Therefore, we averaged the nine samplers within an array relative to their position and orientation (n=2 arrays per block times two replicates equal n=4 per treatment) or averaged the six samplers per collector prior to averaging all collectors in an array (n=2 arrays per block times two replicates equal n=4 per treatment).
RPAS Coverage – Mylar Samplers
There is a negative linear relationship (r2=0.997) between the depth of the sampler and the average % applied rate ac-1 (Table 3). The deeper the sampler, the less tracer recovered. The sum of the average % applied rate ac-1 at each depth was 17.7% of known rate applied rate ac-1.
Sampler Depth
Avg. % Applied Rate ac-1
Significance
Top
9.6
A
Middle
5.7
B
Bottom
2.4
C
Total:
17.7
–
Table 3- The depth of the sampler had a significant effect on the overall average amount of PTSA recovered.
The orientation of the sampler significantly affected the overall average amount of tracer recovered (Table 4). The abaxial surfaces intercepted an average 11.1 % applied rate ac-1 less (a 97% difference) than adaxial surfaces. Note: When Mylar was retrieved a few had physically shifted, potentially exposing the back side of abaxial collectors to primary deposition from above. Therefore, it is assumed that the actual deposit is lower than reported here.
Sampler Orientation
Avg. % Applied Rate ac-1
Significance
Adaxial
11.4
A
Abaxial
0.3
B
Table 4- The orientation of the sampler had a significant effect on the overall average amount of PTSA recovered.
When we separate the data to focus on the volume applied, we see volume had a significant impact on the amount of tracer recovered (Table 5). The average % applied rate ac-1 was 2.1% less (a 58% difference) in the 2 gpa condition compared to the 5 gpa condition.
Field
Avg. % Applied Rate ac-1
Significance
1
7.1
A
2
4.6
B
Table 5- The field location had a significant impact on the average amount of PTSA recovered.
When we isolate the volume applied by field, the 2 gpa treatment resulted in less coverage in field 2 (average 1.4 % applied rate ac-1 or 28% less) and significantly for the 5 gpa treatment (average 3.6 % applied rate ac-1 or 41% less: Table 6).
Date
Field
Volume (gpa)
Avg. % Applied Rate ac-1
Significance
Jul 25
1
5
9.2
A
Jul 26
1
2
5.0
B
Jul 29
2
5
5.6
C
Jul 29
2
2
3.6
B
Table 6- The average amount of PTSA recovered by date and location show lower overall recovery in Field 2.
When sampler depth is included in the field analysis (Table 7), we see similar deposition patterns; a negative linear relationship between coverage and canopy depth in all treatments save the 5 gpa treatment in field 2. Closer inspection confirms a reduction in coverage for the 2 gpa condition in field 2 versus field 1, and a significant reduction for the 5 gpa condition in field 2 versus field 1.
Table 7- The average residue recovered by date, location and sampler depth is significantly less in the 5 gpa condition in field 2 and does not distribute linearly by sampler depth.
RPAS Drift – Horizontal Flux
Overall, the volume applied had a significant impact on drift, where the 2 gpa treatment resulted in an average increase of 1.6 % applied rate ac-1 (44% difference: Table 8) versus the 5 gpa treatment.
Volume Applied (gpa)
Avg. % Applied Rate ac-1
Significance
2
3.6
A
5
2.0
B
Table 8- The volume applied had a significant impact on the amount of the PTSA recovered.
As with the Mylar samplers, there was a “field effect” where the field had a statistically significant impact on the amount of tracer recovered (Table 9). However, unlike the Mylar samplers in the crop, more tracer was recovered in field 2 (average increase of 3.2 applied rate ac-1 or a 67% difference) than in field 1.
Field
Avg. % Applied Rate ac-1
Significance
1
1.4
A
2
4.2
B
Table 9- The field location had a significant impact on the amount of PTSA recovered.
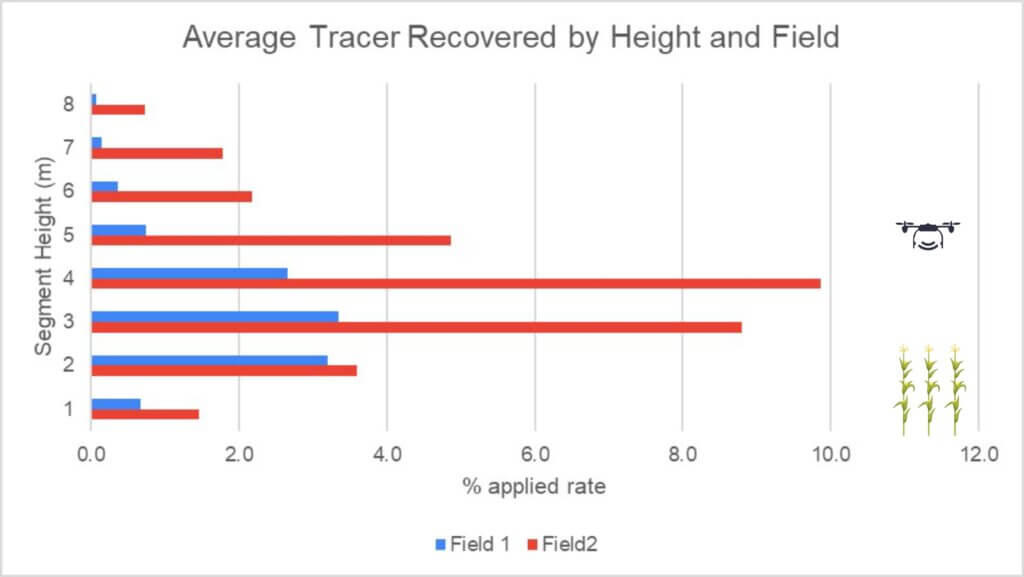
The pattern of deposition by height was similar across all treatments. For context, note that the first 2.5-3 m of string were within the corn canopy and drone altitude was approximately 5 m off the ground (2 m over the tassels) per Figure 4 and 5. The differences were only statistically significant in field 2 (Table 10) where an average 33% applied rate ac-1 was intercepted compared to 11% in field 1.
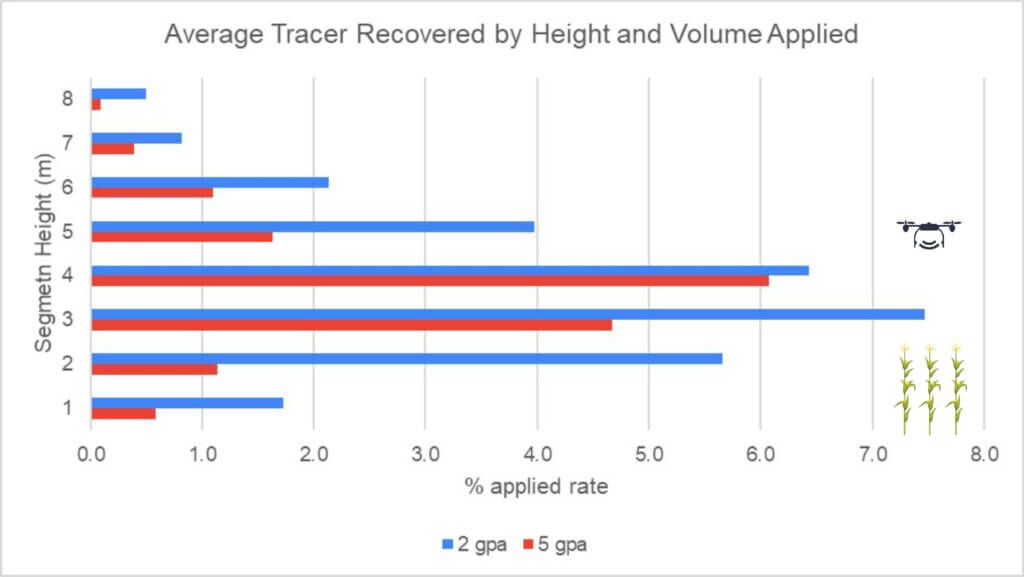
Figure 4- Average PTSA recovered (% applied rate ac-1) by height and field.Figure 5- Average PTSA recovered (% applied rate ac-1) by height and volume applied.
Height (1m segment in m from ground)
Field 1: Avg. % Applied Rate ac-1
Sig.
Field 2: Avg. % Applied Rate ac-1
Sig.
8
0.7
A
1.5
C
7
3.2
A
3.6
BC
6
3.3
A
8.8
A
5
2.7
A
9.9
A
4
0.7
A
4.9
AB
3
0.4
A
2.2
BC
2
0.1
A
1.8
C
1
0.1
A
0.7
C
Total:
11.2
–
33.3
–
Table 10- The average amount of PTSA recovered by height for field 1 and field 2.
The volume applied had a significant effect on the total PTSA tracer detected in both fields, with an average 4.4% applied rate ac-1 more (a 59% difference) recovered in the 2 gpa treatment (Table 11 and Figure 5). Separated by fields, the 5 gpa treatment had an average 1.4% % applied rate ac-1 more (a 77% difference) in field 2 and the 2 gpa treatment had an average 2.8% % applied rate ac-1 more (a 76% difference) in field 2.
Volume Applied (gpa)
Field 1: Avg. % Applied Rate ac-1
Sig.
Field 2: Avg. % Applied Rate ac-1
Sig.
2
2.2
A
5.0
A
5
0.7
B
2.1
B
Table 11- The volume applied had a significant impact on the amount of PTSA recovered.
Mass Balance Accounting
It is never possible to entirely “close mass” in spray studies because there are other surfaces (e.g. leaves) within the vertical profile that intercept spray, as well as off-swath deposition and the ground itself (not measured in this study). Nevertheless, the exercise does allow us to estimate and compare how much spray was captured and how much remains unaccounted for (Table 12). We see that the 2 gpa treatment in field 1 had the highest unaccounted-for fraction, and on average we were able to account for an average 53% of the applied rate ac-1 in this study.
Field (Volume in gpa)
Coverage: Avg % Applied Rate ac-1 (A)
Drift: Avg % Applied Rate ac-1 (B)
Total % Detected (A+B)
Unaccounted Fraction [100-(A+B)]
1 (5)
51
5
56
44
1 (2)
26.5
17
43.5
56.5
2 (5)
30
24
54
46
2 (5)
19.5
40
59.5
40.5
Table 12- Closing mass using % PTSA detected on in-canopy samplers and on drift collectors.
RPAS and ground rig coverage – Water Sensitive Paper
The depth of the sampler had a significant effect on the overall average % area covered at all depths (Table 13). However, there was no significant difference at the two lower depths for deposit density (Table 14). In both cases, the negative linear relationship between coverage and sampler depth corresponds closely to the PTSA recovered on the Mylar samplers (see Table 3).
Sampler Depth
Avg. Coverage (% Area)
Significance
Top
2.80
A
Middle
1.28
B
Bottom
0.62
C
Table 13- Overall average % coverage by sampler depth.
Sampler Depth
Avg. Coverage (Deposits cm-2)
Significance
Top
44.5
A
Middle
17.9
B
Bottom
7.2
C
Table 14- Overall average deposit density by sampler depth.
The sampler orientation had a significant effect on both overall average % area covered (Table 15) and deposits cm‑2 (Table 16).
Sampler Orientation
Avg. Coverage (% Area)
Significance
Adaxial
3.03
A
Abaxial
0.12
B
Table 15- The orientation of the sampler had a significant effect on the average % area covered.
Sampler Orientation
Avg. Coverage (Deposits cm-2)
Significance
Adaxial
43.5
A
Abaxial
3.1
B
Table 16- The orientation of the sampler had a significant effect on the average deposit density.
The treatment had a significant effect on the overall % coverage (Table 17) with the overhead broadcast condition covering an average 3.31% more sampler surface (a 60% difference) compared to the next highest treatment value. The directed application delivered a significantly higher 67 deposits cm-2 (a 72% difference) compared to the next highest treatment value (Table 18).
Treatment (gpa)
Avg. Coverage (% Area)
Significance
Broadcast (16.7)
5.91
A
Directed (20)
2.32
B
Drone (5)
1.34
BC
Drone (2)
0.55
C
Table 17- Overall average % coverage by treatment.
Treatment (gpa)
Avg. Coverage (Deposits cm-2)
Significance
Broadcast (16.7)
92.6
A
Directed (20)
25.8
B
Drone (5)
22.9
B
Drone (2)
5.9
B
Table 18- Overall average deposit density by treatment.
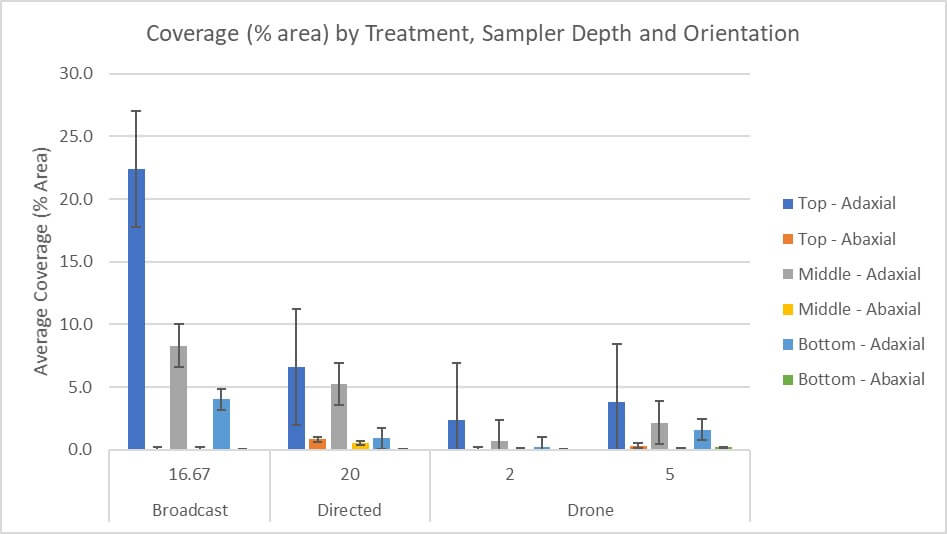
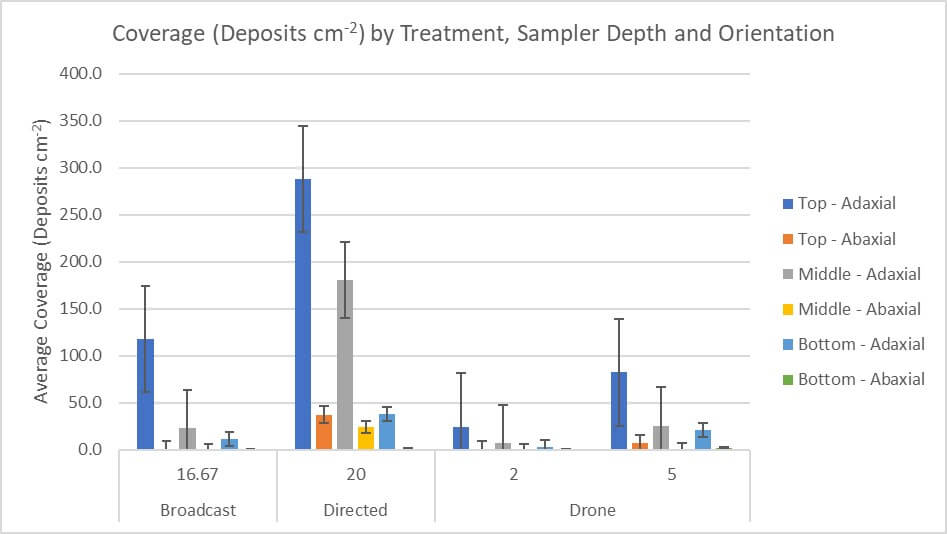
When we increase resolution to include sampler orientation, we see high standard errors typical of the variability inherent to spray coverage analysis (Figures 6 and 7). The broadcast treatment had the highest average adaxial % area coverage and the second highest average deposit density. The directed treatment had the second highest average adaxial % area coverage and the highest average deposit density but had the highest overall average coverage on the abaxial samplers. RPAS coverage on all samplers was lowest overall and was relative to the volumes applied.
Figure 6- Coverage (% area) by treatment, sampler depth and orientation.Figure 7- Coverage (Deposits cm-2) by treatment, sampler depth and orientation.
Focusing on RPAS treatments, the orientation of the sampler significantly affected coverage (Tables 19 and 20).
Sampler Orientation
Avg. Coverage (% Area)
Sig.
Avg. Coverage (Deposits cm-2)
Sig.
Adaxial
1.1
A
11.6
A
Abaxial
0.0
B
0.4
B
Table 19- RPAS (2 gpa) coverage by sampler orientation.
Sampler Orientation
Avg. Coverage (% Area)
Sig.
Avg. Coverage (Deposits cm-2)
Sig.
Adaxial
2.5
A
47.3
A
Abaxial
0.2
B
7.5
B
Table 20- RPAS (5 gpa) coverage by sampler orientation
Continuing to focus on the RPAS treatments, the depth of the sampler had a significant effect on overall average coverage at both 2 gpa (Table 21) and 5 gpa (Table 22). Just as with the average % applied rate ac-1 (included here for comparison), the overall average coverage on the top adaxial sampler was significantly higher than the other two depths for % area covered and deposits cm-2.
Sampler Depth
Avg. Coverage (% Area)
Sig.
Avg. Coverage (Deposits cm-2)
Sig.
Avg. % Applied Rate ac-1
Sig.
Top
1.2
A
12.8
A
7.5
A
Middle
0.4
B
3.9
B
3.8
B
Bottom
0.1
B
1.3
B
1.7
B
Table 21- Coverage on the top sampler was significantly different than other depths at 2 gpa.
Sampler Depth
Avg. Coverage (% Area)
Sig.
Avg. Coverage (Deposits cm-2)
Sig.
Avg. % Applied Rate ac-1
Sig.
Top
2.1
A
48.3
A
9.2
A
Middle
1.1
B
17.6
B
5.8
B
Bottom
0.9
B
16.4
B
2.3
B
Table 22- Coverage on the top sampler was significantly different than other depths at 5 gpa.
Comparing data from WSP to Mylar Samplers
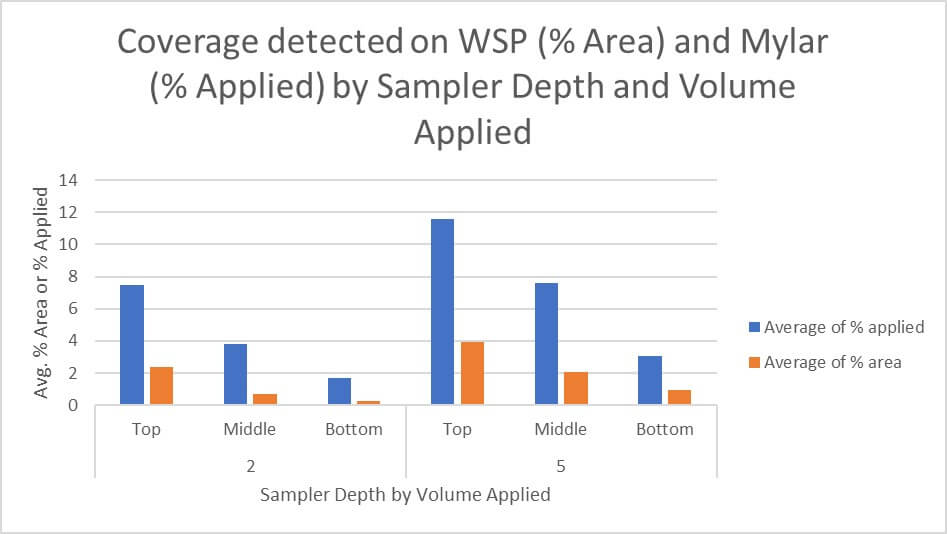
There was a correlation between the % area coverage detected using WSP and the tracer recovered from the Mylar samplers. Deposit density provides valuable information about the distribution of spray over the target surface but does not always correlate with % area covered, and it is therefore omitted from this comparison. When we plot the average % area covered from the adaxial WSP against the average % applied rate ac-1 from the Mylar samplers, we see the same near-linear pattern of decay with depth (Figure 8).
Figure 8- Average coverage from adaxial samplers plotted by depth and volume applied show similar coverage patterns.
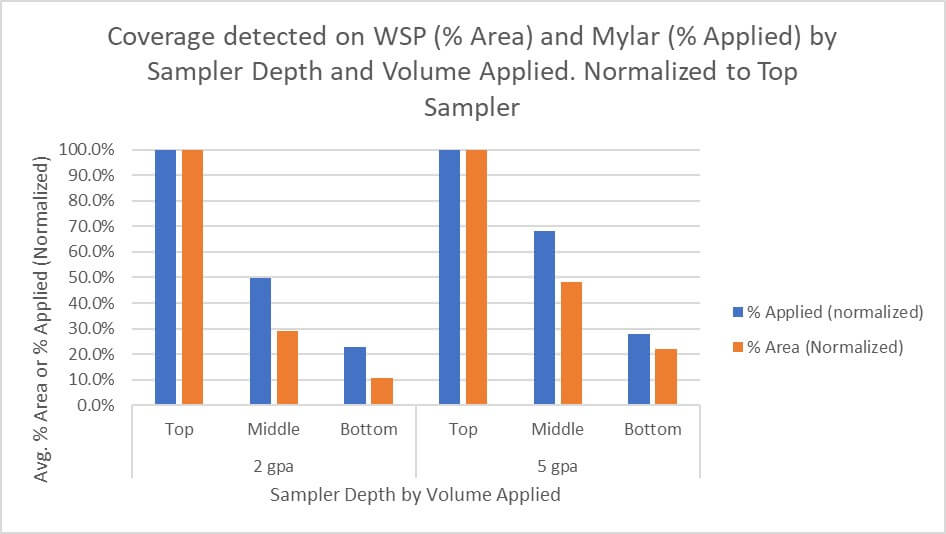
If we assume each top, adaxial sampler (irrespective of sampler material) represents the highest degree of coverage, we can assign it a value of 100% and index the data to this value. This allows us to visualize and compare the two sampler types directly (Figure 9) and illustrates similar relative coverage, but perhaps a greater rate of decay for the WSP.
Figure 9- Average coverage from adaxial samplers plotted by depth and volume applied show similar coverage patterns. Normalized to top sampler.
Net Revenue and Disease Pressure
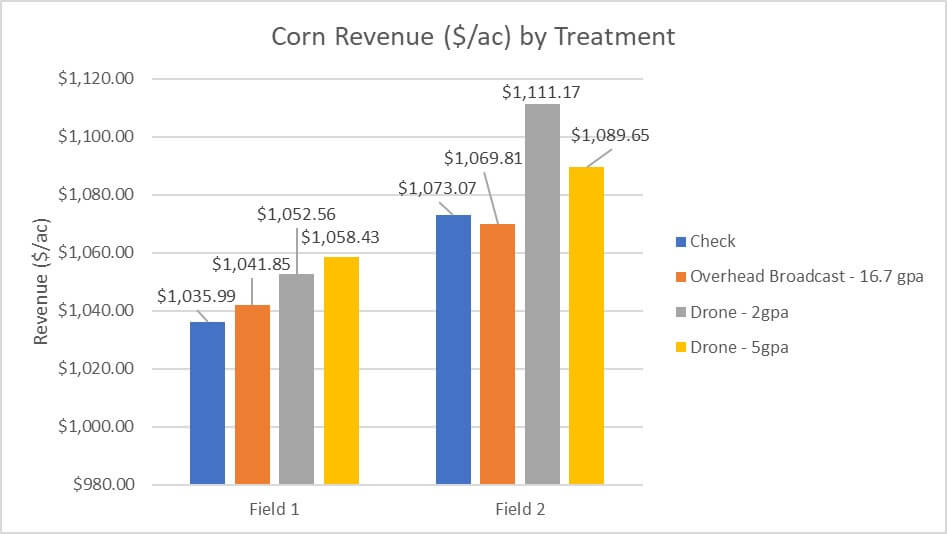
Crops were harvested at the R4 stage of development. There was no disease pressure detected in any field and no clear impact of application method on net revenue (Figure 10). Results based on the following formula: (CAD $/ac) = (Seed Yield × Corn Sale Price) – Drying Cost. No conclusions regarding efficacy can be drawn from this data.
Figure 10- Net Revenue (CAD $/ac) by field and treatment.
Key Observations
Water Sensitive Paper (WSP) measurements of percent area covered (% area) and deposit density (deposits cm-2), and Mylar samplers measuring mass deposit (% applied rate ac-1), revealed similar coverage patterns, making both samplers viable methods for RPAS coverage analysis. These are complimentary methods that reveal different aspects of coverage. When possible, they should be used simultaneously to produce a more complete analysis.
RPAS and conventional overhead broadcast applications produced similar deposition patterns in the corn canopy: A negative linear relationship between coverage and adaxial sampler depth was observed for most treatments (r2=0.997) and abaxial coverage was very low or more often, nonexistent. Further, overall coverage shared a direct relationship with volume for RPAS and conventional overhead broadcast applications.
Directed applications in this study employed a finer spray quality, released laterally from within the canopy. This produced a different coverage pattern than the RPAS and overhead broadcast applications. Per WSP, this treatment resulted in the highest overall deposit density and was the only treatment to produce significant deposition on abaxial surfaces.
For RPAS, spray coverage was significantly reduced by -58% (based on avg. applied rate ac-1), by -59% (based on avg. % covered) and by -74% (based on avg. deposits cm-2) and drift was significantly increased by +73% for the 2 gpa treatments versus the 5 gpa. We attribute this primarily to drone travel speed, which increased from 3.3 m/s at 5 gpa to 7 m/s at 2 gpa. For context, and with certain exceptions, travel speed shares a negative relationship with spray coverage and a direct relationship with drift in airblast and field sprayer applications.
There was a “field effect” where field 2 had lower overall RPAS coverage for both 2 and 5 gpa treatments. Compared to field 1, by -28% for the 2 gpa treatment, and by -41% for 5 gpa. Average drift increased by +76% for 2 gpa and by +77% for 5 gpa. We attribute this to the significantly higher wind conditions in field 2.
Given the lack of disease pressure in the two fields, and the lack of any significant difference in revenue by treatment within each field, efficacy is inconclusive. This study represented only two of eight fields in a larger RPAS efficacy trial where five locations had disease pressure high enough to rate. Preliminary results suggest that Tar Spot control from a 5 gpa drone application may be comparable to that of a 16.7 gpa overhead broadcast application from a field sprayer (data not shown).
Summary
Drone and conventional overhead broadcast treatments deposited spray in a similar pattern (a negative linear relationship with canopy depth and very low or no abaxial coverage), irrespective of the method used to analyze coverage. RPAS produced significantly lower coverage than the conventional overhead broadcast treatment, which is attributed primarily to the low volumes employed, per the direct relationship between volume applied and overall coverage (up to some point of diminishing return). High ambient windspeed significantly increased drift in both the 2 and 5 gpa conditions and reduced spray coverage. High travel speeds (required to apply 2 gpa) likely contributed to the significantly increased drift and reduced coverage in that treatment versus 5 gpa. For the use cases explored in this study, low volumes and high travel speeds are not advisable for RPAS, particularly in high wind conditions. Future work separating the travel speed and ambient wind speed variables would clarify their relative influence on RPAS drift and coverage.
This video presentation is covers the highlights of the study. And disregard the verbal slip-up: we didn’t travel 110 mph.