An “Alternate Row Middle (ARM)” traffic pattern is where the sprayer passes down every second row. The intent is to improve work rate by cutting the driving time in half. The operator hopes to provide suitable coverage on both the sprayer-facing half of the canopy, and that half of the canopy facing the next alley. In our experience, this depends on sprayer design, and only works in very small/young plantings (or only for the first few applications of the season). Even then, the side facing the sprayer tends to get saturated in an effort to ensure a threshold dose reaches the far side. We’ve already captured the pros and cons of ARM in this article, and (spoiler alert) unless you’re using a wrap-around style design, it’s generally not the best approach for protecting an orchard, bush, cane or vine crop.
So why on Earth would we be testing it here?
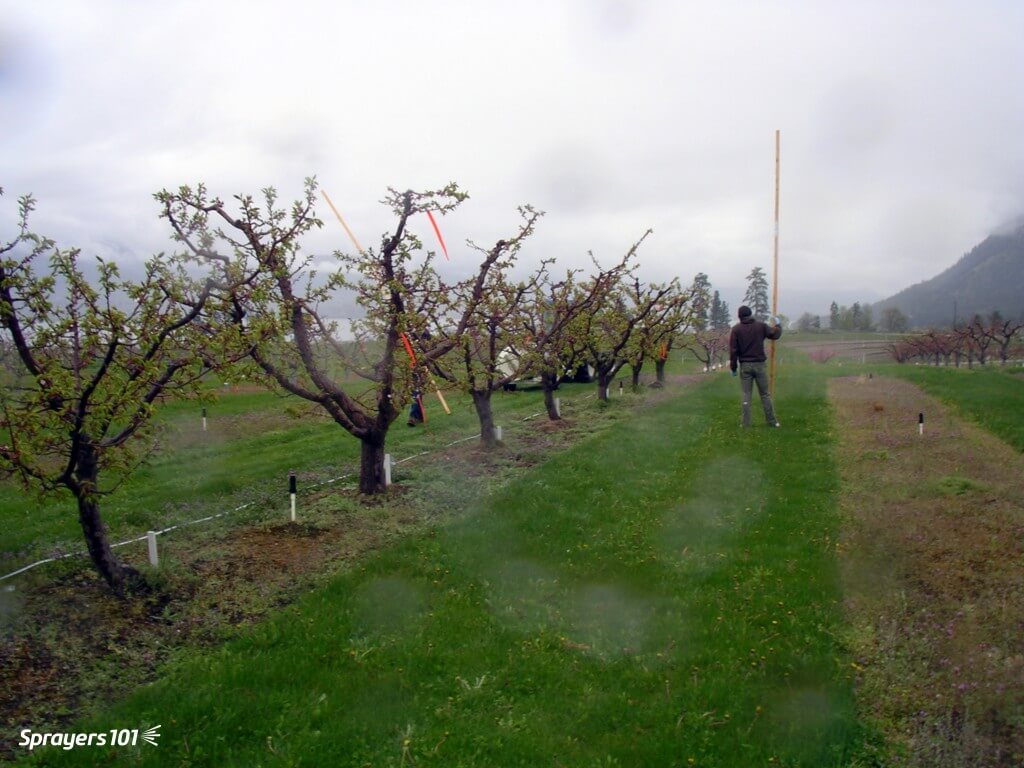
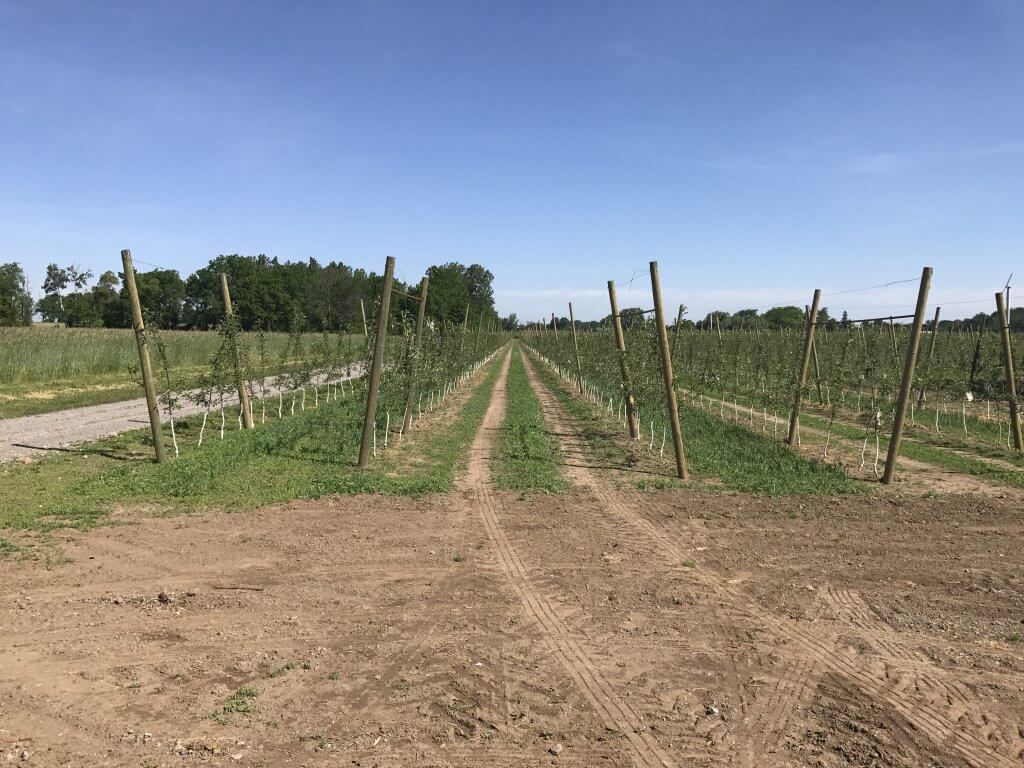
We were contacted by an orchardist who planted a test block of Gala (est. spring, 2017) in an unusual way. He called it “V-Trellis Vertical Axis Cross”. Basically, he created an orchard architecture that only allowed equipment (e.g. platforms, sprayers) to pass down every second row. He figured it would save 35% of his labour costs. In the photo and illustration below, you can see the posts lean over the drivable alleys, creating a “V” shape.
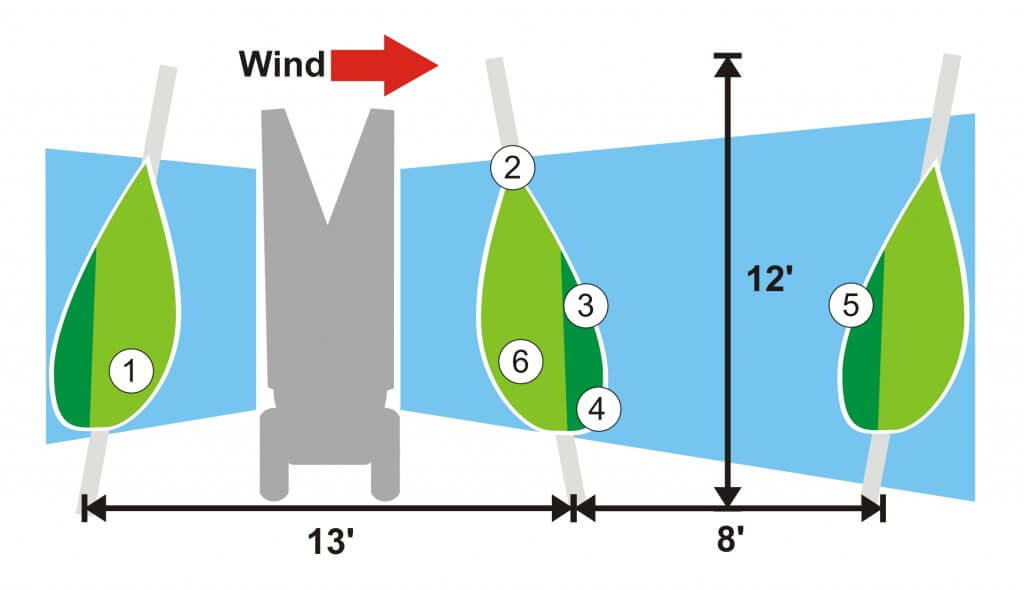
So, given that he couldn’t fit a sprayer down every row, we had no choice but to try to optimize sprayer settings for ARM applications. Note the six numbers in circles in the above illustration. They indicate where we would eventually place water-sensitive papers to diagnose spray coverage.
Here are the settings the orchardist was using before we made any adjustments:
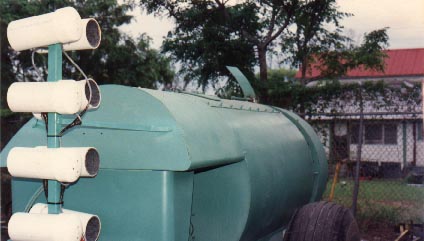
- Turbomist sprayer with 11 foot high tower
- Bottom-most nozzle was on and every second nozzle position skipped for a total of 5 nozzles active per side
- Nozzles were TeeJet ceramic disc-core. Top to bottom: D3-DC45, D3-DC45, D3-DC45, D3-DC45, D3-DC25
- 7 km/h (4.35 mph) travel speed per a speedometer app on a smartphone
- Tractor engine speed was 2,150 rpm (PTO was ~ 540 rpm)
- Fan set in low gear
- Pressure was 190 psi
- Ambient wind gusting to 8 km/h, temperature of 30°C, RH ~65%.
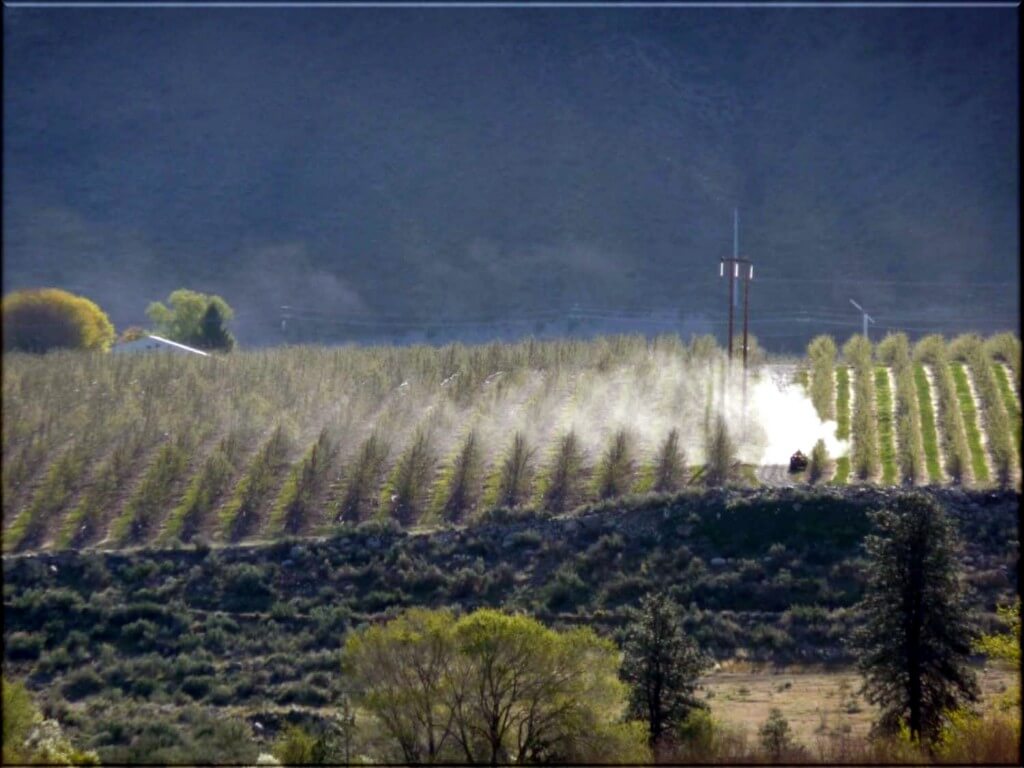
And here is a video of what the sprayer was doing before we changed any settings. This is a single upwind pass, and as you can see, the spray blew through at least five downwind rows. Obviously, this was far too much air and spray volume.
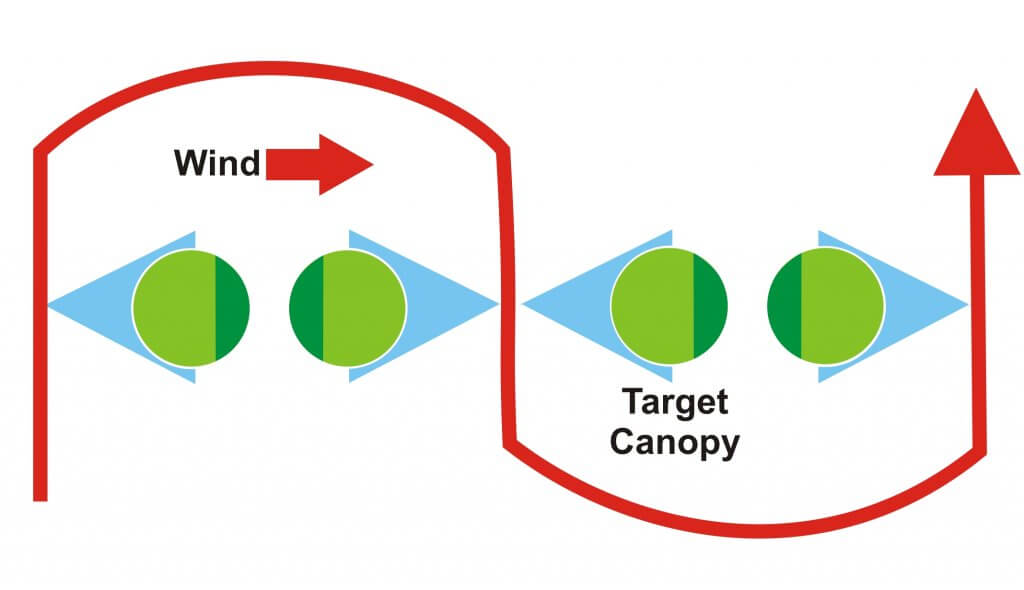
When we diagnose coverage in an every-row situation, we drive the alleys on each side of the target row (i.e. two passes). But, when diagnosing ARM spraying, we want to account for every drop of cumulative coverage from spraying upwind rows. So, we have to do three passes, as shown in the illustration below. In this top-down diagram, the sprayer travels the red line.
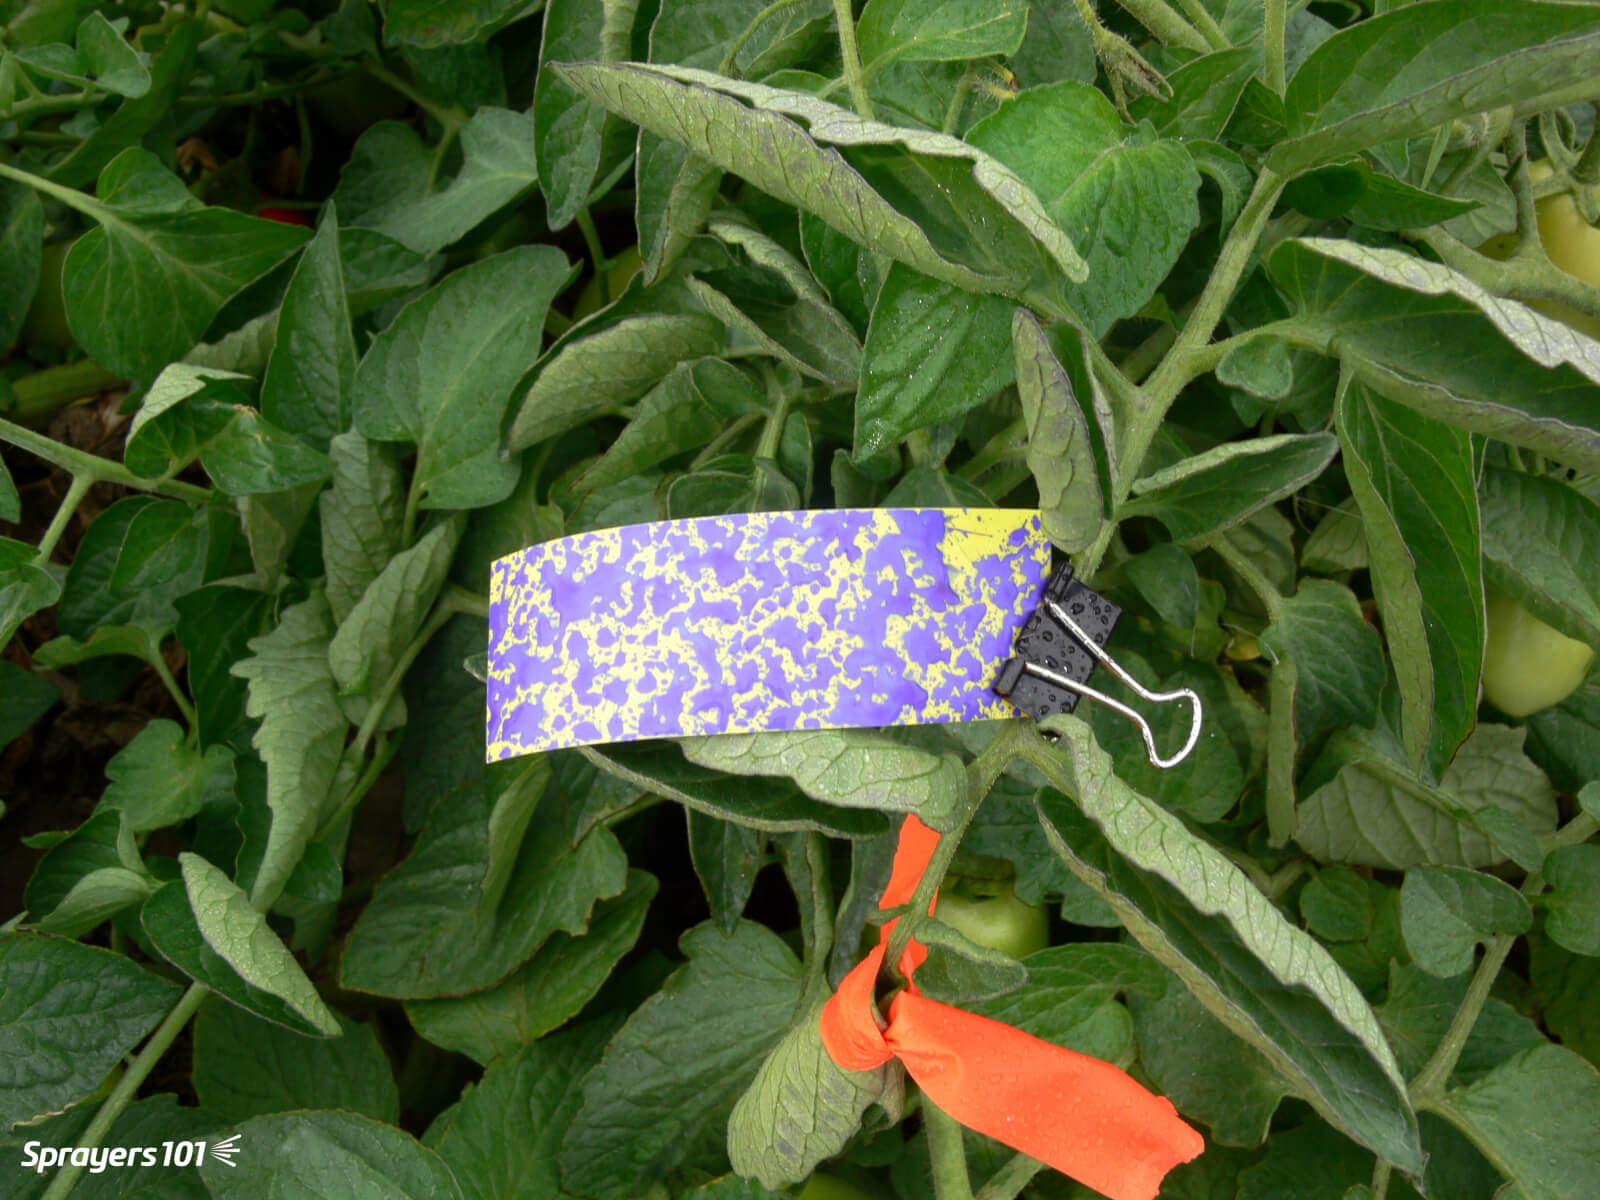
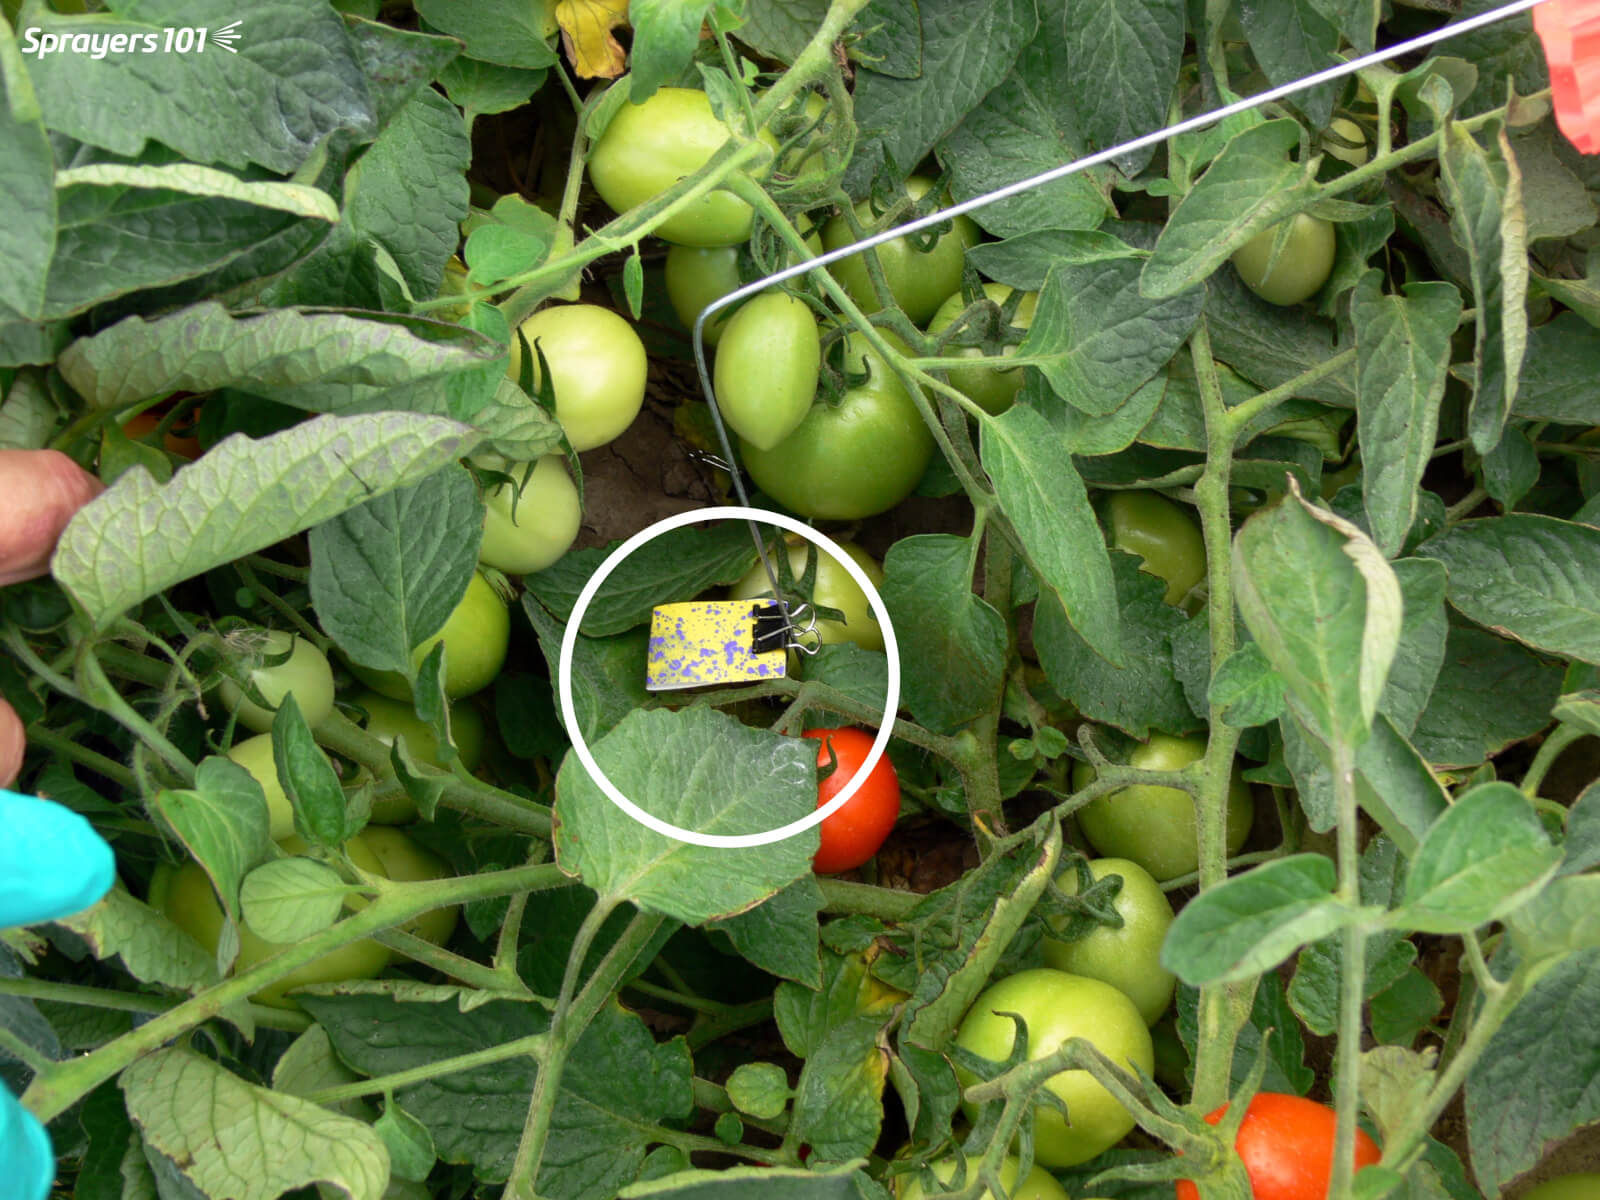
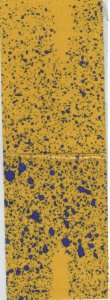
In order to establish a baseline, we diagnosed coverage for the original settings using water-sensitive papers in the six positions indicated above. We folded them in half, so a sensitive side faced each alley. We sprayed water and later digitized the cards to determine the percent coverage on the papers. Remember, if 80% of the cards receive at least 10-15% surface coverage and a deposit density of 85 drops per cm2, it’s typically sufficient.
Here are our results, with percent area-covered indicated in each position, as well as a representative scan of one of the papers. There’s no need to provide deposit density, which after about 30% surface coverage cannot be reliably determined.


So, if the video doesn’t convince, then the papers certainly do: This was way too much air and spray mix.
Next, we performed a series of air adjustments using ribbons (detailed here and here) which led us to reduce engine speed from 2,150 rpm to 1,300 using the Gear-Up, Throttle-Down method. Then we used the OrchardMax calculator to establish an ideal spray volume and guide us to which nozzle rates we should use:
- Bottom-most nozzle was on and every second nozzle position skipped for a total of 5 nozzles active per side
- Top nozzle was TeeJet AITX8002, followed by TeeJet TXR80015, TXR80036, TXR80015, TXR80015
- 7 km/h (4.35 mph) travel speed per a speedometer app on a smartphone
- Tractor engine speed was 1,300 rpm (PTO was ~ 300 rpm)
- Fan set in low gear
- Pressure was 100 psi
- Ambient wind gusting to 4 km/h, temperature of 26.5°C, RH ~70%.
The following video shows the coverage from a single pass (to be clear, no extra upwind pass). We eventually did three passes to capture the cumulative coverage, just like with the first sprayer settings. This video simply serves to show how in ARM applications, the sprayer-facing side always looks much better than the side facing away. Also note how much quieter the sprayer is, as well as the reduced blow-through.
And here is the resultant, cumulative coverage from three passes. Once again, deposit density isn’t required as it exceeded our threshold in each position.
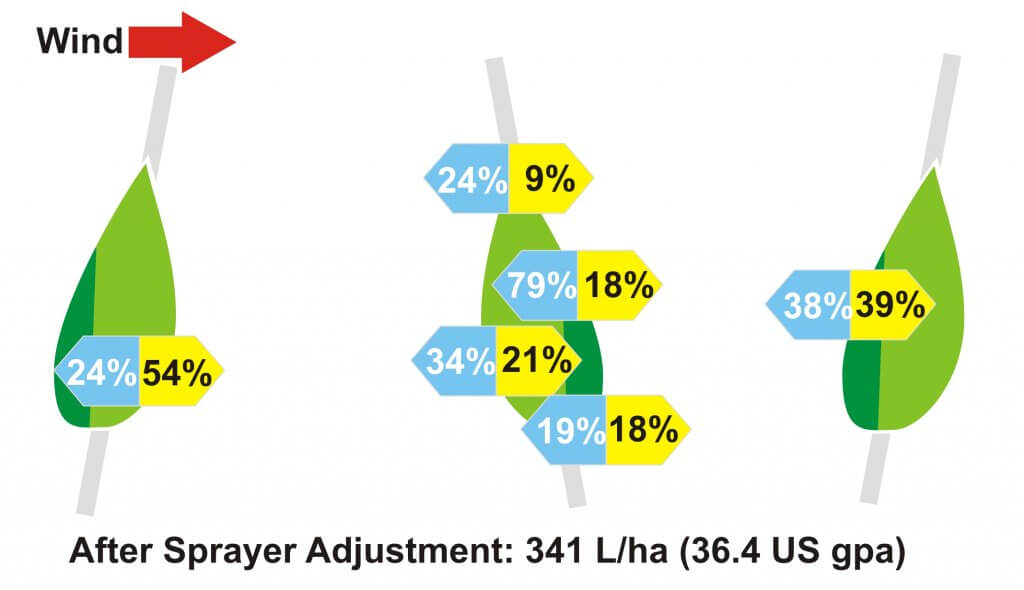
In the end analysis, we saved the grower ~30% of their spray mix, greatly reduced noise and spray drift, and still achieved suitable coverage in the target canopy. So, does this mean ARM applications are redeemed? We refer you, kind reader, to our introduction where we said ARM can work in young plantings and early season applications.
Note that the upwind side of the canopy received less coverage than the downwind side. As this new planting grows and fills, it’s going to be increasingly difficult to achieve sufficient coverage. Changes to the sprayer settings may be able to account for the imbalance, but they will also make the applications less efficient (i.e. more spray mix, more drift and coverage will still not be uniform). It remains to be seen if the spray inefficiency inherent to this orchard architecture is worth the estimated 35% savings in labour costs.
It’s an economic decision. We’ll see.