For those on the fly, hit play to hear a shortened, narrated version.
I have far too many photos and videos of airblast sprayers blowing straight up through treetops, or downwind through the last row, during spring applications. I chose not to include any in this article to avoid people recognizing the operations. If you haven’t seen anyone doing it, maybe it’s you!
I recognize that it can be a tricky balance to adjust a sprayer for spring applications. It’s counterintuitive, but a bare tree can be difficult to spray. Young and/or bare trees represent small targets which have a very low catch efficiency, so a lot of spray will miss. Switching nozzles to adjust rates doesn’t help much in this regard – it’s far better to adjust travel speed and air settings, and we’ll get to that in a moment.
That lack of foliage also means wind moves through the orchard unabated, so the sprayer may have to blow a little harder into the wind to compensate. In the case of a low-profile axial sprayer, which blows laterally and upward, that means creating greater risk for blowing too high, and blowing through downwind rows.
That off-target deposition represents a huge loss of materials and potential for drift incidents. To add insult to injury, many of those early season applications often have oil components, which require a drench (higher volume) and are more easily seen by bystanders (opaque droplets). All in all, it’s a bad time of year for crop protection PR. Learn more about drift and drift prevention here: BeDriftAware.
Air Adjustments
So, let’s start with air. Air carries spray droplets, so perform a ribbon test to ensure the air outlets are oriented correctly. This is achieved by adjusting deflectors (e.g. low-profile axial), the air outlets on a tower, or the entire head on a wrap-around design with individual fan/nozzle combinations.
Spray height should always exceed the canopy height by a small degree. This compensates for the increase in wind speed with elevation, the potential loss of spray height with faster travel speeds, and uneven alleys that cause the sprayer to rock, which changes the spray angle.
It is less critical that spray align with the lower portion of the canopy. As air energy wanes, or as droplets begin to lose momentum, finer droplets will slowly fall, depositing on random surfaces. Coarser droplets will quickly fall towards the bottom of the canopy, settling primarily on upward-facing surfaces. This secondary deposition can also occur from the cumulative impact of blow-through from upwind rows.
Nozzle Adjustments
Now pay particular attention to which nozzles are on or off. Park the sprayer in an alley. Stand behind the sprayer and extrapolate a direct line from each nozzle to target canopy. Nozzles that point at the canopy should be left on. Nozzles that point above or below can be blocked, or turned off, via valves or rotating roll-overs.
Some roll-over nozzle bodies can be swiveled up or down 15 degrees to fine tune the spray angle. An alternative would be to permanently rotate the nozzle body fitting in the boom line. When aiming nozzles using a roll-over nozzle body, be careful not to swivel them too far or the valve will partially close and compromise the spray pattern.
When extrapolating, remember that the centre of a nozzle only indicates the centre of the spray pattern. Cone and fan angles can span 60 to 110 degrees, depending on the influence of air. Therefore, even though the centre of the lower-most nozzle intersects the bottom of the target canopy, you may still be able to turn it off because the nozzle above has that portion covered.
Travel Speed, Wind, and Coverage Assessment
Now let’s consider travel speed. If the wind is blowing hard through the orchard, you can increase the air speed or slow down the sprayer to focus longer. However, in both cases, you run the risk of overblowing the downwind rows by a considerable margin. Easily three rows in a high-density orchard.
This downwind coverage is cumulative, so when you assess your coverage (preferably using water sensitive paper), don’t do so until you’ve made a few upwind passes. So much of that spray ends up on the orchard floor, and still more evaporates or blows up, but some of it will hit and it adds up.
Downwind Boundary
Finally, pay attention to where you are in the block. It may be necessary to turn off the downwind bank of nozzles on the final downwind three (or more) rows. That means you’ll be performing the dreaded alternate row (one-sided) application, and I’ll be the first to say that’s not ideal. However, in this case, the spray will blow back and help cover the unsprayed side. Again, use water sensitive paper to confirm the job you’re doing.
Final Thoughts
And, of course, seriously consider when it’s time to wait for better conditions. No one likes to do that, especially when rain is imminent and the ground stays soft, but the alternative is a lot of waste and a poor application. If this always seems to be the fight you’re having, maybe it’s time to consider the return on investment of a tower sprayer, or a shrouded sprayer. Towers improve matters since they more easily reach the treetop without having to blow as hard, and without angling air upward. Shrouded recycling-style sprayers (if they fit the architecture) help even more.
Plan to do all of this (especially the capital investment number crunching) before the season starts and be prepared to change sprayer settings on the fly, as required. Don’t be the subject of my next spring drift photo.
Any description of airblast sprayer start-up must, contextually, make assumptions on how it was winterized for long-term storage. This cyclic relationship is why I use a chicken-and-egg title slide when giving this presentation.
Answer: It was the rooster.
The inability to describe one process without the other is further complicated by the possibility that the sprayer is brand new and was therefore never winterized. So, what follows is an attempt at a logical sequence of pre-season maintenance activities to restore a winterized sprayer, or initiate a new sprayer.
New Equipment
If this is a new sprayer, you have an opportunity to perform some preventative maintenance.
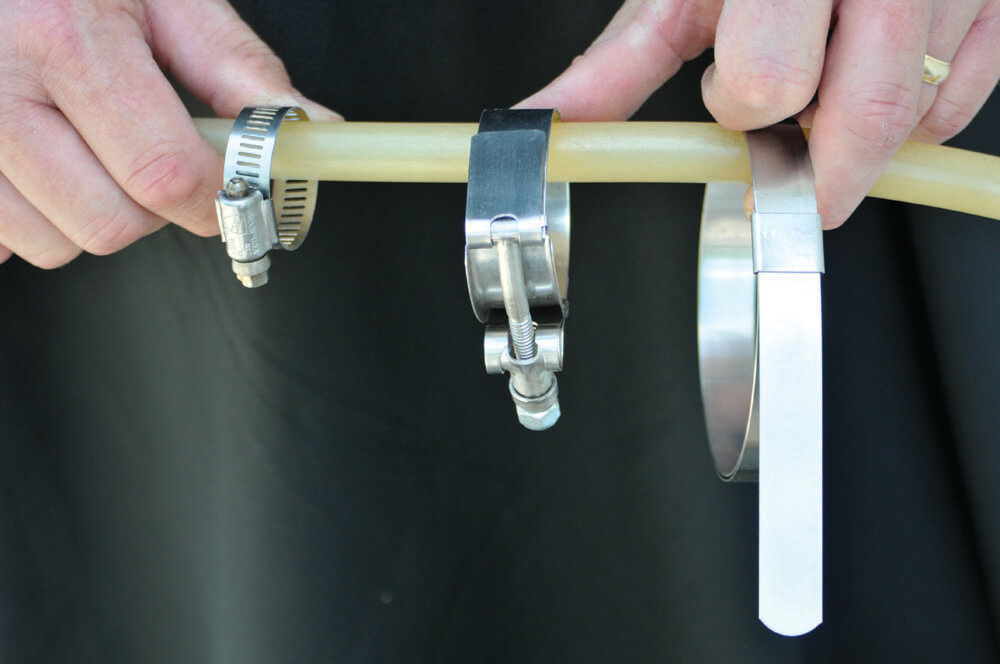
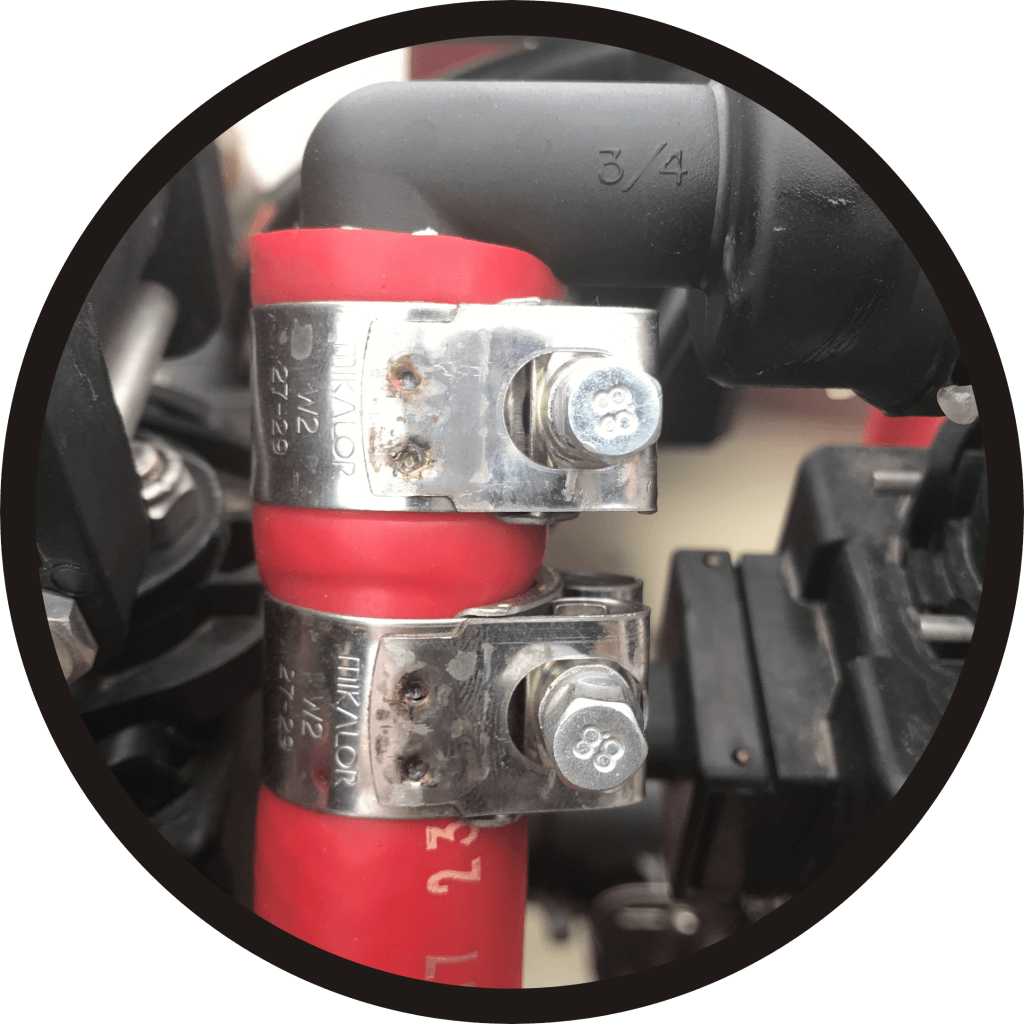
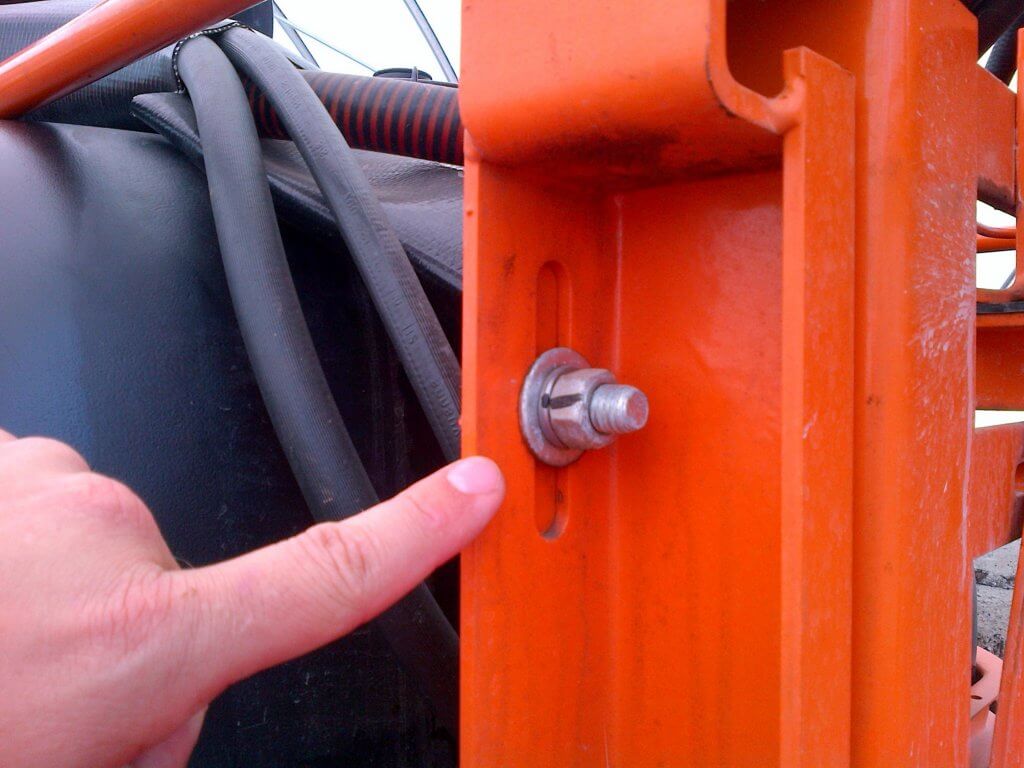
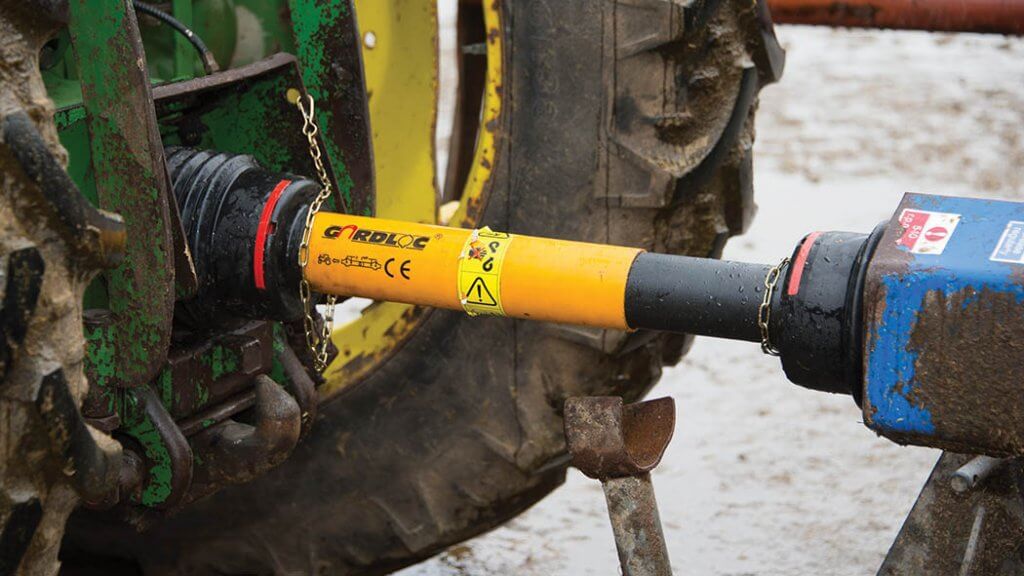
Loosen, lubricate and re-tighten clamps. Always back gears off before tightening to avoid stretching them. (Image from Purdue Extension publication PPP-121: Preparing Spray Equipment for Winter Storage and Spring Startup)Use double clamps on pressurized lines for added safety. Wider clamps are better and T-bolt clamps are better than worm-gear.Put thread release on bolts and re-tighten with a torque wrench (not an impact tool). Use a paint pen to mark nut, washer and bolt for future visual checks. This is called a “Witness Mark”.Protect hoses and wires at rub points. Follow hoses and with a paint pen, number the hose-ends and connections for future reference.Using a new tractor? You may have to re-calibrate to account for different gear ratios. When hitching a new sprayer, note that the distance from the ball on the drawbar hitch to the tip of the PTO should be ~14″. Don’t exceed maximum working angles for PTO shafts (usually <25 degrees). If your tractor or implement manufacturer says differently, go with that. And get it in writing.
Winterizing (Long-term storage)
If you are preparing the sprayer for long-term storage, follow the normal rinsing process, but don’t reinstall strainers and nozzles.
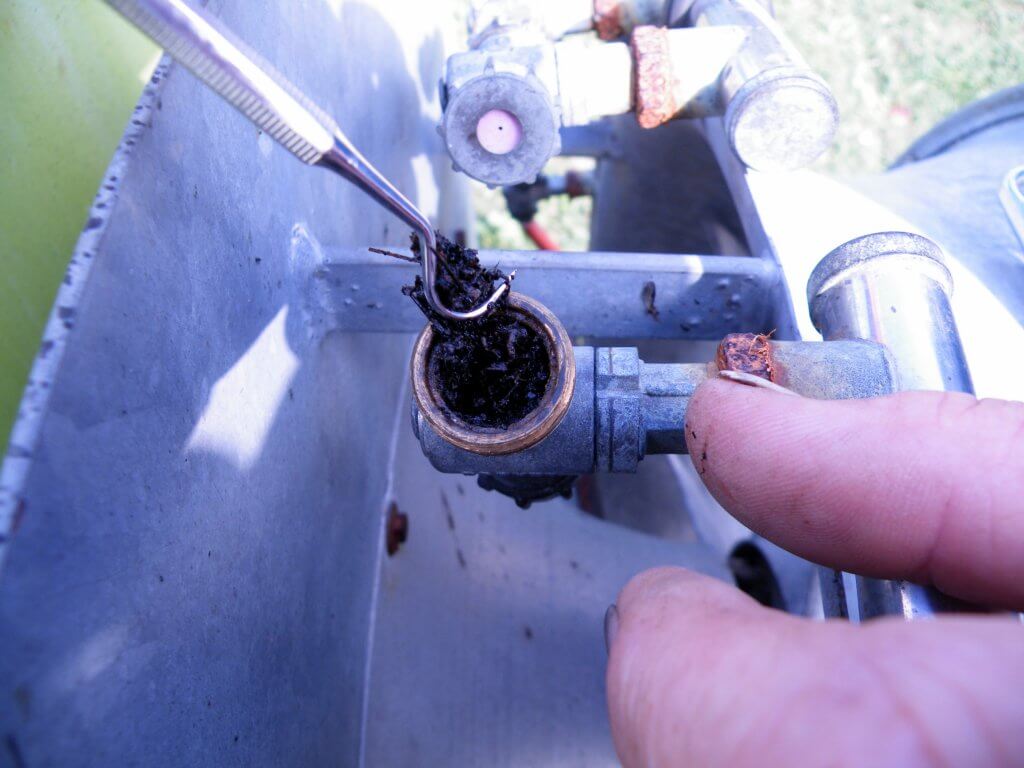
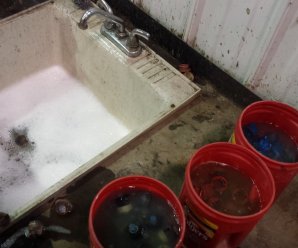
Look in the nozzle bodies for debris. Discard worn or broken nozzles.Soak, scrub, rinse and store nozzles and nozzle strainers. You may replace them once the sprayer is clean, but I prefer to store them separately since they have to come back off during start-up.
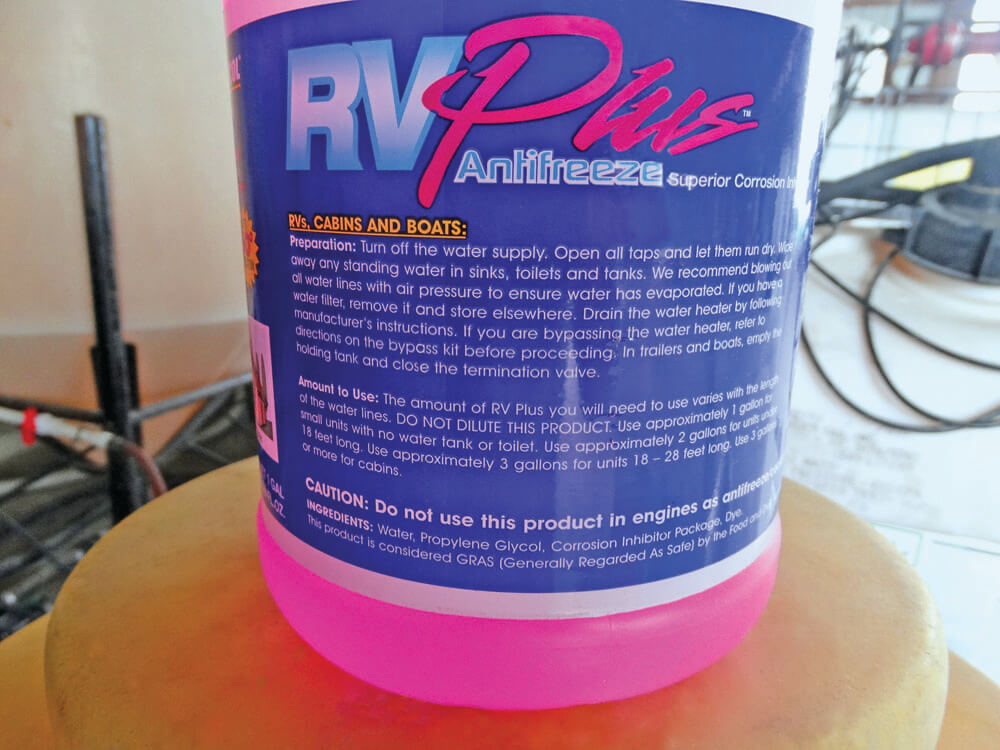
With the agitation on, circulate undiluted plumbing antifreeze (the sprayer already has 5-10 L (1.25-2.5 gallons) of water in the system from the decontamination process) for five minutes and drain it through the plumbing system (not the booms).
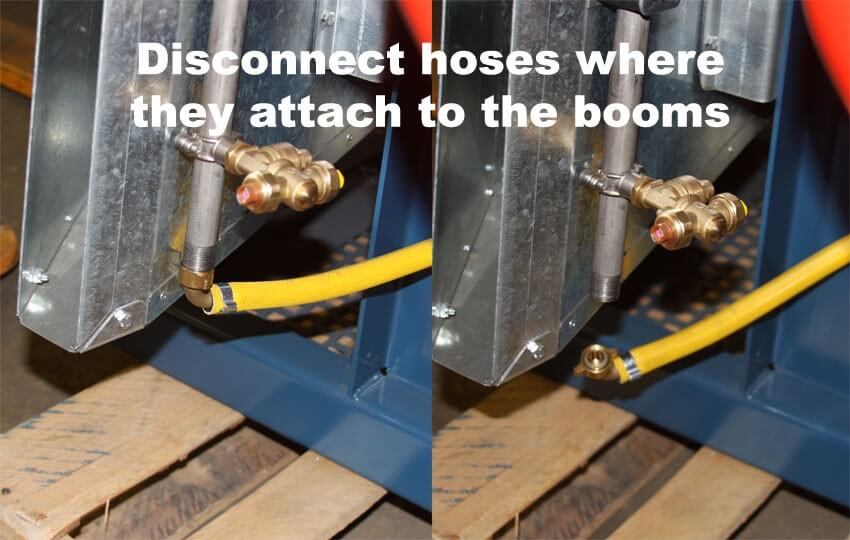
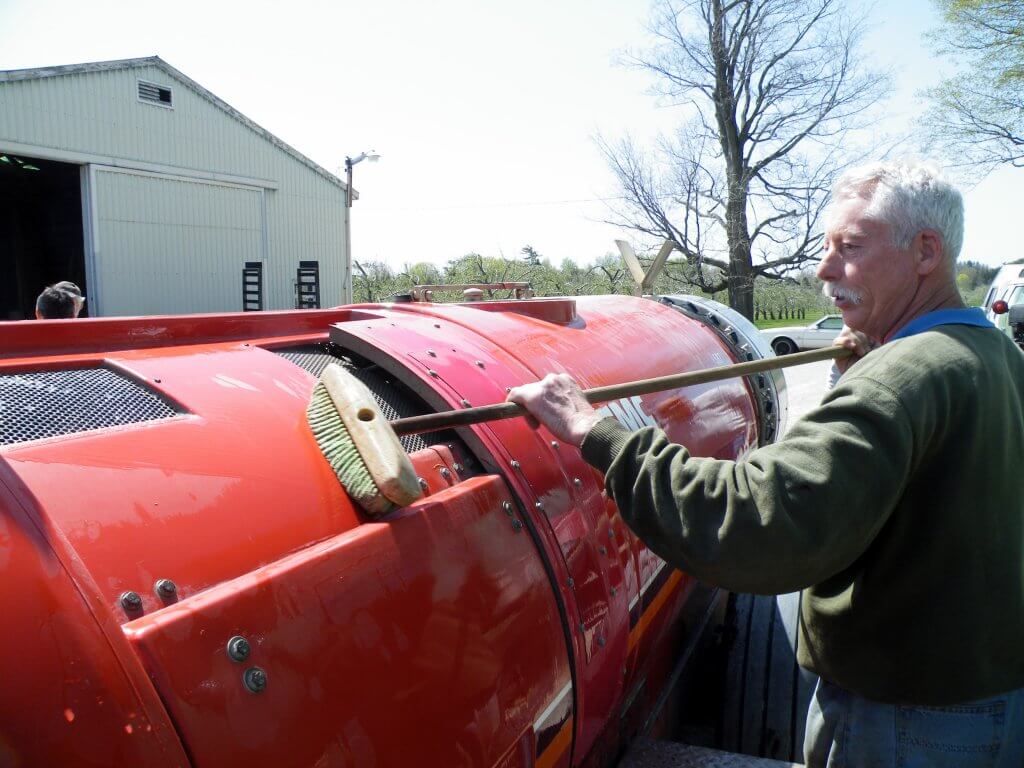
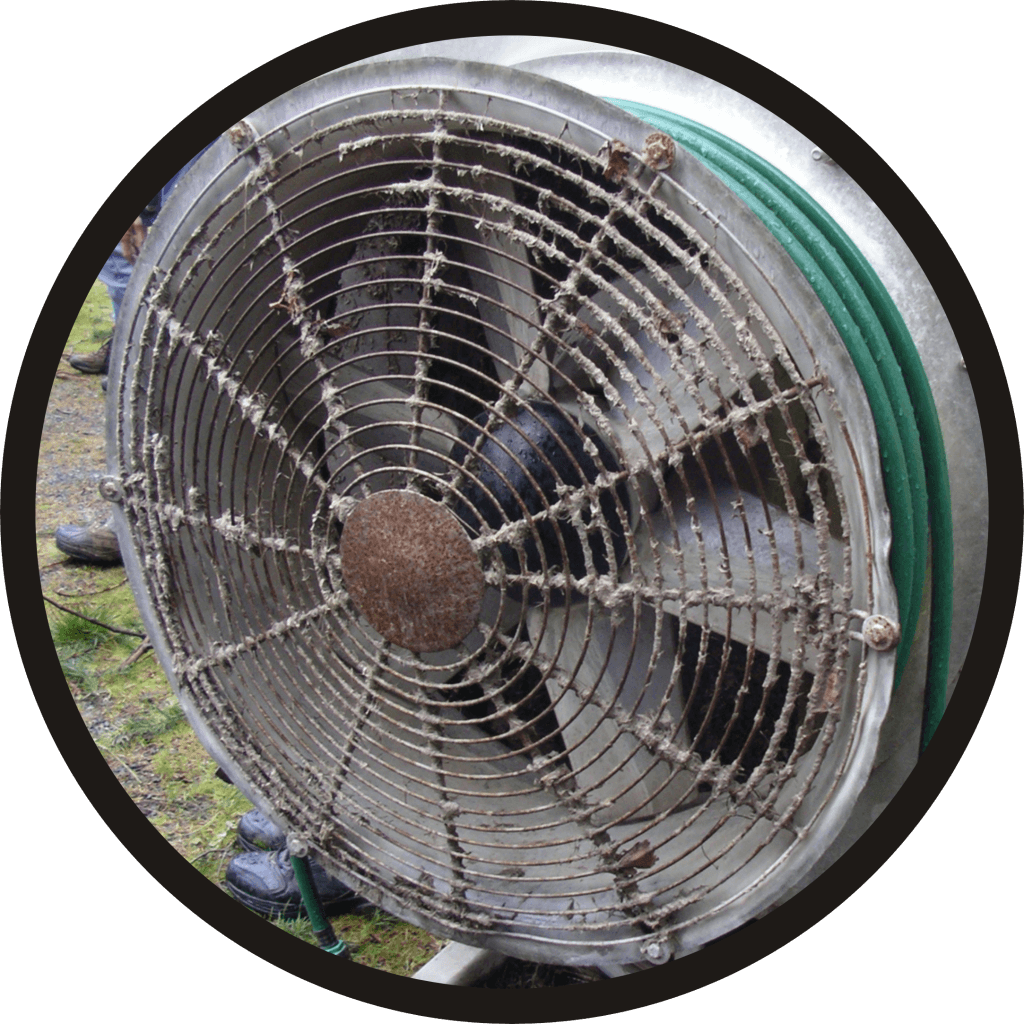
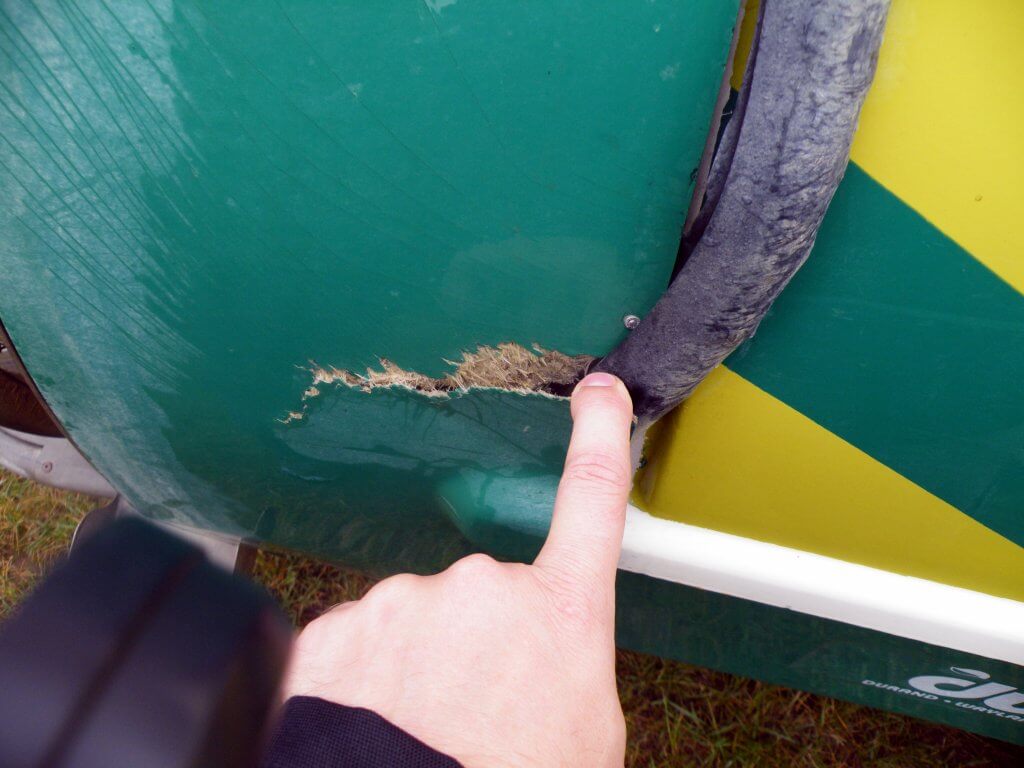
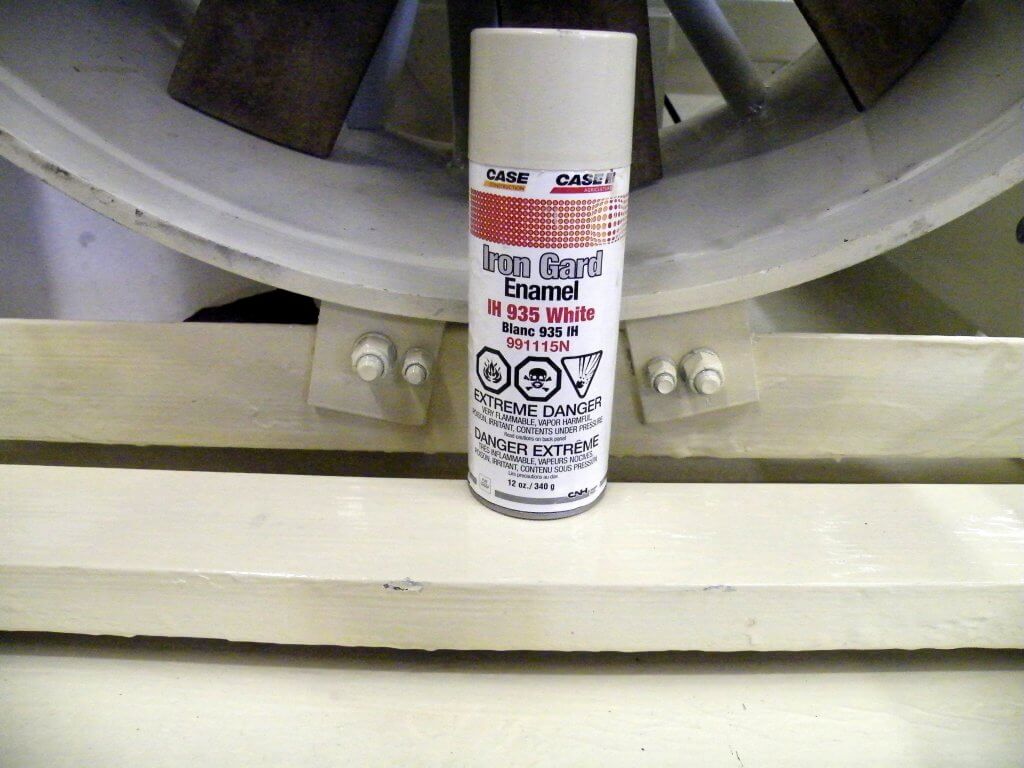
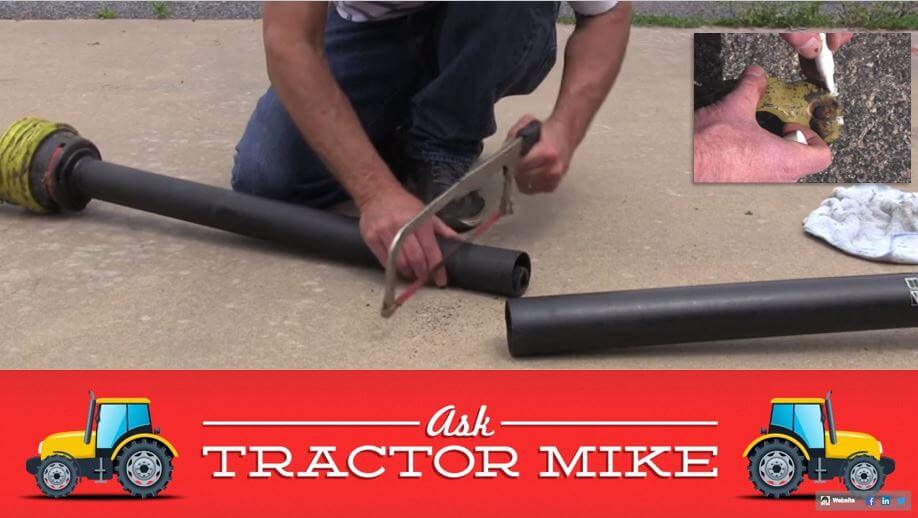
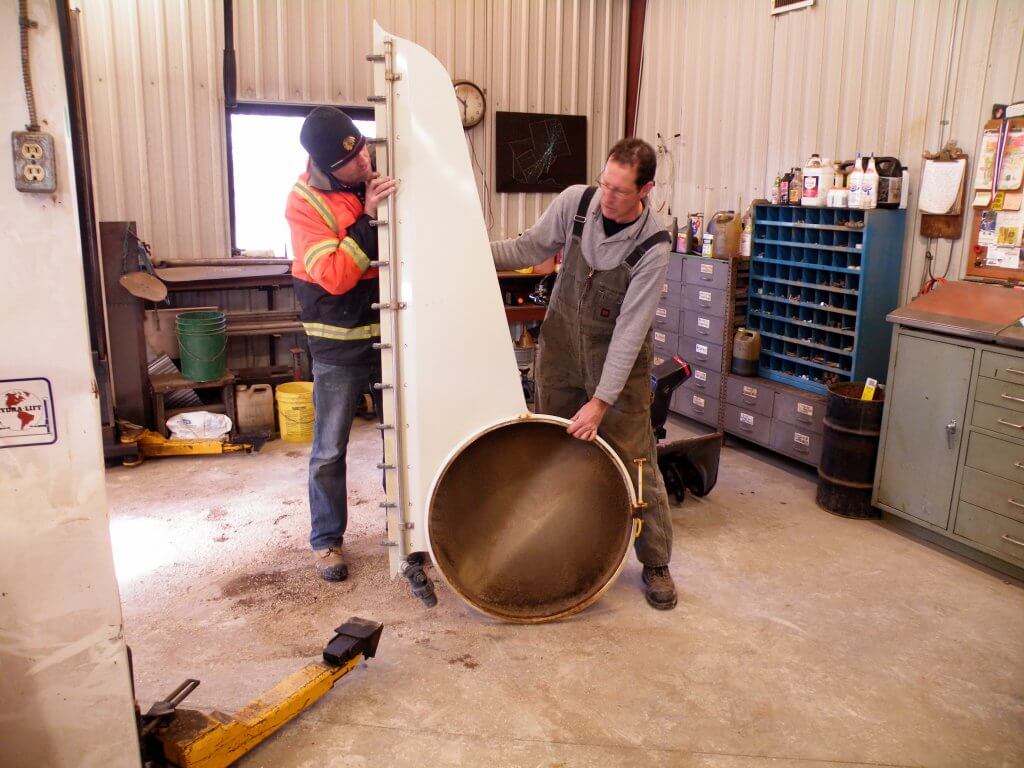
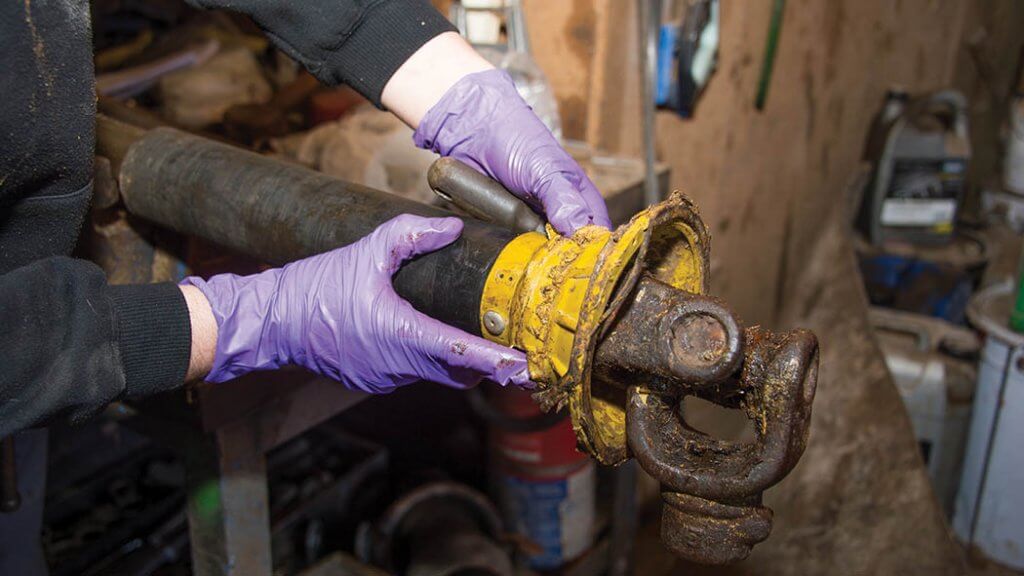
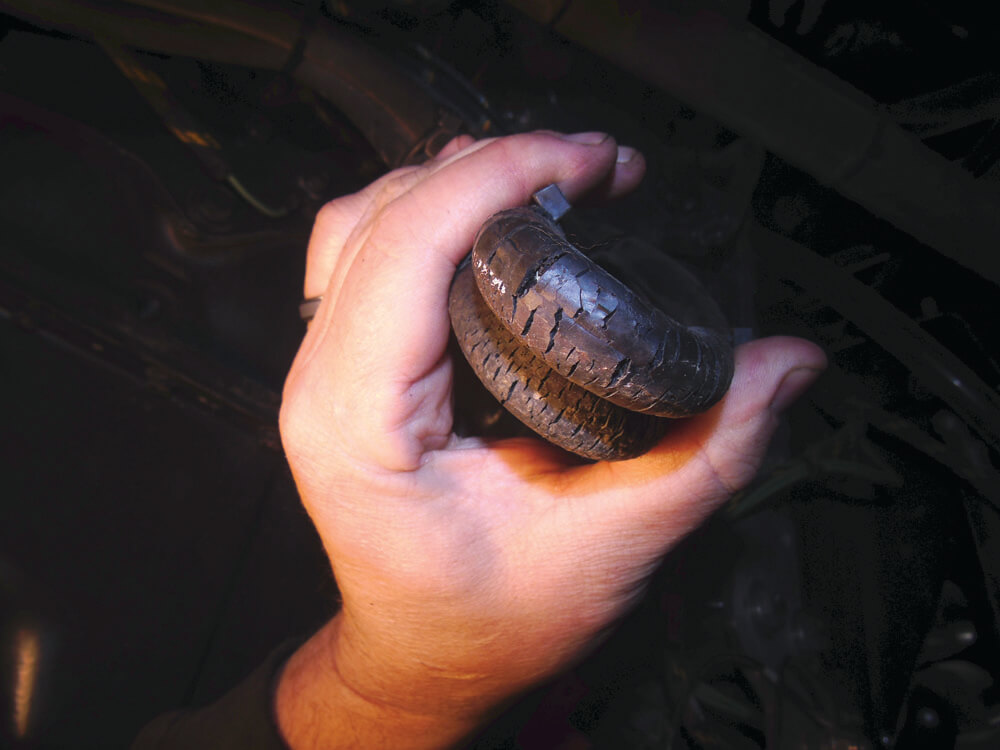
Disconnect hoses where they attach to the booms and drain as much liquid from the sprayer as possible. (Image from Munckhof Sprayers). Take the time to examine any hose fittings.Clean the sprayer (Triple rinse with a detergent) and scrub the exterior. Do not use pressure washers on bearings, fittings, pumps or any lubricated or moving parts.Examine fan blades for cracks, build-up or nicks that can cause imbalance. Replace (not just repair) punctured entrance grills.Don’t ignore tank damage. Poly tanks are prone to sun damage and cracks. Never climb into a tank to repair it. Quite often, replacement is the best option.Clean and inspect wheel assemblies. It’s best to do this during winterization to prevent bearing corrosion as the sprayer sits all winter.Remove any rust and repaint (or just touch up). Paint not only looks good, it protects.The excellent YouTube channel Ask Tractor Mike proposed storing the PTO shaft indoors in two pieces, and to cut away a portion of the interior guard to facilitate reassembly later on. Also, use a paint pen to mark the splines on the shaft for easier hook-up (see inset top-right of image).RV antifreeze is a 50% solution of antifreeze and water with a rust inhibitor. It should not cause phytotoxicity if sprayed or dumped, but be sure to dispose of it away from water sources during start-up. Turn the pump manually to get antifreeze throughout the system. Close the nozzle bodies, loosely fit the tank lid and store indoors. (Image from Purdue Extension publication PPP-121: Preparing Spray Equipment for Winter Storage and Spring Startup).
Spring Start-up
Most operators are guilty of neglecting their airblast sprayers and babying their tractors. Sprayers are precision tools that must be kept in good operating order to prevent costly breakdowns, improve their performance, and increase their lifespan.
Your car is serviced based on distance travelled. Your sprayer should receive regular maintenance based on working hours, per the manufacturer’s recommendations. Daily sprayer inspections are part of regular maintenance since the operator will (hopefully) find small problems before they become big problems.
Never assume your sprayers is ready to go right out of long-term storage. Parts seize, scale breaks away from surfaces, and small beasties sometimes choose to eat, or make their homes in, cozy sprayers.
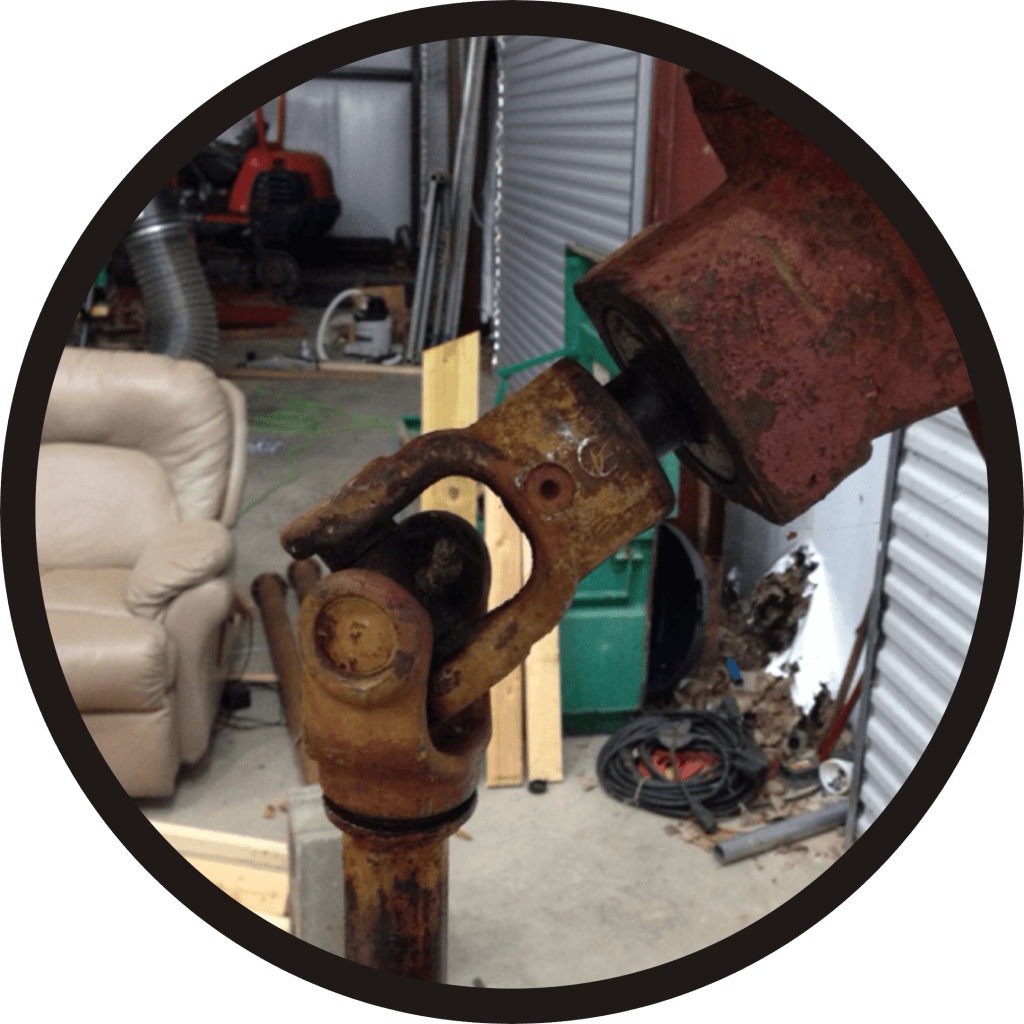
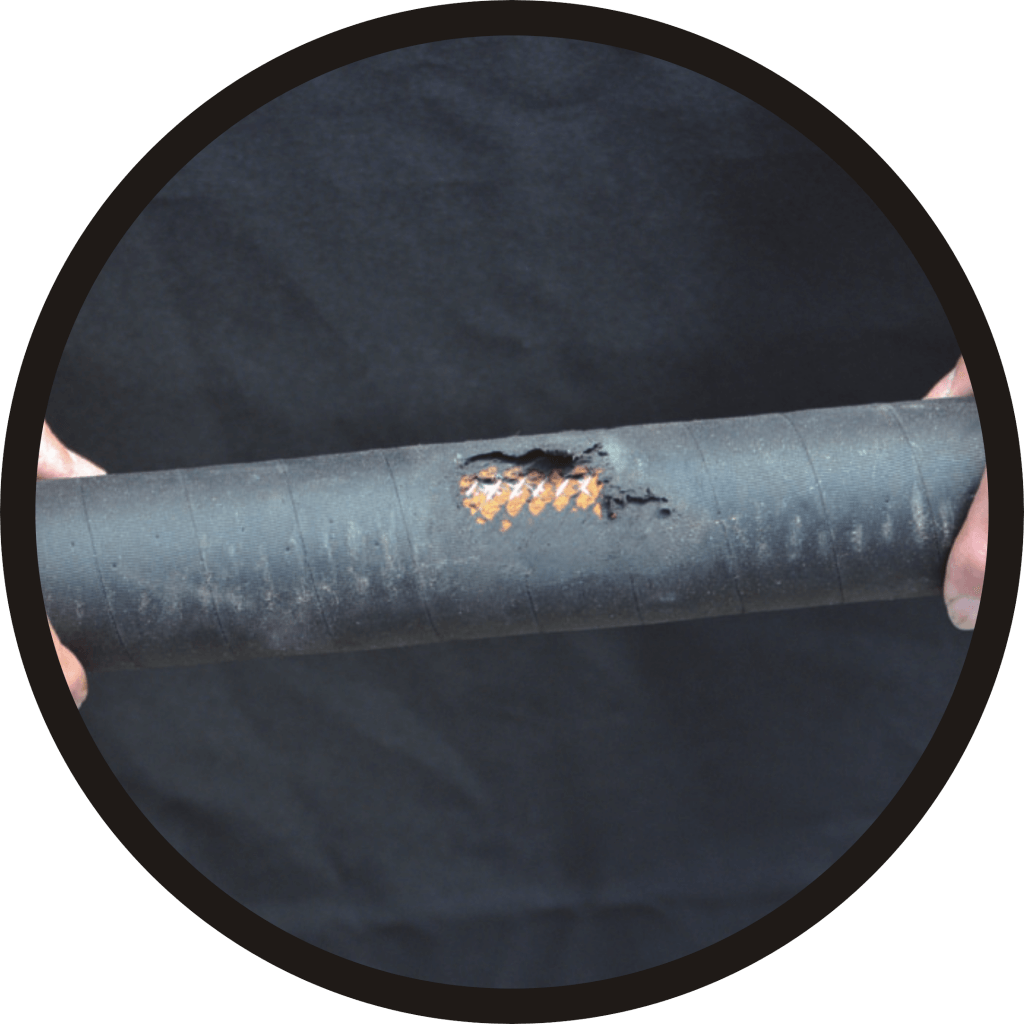
When planning spring start-up, never assume the winterized sprayer is ready for immediate hook-up. Expect a minimum half day per sprayer.Attempting to loosen or shift something that hasn’t moved in several months is risky. Pressure gauges snap off, fittings crack, welds break. Expect the unexpected and either have spare parts on hand, or a plan to get them quickly.Parts are most likely to seize during the first spray. Bearings and PTO universal joints, especially.Start-up is a good time to lubricate parts. Grease the guard ring bearing every 100 hours, the universal joint cross every 25 hours and the shaft and shear bolt regularly.Insects, birds and rodents eat, or make homes in, sprayers. Professional rodent bait/traps, steel wool and peppermint oil/gel are possible solutions.Check belt tension, alignment and wear. (Image from Purdue Extension publication PPP-121: Preparing Spray Equipment for Winter Storage and Spring Startup).
Pump specific maintenance is beyond the scope of this article. Hypro recommends changing oil after 40 hours of break-in operation and every 500 hours after that. The diaphragms should be replaced every 1,000 hours. Generally speaking, EPDM (black) diaphragms are a better choice for airblast sprayers, while the Desmopan (amber) diaphragms are really for lawn care sprayers.
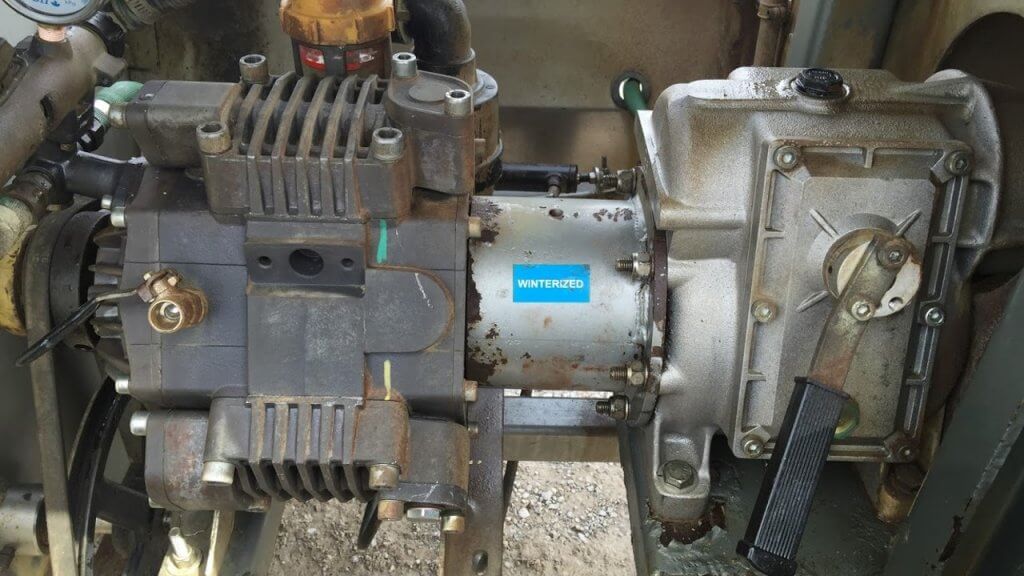
Pump maintenance is beyond this article, but change the oil every 500 hr or 3 months. Use a paint pen to write on the pump what type of oil it requires, and then date the filters. Note the “winterized” sticker.
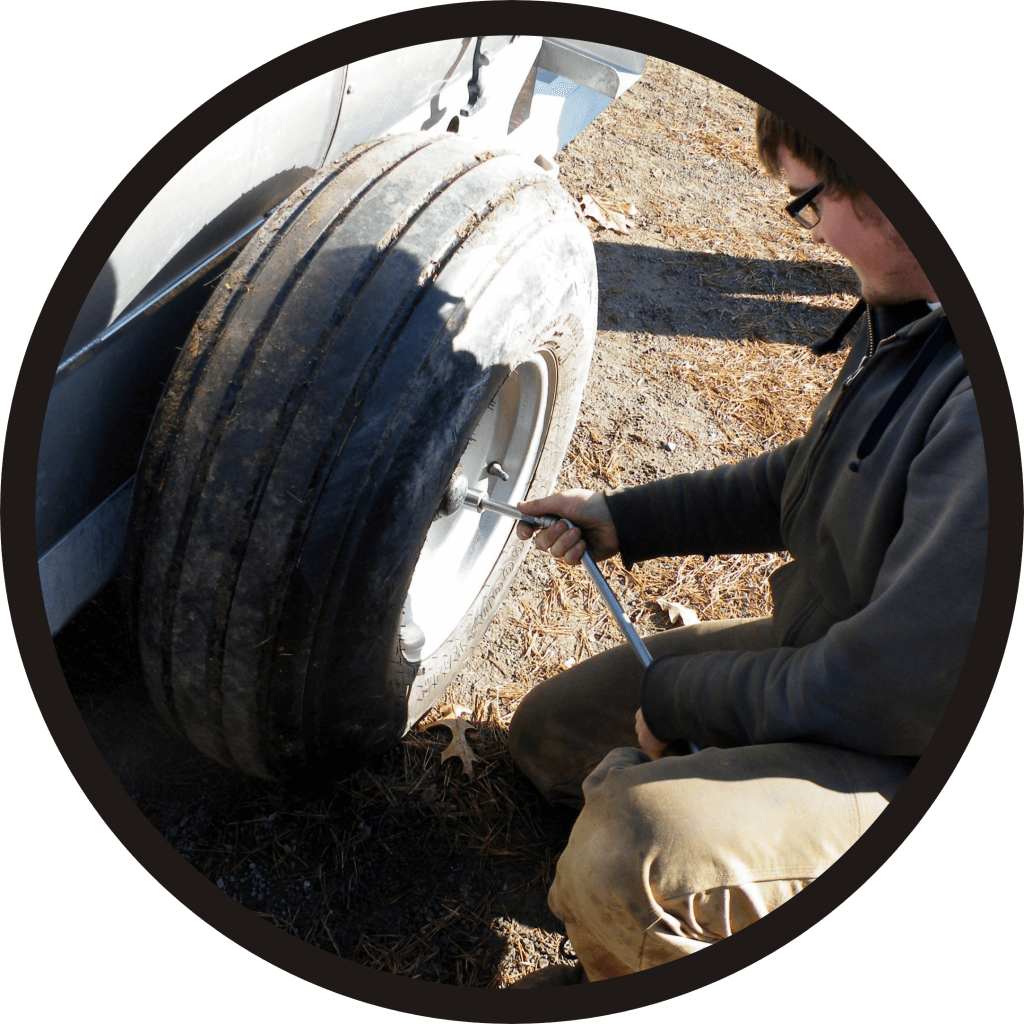
At minimum, check the tire pressure. Hard tires drive faster, but leave compacted ruts. Soft tires drive slower, but disperse weight better. Airblast sprayer wheel assemblies should be cleaned and inspected as part of regular annual maintenance. Wheel bearing maintenance before long-term storage may prevent water from corroding the bearings.
Ensure tire pressure matches the ideal stamped on the tire. Or, if using less pressure to avoid spring soil compaction, ensure both tires have the same pressure.
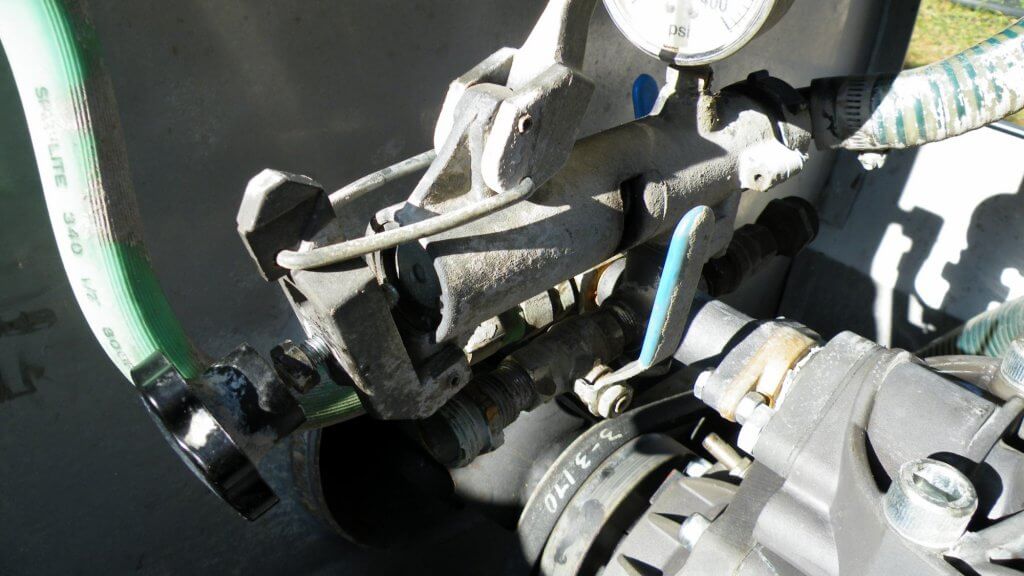
The relief valve on your sprayer should always be in the bypass position during start-up. If your gauge spikes then the gauge may always read high afterwards and should be replaced.
A reminder to always set the relief valve to the bypass position when starting up the sprayer. This is one reason why pressure gauges spike and can eventually fail.
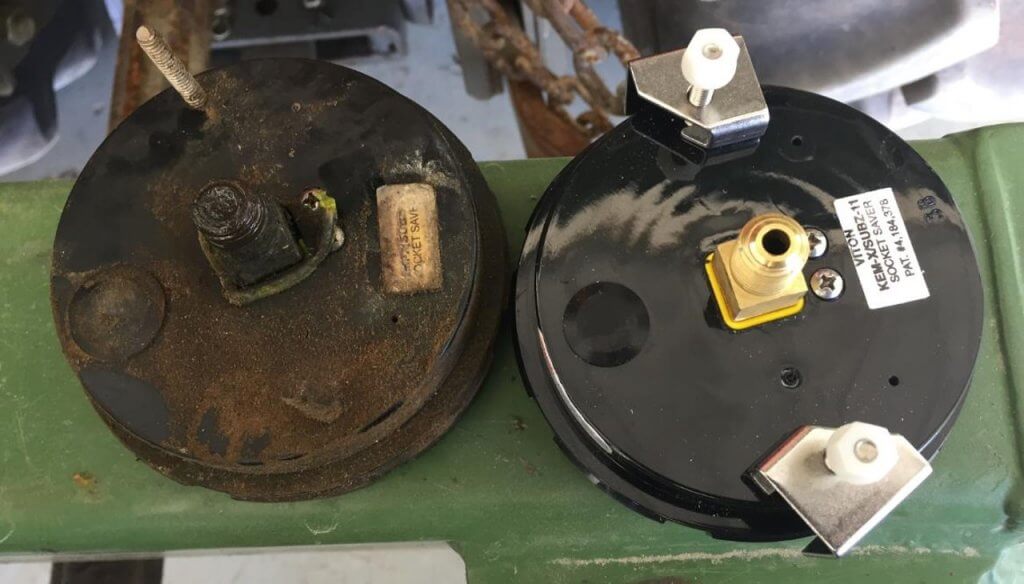
Replacing leaking, opaque or inaccurate gauges improves sprayer performance. Be sure to use the oil-filled variety of gauge to eliminate a bouncing needle. You can also get suppressors that fit between the gauge and sprayer to prevent pulsing. Consult the article on testing airblast pressure gauge reliability.
Use a wrench to turn gauges at the nut. Don’t twist them by hand holding the face. Ensure they are not opaque, leaking, plugged or resting above the zero pin.
Many spray materials do not mix well and one of the common causes of uneven application is poor agitation. If you find deposits at the sump in the bottom of the sprayer after an application, your agitation is insufficient. For mechanical agitators, check for propeller wear and ensure paddles are secure on the agitator shaft. Learn more about agitation here.
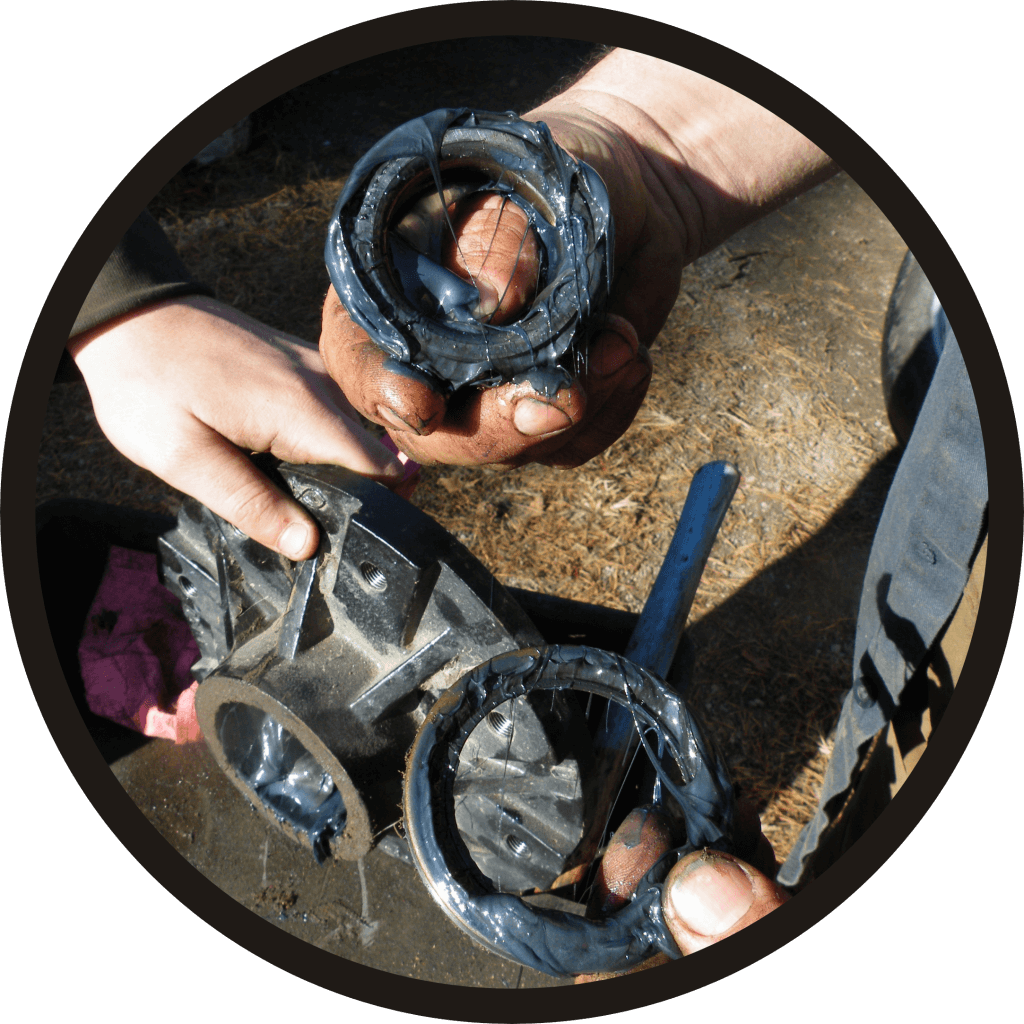
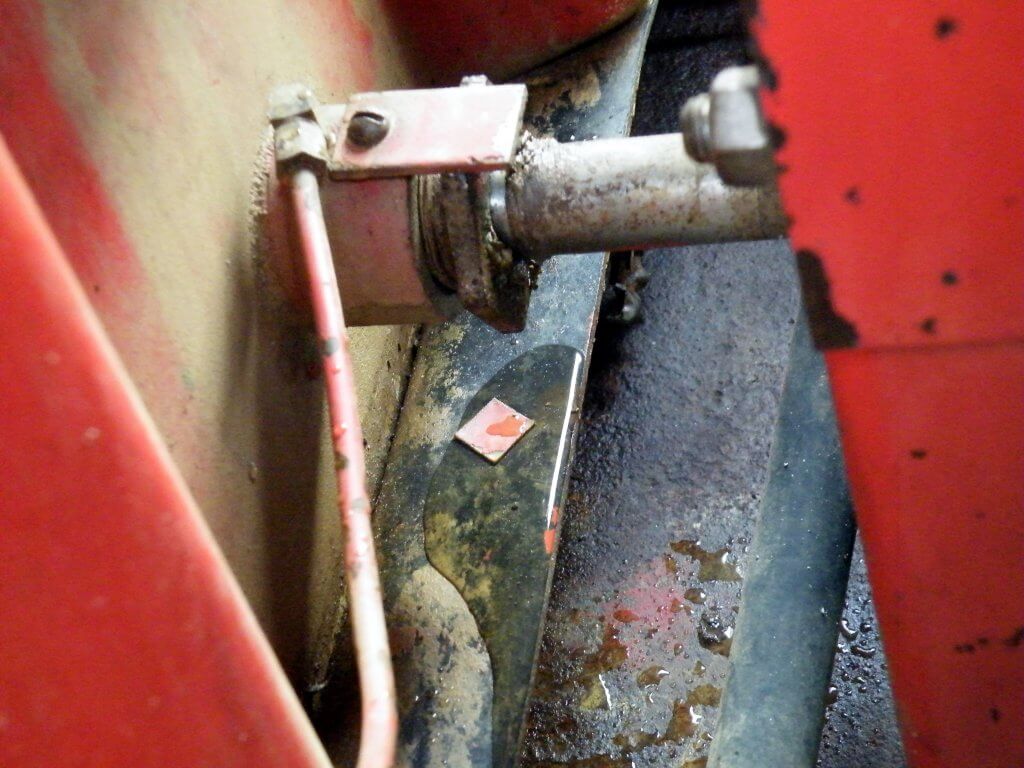
If the agitator shaft is leaking a little, tighten the packing. The packing gland is a common source of leaks. Keep it properly greased. If a leak occurs you can usually repair it by tightening the bolts on the packing gland by ½ a turn, but if that doesn’t work you may have to remove and repack (or replace) it.
On sprayers with mechanical agitators, look for prop wear and loose or damaged paddles. Fill the sprayer with water and looks for tank leaks. Tighten the bolts 1/2 turn if the packing gland on the agitator shaft is leaking. You may have to remove and repack the gland if the leak persists.Look for signs of hose wear and examine the sprayer for leaks while under pressure. Be careful when pressurizing the sprayer for the first time in the spring; this is when lines are likely to come loose or burst. (Image from Purdue Extension publication PPP-121: Preparing Spray Equipment for Winter Storage and Spring Startup).Minerals chelate (i.e. scale) more readily on stainless steel than plastic tanks. In either case, the first tank of water and leftover antifreeze should be sprayed from the nozzle bodies with no line or nozzle strainers, and no nozzles. Replace them once the tank is sprayed out.
The last step is calibrating the sprayer, and that process really depends on your definition. If the preceding steps conflict with those of the manufacturer’s, always follow the manufacturer’s. Do this for reasons of safety and to preserve any warranty.
Thanks to Fred Whitford (Purdue University), Gail Amos and Mark Ledebuhr (Application Insight LLC) for reviewing the content of this article and for their helpful edits.
Airblast sprayer operators must know their average travel speed to calculate how much pesticide and time is required to complete a spray job. Note that it’s an average, not a constant, because travel speed is significantly affected by ground surface conditions (e.g. slippage), grade (e.g. hills) and the weight of the rig (e.g. as spray mix is depleted).
The pursuit of productivity and the unchallenged status quo of traditional spray volumes, blinds many operators to the fact that travel speed is a critical factor in focusing air energy on the target canopy. As long as droplets are small enough to be entrained and directed by the air, we believe that optimizing the fit between air energy and the target canopy leads to the most frugal and effective use of spray mix and should therefore dictate travel speed. If that speed proves to be painfully slow, or terrifyingly fast, then a mismatch is revealed between the sprayer design and the operational conditions and the overall spraying strategy should be reconsidered.
This article describes a method for modelling an ideal travel speed. It can be used as a sanity check for existing operations or for those seeking to evaluate the fit of a new airblast sprayer. However, this method can only approximate travel speed. A true optimization of sprayer settings will require fine tuning using the ribbon method and, ultimately, coverage feedback from water sensitive paper (see here and an older article here). We’ll begin with how to measure average travel speed.
How to measure average travel speed
Beware the tractor speedometer or rate controller that monitors wheel rotations; both can be fooled by changes in wheel size, tire wear or slippage. GPS or radar-based speed sensors are the most accurate method.
Those that prefer a manual method can follow this classic protocol for determining average travel speed:
Go to a row that is representative of the terrain in your planting. Measure out a distance of 50 m (150 ft) and mark the start and finish positions with wire marker flags.
Fill the sprayer tank half full of water.
Select the gear and engine speed in which you intend to spray. If using a pull-behind sprayer, ensure the PTO is running or you could introduce errors.
Bring the sprayer up to speed for a running start and begin timing as the front wheel passes the first flag. This is far easier when there are two people.
Stop the timer as the front wheel passes the second flag.
Stay out of any ruts and run the course two more times.
Determine the average drive time for the three runs (i.e. the sum of all three times in seconds divided by three).
Finally, calculate travel speed using one of the following formulae, depending on preferred units:
Ground Speed (km/h) = Average drive time for 50 m (s) ÷ 13.9 (a constant)
Those that prefer a less accurate but convenient hack can download any smartphone speedometer app that can calculate an average (similar to a runner’s GPS wristwatch). Fill the sprayer tank half full and drive a representative section of your operation with the fan on and the spray off. Consult the phone for your average speed for each pass. Take a screen shot and email it to yourself as a time-stamped component of your spray records.
The “Air Displacements” method
Dwell time
Airblast sprayers use fans to move a volume of air at a certain speed, often measured in m3/hr or ft3/min. Imagine that volume of air as a three dimensional shape extending from the air outlet over a distance. Likewise, imagine the void between the sprayer outlet and the target canopy as a three dimensional shape penetrating roughly halfway into that canopy (assuming we intend to spray every row).
How long must the sprayer dwell in one spot before it pushes all the intervening air out of the way and replaces it with spray-laden air? If the sprayer drives too slowly, it will wastefully push spray through and beyond the target (i.e. blow-through). If the sprayer moves too quickly, the spray will not have an opportunity to penetrate the target canopy and most certainly not reach the highest point. This concept of focusing air energy using travel speed is called Dwell Time.
We want to calculate the volume of air the sprayer generates, compare that to the volume we want displaced, and then determine how fast we must drive to optimize the fit. We can do all this with a tape measure, an anemometer, and a partner to record the data and do a little math.
1. Measure air outlet area
With the sprayer safely off, measure the area of the air outlet(s) on one side of the sprayer. We’ll use a Turbomist 30P Low Drift Tower (below) as an example. There are two air outlets that are 5 cm wide by 150 cm high for a total area of 0.075 m2 on each side. Be sure to look inside the outlet for any irregularities like baffles or obstructions intended to block air. Subtract those areas from the total. Don’t worry about small things like nozzle bodies.
For rectilinear outlets: Height (m) x width (m) = Area (m2)
For circular outlets: 3.14 x radius2 (m) = Area (m2)
The air outlet on this Turbomist 30P Low Drift tower sprayer is 5 cm wide by 150 cm tall for a total area of 0.075 m2.
2. Measure air speed
First, a few safety warnings: High speed air is loud and can carry debris, so always wear ear and eye protection and respect the hazards inherent to working with air-assist sprayers. Only use an anemometer rated for at least 160 km/h (100 mph) (e.g. here). Do not use a handheld weather meter such as a Kestrel because the impellor could be destroyed and become dangerous shrapnel.
Use an anemometer rated for at least 160 km/h (100 mph) (e.g. here). Do not use a handheld weather meter such as a Kestrel because the impellor could be destroyed and become dangerous shrapnel.
Bring the fan up to speed and holding the meter about 25 cm (10 in.) from the outlet, measure the air speed at several locations along the air outlet both vertically and horizontally. We calculate an average speed because many air outlets do not produce uniform air speed or volume along their outlets. For this example, we measured four locations along the air outlet on both sides of the sprayer and saw significant differences. We did this both in low and high gear (see table below).
High Gear
High Gear
Low Gear
Low Gear
Location Along Outlet
Left Side (m/s)
Right Side (m/s)
Left Side (m/s)
Right Side (m/s)
Top 1/4
41.1
80.3
42.9
24.6
Upper
34.9
32.2
26.4
30.8
Lower
30.8
30.0
24.0
26.4
Bottom 1/4
33.5
40.2
26.8
31.3
Average
35.1
45.7
30.0
28.3
Anemometer readings from the low drift tower sprayer outlets, on left and right side, in high and low fan gear. Four readings from bottom to top to determine the average. Readings taken 25 cm from edge of outlet and PTO set to 540 rpm.
Multiple air outlets
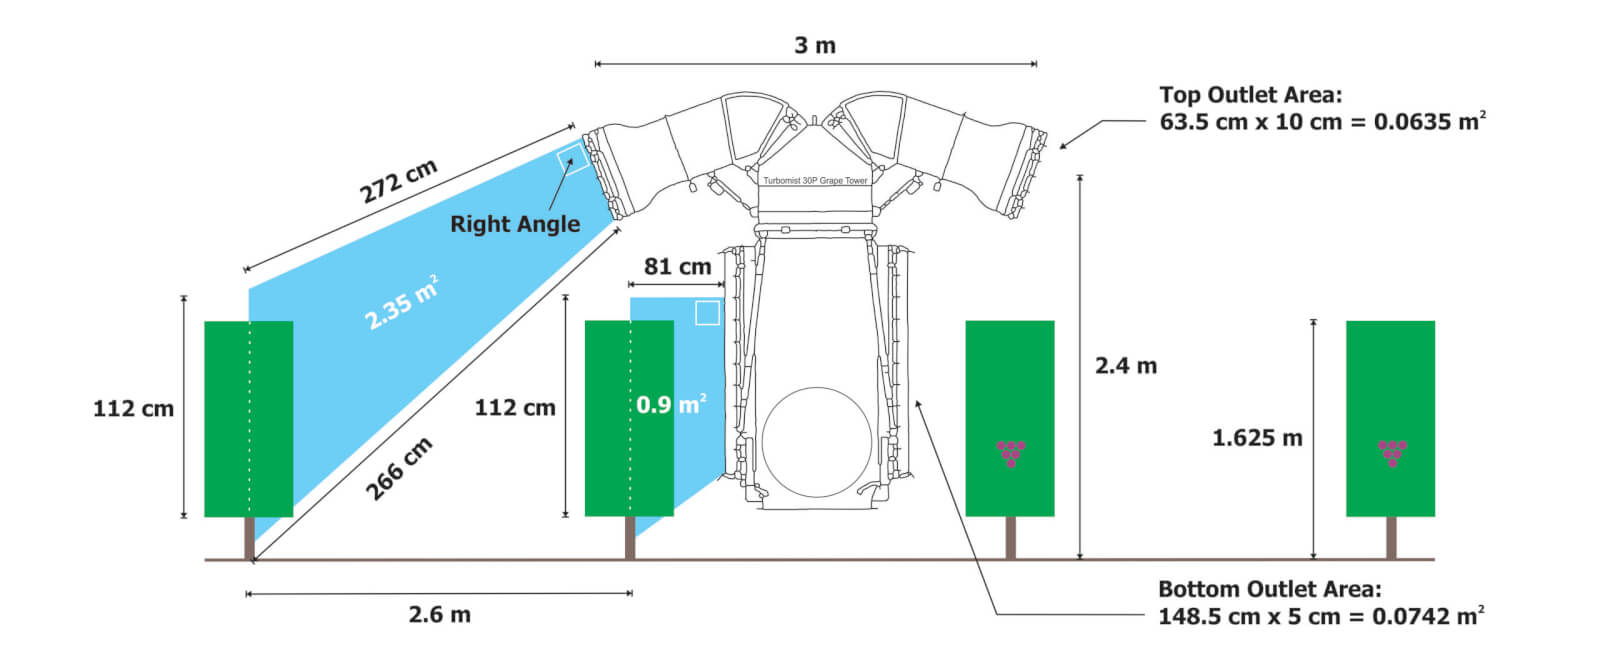
Before we continue with the method, let’s change sprayers to this Turbomist 30P Grape Tower (below). The design is intended to spray adjacent rows from the vertical outlets (5 cm x 150 cm = 0.075 m2) along the tower. The upper, inverted outlets (10 cm x 63.5 cm = 0.0635m2) throw spray over the adjacent rows and cover the outside rows. The intention is to improve productivity by covering four rows of grape (or possibly three) per pass.
The Turbomist 30P Grape Tower Sprayer is a multirow system intended to drive every third or fourth row.Lower, vertical ducts are 5 cm x 150 cm = 0.075 m2Upper, inverted ducts are 10 cm x 63.5 cm = 0.0635m2
However, when we consider this design through the Air Displacement lens, it’s almost like having two sprayers performing two jobs simultaneously. The vertical outlets and the upper, inverted outlets are different shapes. Further, their position (distance and angle, as the top outlets are angled back more aggressively) relative to their respective target canopies are significantly different. How fast must this sprayer drive to optimize the fit? Do we have to compromise coverage and incur drift and waste from one set of outlets to accommodate the other set? The manufacturer has worked to address this potential issue by partitioning the majority of the air energy to the top outlets, but let’s see how that affects travel speed.
3. Total volumetric flow
Having already measured the outlet area, we then measured average air speed (see table below).
High Gear
High Gear
Low Gear
Low Gear
Location Along Outlet
Left Side (m/s)
Right Side (m/s)
Left Side (m/s)
Right Side (m/s)
Top Outlet
27.0
26.5
27.0
26.0
Bottom Outlet
12.0
13.0
10.5
12.5
Average anemometer readings (n=4) for top and bottom outlets, on left and right side, in high and low fan gear. Readings taken 25 cm from edge of outlet and PTO set to 540 rpm.
Now we can use these two values to determine how much air the sprayer generates by calculating total volumetric flow. We first have to convert air speed from m/s to m/h to make the units work, so just multiply it by 3,600. Then we multiply that by the outlet area and we get the table below.
Average air speed (m/s) x 3,600 (a constant) = Average air speed (m/h)
Average air speed (m/h) x Outlet area (m2) = Total volumetric flow (m3/h)
High Gear
High Gear
Low Gear
Low Gear
Location Along Outlet
Left Side (m3/h)
Right Side (m3/h)
Left Side (m3/h)
Right Side (m3/h)
Top Outlet
6,172.0
6,058.0
6,172.0
5,944.0
Bottom Outlet
3,240.0
3,510.0
2,835.0
3,375.0
Total volumetric flow for top and bottom outlets, on left and right side, in high and low fan gear, with PTO at 540 rpm.
4. Target volume to displace
Now that we know the volume of air the sprayer generates, let’s determine the volume of air we need to replace with that spray laden air. This is really the only tricky bit because you have to picture a cross section and then measure the shape. See the illustration below.
For the bottom outlet, it’s simple. The outlet is 81 cm from the grape panel and the grape panel is 112 cm high. We calculate the area of a rectangle by multiplying length by width, so:
Length (cm) x Width (cm) = Area (cm2)
However, the sprayer design makes the top outlet’s job trickier to figure out. This isn’t a rectangle, it’s a “quadrilateral”. We get this odd shape when either the sprayer outlet or the target canopy are significantly taller than the other. Fortunately this one has a right angle so we don’t have to brush off our high school trigonometry textbooks. Instead, we can lean on the internet using this link and plug in the values. As we can see below, the cross sectional areas spanning from the outlets and the middle of the target canopies are 0.9 m2 for the bottom outlet, and 2.35 m2 for the upper outlets.
This gives us a cross sectional area, but we need to convert that to a volume so we can compare the air generated to the air needed. To do that, we multiply the cross sectional area by 100 m, representing how much air would be needed over 100 m of row length. The formula and the results are presented below.
Cross sectional area (m2) x 100 m of row length = Target displacement volume (m3)
Outlet
Target Displacement Volume (m3)
Top Outlet
235.0
Bottom Outlet
90.0
Target displacement volume for each outlet over 100 m of canopy row.
5. Displacement rate
We see the target displacement volumes for each outlet are significantly different. Assuming the air from the upper outlet maintains its integrity and reaches its target canopy without being blown off course, it must produce enough air energy to fill more than twice the displacement volume of the lower outlet. We can see from the earlier calculations that it does produce almost twice the total volumetric flow. But is it enough? To know we must calculate the Displacement Rate for each outlet. Let’s just focus on the left side of the sprayer in high gear.
Displacement Rate (displacements/h) for left side of sprayerin high gear
Top Outlet
26.25
Bottom Outlet
36.0
Displacement rates for the outlets on the left side of the sprayer in high gear.
So we see that the outlets at the top of the sprayer, if stationary, could displace the target volume of air 26.25 times an hour. However, the lower outlet would displace its target volume 36 times in that same hour. We see that we might have a problem. But this is for a stationary sprayer and not a sprayer in motion. The last step gives us what we came here for.
6. Ideal travel speed
We can now determine the ideal travel speed for this sprayer using that same 100 m row length.
[Displacement rate (displacements/h) x 100 m of row length] ÷ 1,000 (a constant) = Ideal travel speed (km/h)
Outlet
Ideal travel speed (km/h) based on left side of sprayer
Top Outlet
2.6
Bottom Outlet
3.6
Ideal travel speed for each outlet on the left side of the sprayer in high gear.
As we stated at the beginning of this article, this is only a model. It doesn’t account for canopy density and assumes the spray laden volume of air produced by the sprayer can reach the target intact over a given distance. However it does indicate that there is a potential issue that will lead to either over spraying the adjacent row (slower travel speed) or under spraying the distant rows (faster travel speed) which could lead to waste, drift and poor coverage.
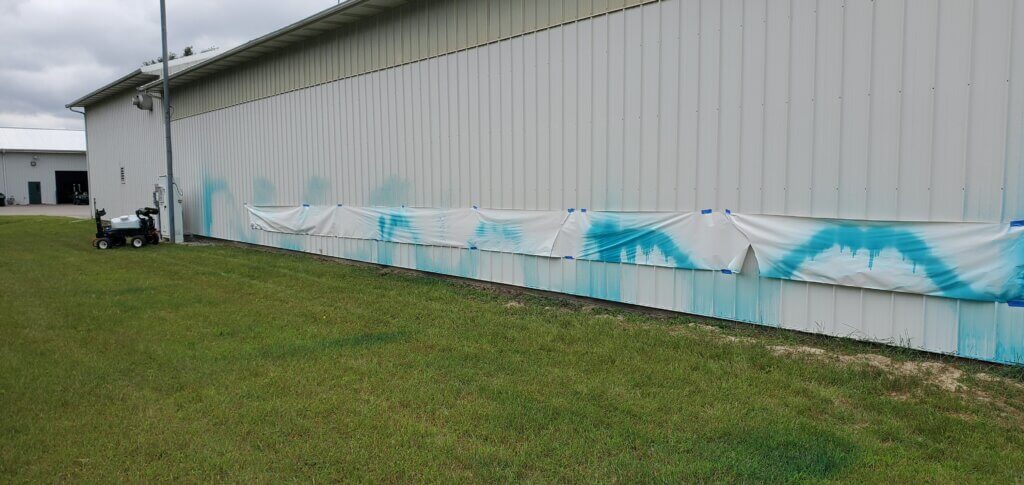
In the image below, we chose to drive close to 2.6 km/h in high gear. No effort was made to adjust the liquid flow (i.e. change the nozzles) so there was too much spray volume here, but we can see the losses on the left (upwind) side, and the blow-through three rows over on the right (downwind) side. Leaving aside the excessive liquid volume, we could drive faster or reduce the fan gear to reduce the blow-through on the adjacent rows, but we may go too fast (or reduce the rate of air displacement) for the upper outlets to reach the target. We can already see the integrity of the upper-left outlet breaking down as it sprays into the wind.
Testing a travel speed. No effort was made to adjust liquid flow, which is excessive here. Cross wind was from the left to the right in the image. Photo by Corey Parker (Instagram: _parkerproductions)
Take home
An ideal travel speed for an airblast sprayer is more than just being productive. The spray must reach and penetrate the target. If this requires dangerously high speeds, or if you simply can’t move slowly enough, it suggests a problem with the spraying strategy. Changes will have to be made to the sprayer, the target canopy, or even the weather conditions you’re willing to spray in. Getting the job done quickly should not compromise the quality of the job. Use this method to re-evaluate your practices, or to assess the capabilities of candidate sprayers if you’re considering a new purchase. Be sure to confirm what this model is telling you using some coverage indicator, such as water sensitive paper.
Happy spraying.
Dr. David Manktelow, Applied Research and Technologies Ltd., is gratefully acknowledged for patiently explaining the concept of “Air Displacements” to the author.
There are many factors that affect the work rate of an airblast application. If an operator can improve their work rate, without compromising spray efficacy or safety, they improve operational efficiency and save money.
But how does each variable factor in? Is it worth the cost of a tender truck and operator to fill more efficiently? Should you upgrade to a multi-row sprayer? Should your next planting have longer rows? We have a simple calculator that can help you make these decisions. You can build and compare multiple scenarios to explore the relative impact of small changes to your typical spray program. We recommend making only one change for each scenario so you can better understand the results. Print the comparison page for your records.
Whether you’re a sprayer operator, or a manager of sprayer operators, this exercise will help you see your spray program in a whole new light. Download a copy of the Airblast Budget and Work Rate Calculator and explore your productivity. You must have Excel to run the spreadsheet, and you must permit the use of macros (you’ll be prompted to accept).
Spoiler: It’s amazing how changes to travel speed have only a marginal impact on work rate. Often less than 60% of the total spray job is spent actually spraying!
If you’d like to see just how productive you can be, check out this rare (possibly unique) sprayer from Ed Oxley Farms in Michigan. Built on an OXBO 7550, this sprayer is the fourth iteration of a concept developed over the last 20 years by Ed Oxley Farms and ag engineers from Michigan State University.
Capable of spraying five rows at a time, this self-propelled beast is a hybrid wrap-around and targeting-tower system that uses CurTec spray heads equipped with tangential fans and wire-mesh basket rotary atomizers.
That’s not dribbling – that’s purging the boom prior to spraying.
It sprays a mere 150 L/ha (~ 15 gallons/acre) at a ripping 13 km/h (~8 mph), as seen on the Ag Leader monitor below.
When row spacing and turn time are accounted for, that means it’s capable of covering almost 15 hectares (~40 acres) per hour.
And, when not spraying grapes, the boom can be swapped to make it a high-clearance corn sprayer. It doesn’t get much more efficient than this.
The following videos will show the view from inside and outside the cab. Note that the row that’s straddled is sprayed from an overhead spray head mounted to the centre rack behind the sprayer. The two adjacent rows are covered from one side from vertical spray heads mounted on the chassis. Finally, the boom holds two more overhead spray heads for the outer-most rows.
Ideally, the boom-mounted spray heads would be suspended vertically inside the row, but it makes for such a wide turn radius that it would take too long to turn… assuming there was enough headland to allow it. They’re also swept-back to minimize the turn radius and reduce the amount of airborne spray that deposits on the sprayer itself.
A clever design that makes a few compromises to ideal coverage in order to improve productivity. The balance works for them and this sprayer might be a sign of things to come in horticultural crop production systems. Want to see how your sprayer stacks up? Download the calculator and see where you might be able to make improvements.
Did you come here looking for advice on which sprayer is best for your small operation? Are you looking to ditch the backpack mist blower? Do you want to avoid repeatedly mounting and dismounting a 3-pt hitch sprayer from your only tractor? Are you concerned you’ll have to sell an organ to be able to afford one? We hear you, and we’ll try to help. Let’s set the stage with a few facts.
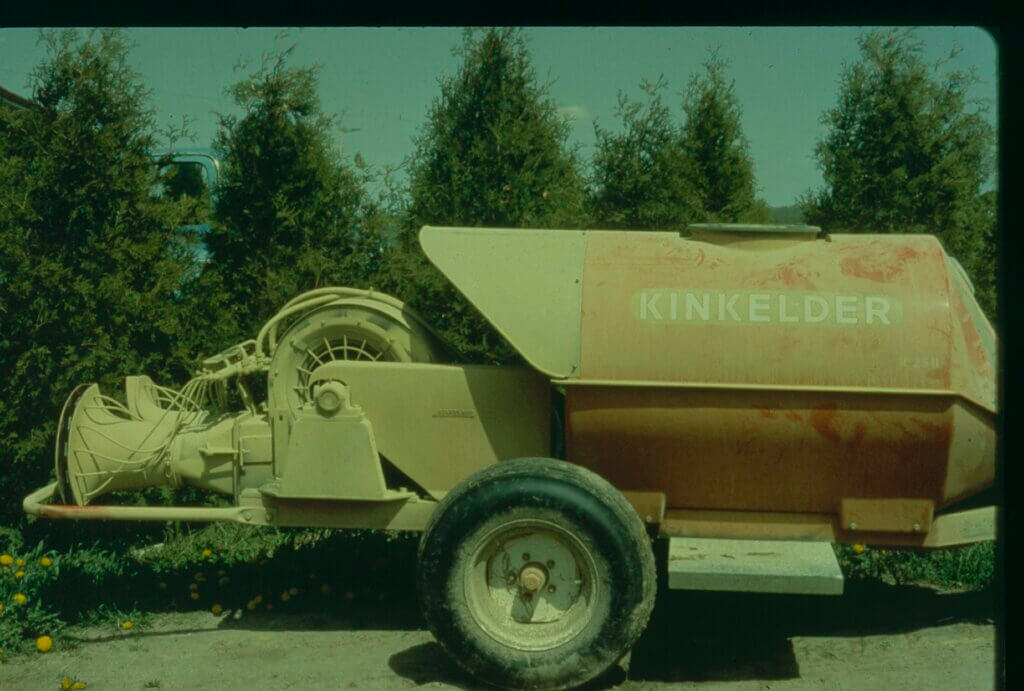
Airblast sprayers stay in service for a long time; more than twenty five years is not unheard of. The majority of them are the generalist, PTO-driven low profile radial design with capacities ranging 150 to 1,200 gallons. Typical fan diameters are around 30″ and can produce >40,000 m3/h of air, making them a good fit for most pomme, citrus and tender fruit canopies. These sprayers come with a horsepower price tag of perhaps 45 hp or more. Many of these sprayers eventually enter the used sprayer market, making them an affordable option for small acreage specialty operations. But, affordability should not be the sole motivation when choosing a sprayer.
Ontario, c.1980 and probably still out there spraying somewhere!
The key to optimizing sprayer performance is to match the air settings to the the canopy you’re trying to spray. You can start reading about the process here. In the case of small and medium-sized canopies like vine, cane and bush crops, the fleet of gently-used sprayers we just described tend to produce too much air. There are options to improve the fit, like driving faster to reduce dwell time, or perhaps the operator can employ the Gear-up Throttle-down method. But, the best plan is to employ a smaller sprayer, which produces a more appropriate air volume, has a smaller profile, delivers better fuel efficiency and won’t break the bank.
So, where are these sprayers? Unfortunately there aren’t many, and options are especially limited if you don’t own a tractor to power them.
The budget-conscious grower may be tempted to buy a sprayer that does not have air-assist. We do not recommend this. Air is a critical component for spraying canopies consistently and efficiently. Caveat Emptor!
We encountered a good solution in June, 2014, when we were invited to Durocher Farm in New Hampshire to see their new airblast sprayer. In years previous, spotted-wing drosophila (SWD) was a significant pest in this two acre, high bush blueberry planting. They claimed that since buying their new sprayer they no longer had any trouble with SWD. That’s quite an endorsement!
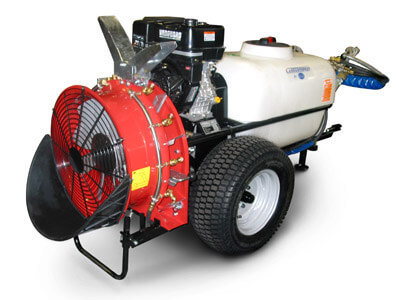
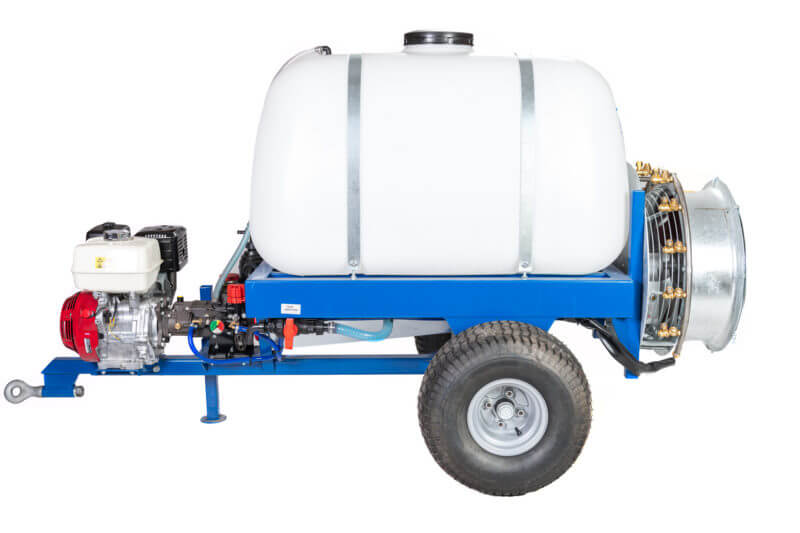
The Carrarospray ATVM (200 L option pictured)
I’m not sure what I expected, but I was captivated by this miniature orchard sprayer. The toy-like size carried a zero-intimidation factor and I immediately wanted to start using it. Italian-made, Carrarospray’s hobby line is designed to be pulled behind vehicles without PTO. The ATVM is available in capacities from 120-400 L. The one I saw had a 400 L capacity, adjustable air deflectors, a fan speed gear box, and it was powered by a quiet and efficient pull-start Briggs & Stratton four-stroke engine. It even had a trash guard, a kick-stand and a clean water tank for hand washing. That’s a lot of features.
Thanks to Kitt Plummer (Durocher Farm), Penn State, Univ. New Hampshire and Chazzbo Media for filming these 2014 videos:
The sprayer was pulled (in this case) by a mower, so the grower not only sprayed, but mowed his alleys at the same time. It fit beautifully between the bushes, so the potential for physical damage to the berries was minimized. The air speed and volume was enough to displace the air in the blueberry canopy and replace it with spray-laden air with minimal blow-through. Combined with an appropriate spray volume and distribution over the boom, we found that the coverage it provided was excellent.
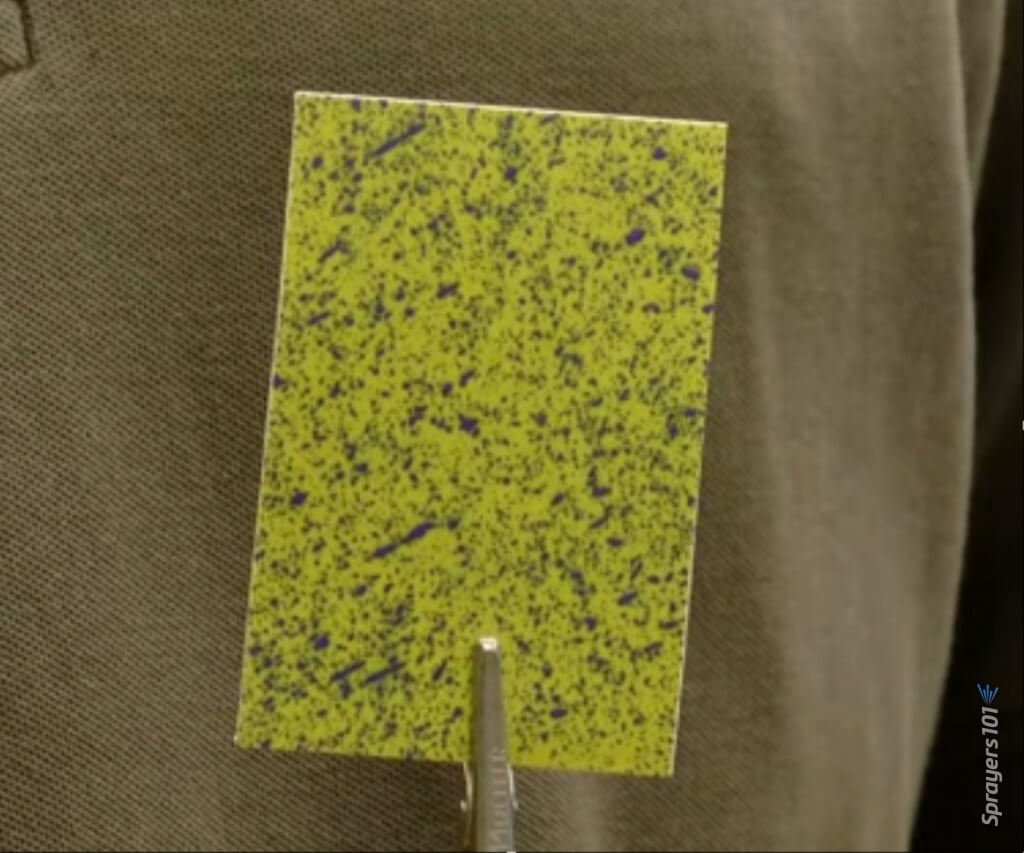
Coverage from the top-centre of the bush.
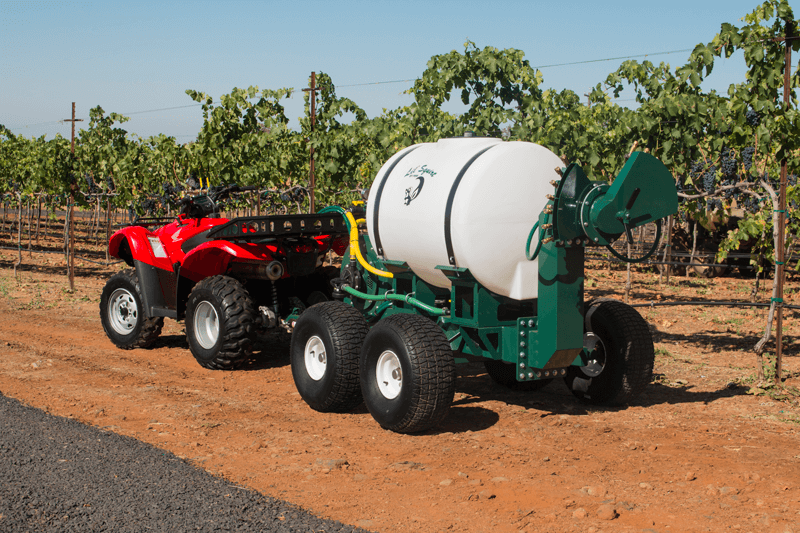
Since seeing this sprayer, we have had reports that importing it to Canada has proved challenging. But there are alternatives. A few companies here in North America offer economy-sized airblast models that are ATV trailed, or skid-mounted, or attached to a small tractor via a three point hitch. PBM’s Lil Squirt is a simple and versatile option. Available primarily in the western US from California through to Washington.
PBM’s trailed Lil Squirt (Image from their website)
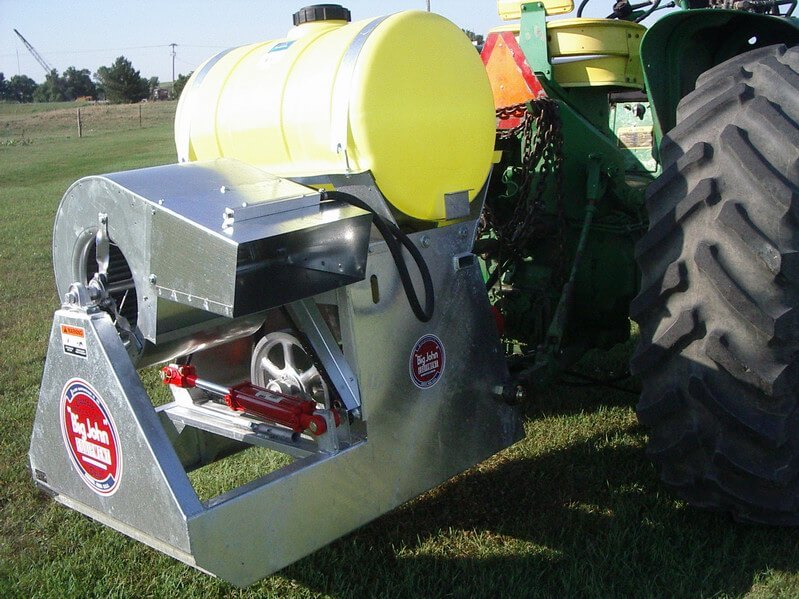
Another option is the mounted, PTO-driven mistblower line from Big John Manufacturing in Nebraska.
BJ 3PT mistblower from Big John Manufacturing (Image from their website)
Or MM Sprayer‘s ATV sprayers, which come PTO or Engine-driven. The LG400 has a 106 gallon tank and a 20″ fan. I’d like to see deflectors, but you could easily add them. Here’s a 2024 pdf on features.
Picture of the LG400 engine-driven model from www.mmsprayers.usa
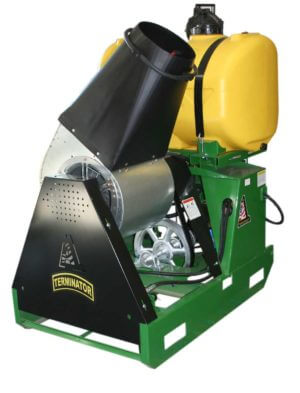
Or Wisconsin’s Contree Sprayer and Equipment. They carry the “Terminator” line. Skid mounted, one-sided air shear units with capacities from 15 to 100 gallons, this company offers a range of possibilities both PTO and gas-driven. Well worth a look.
The “Terminator” skid-mounted mist blower from Contree Sprayer and Equipment (Image from their website)
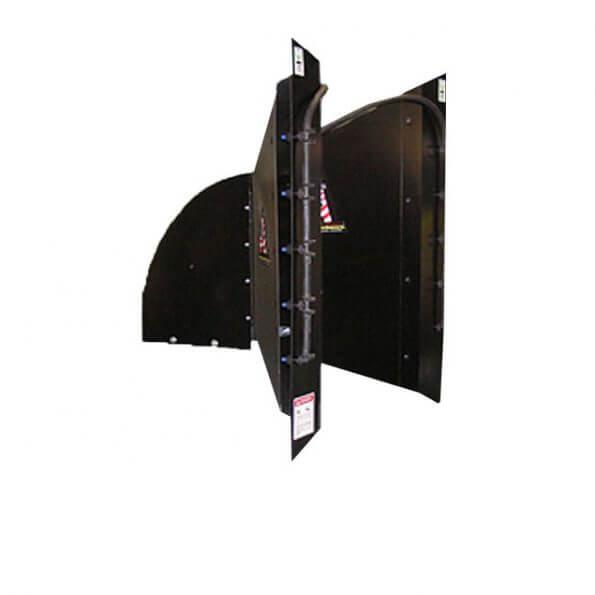
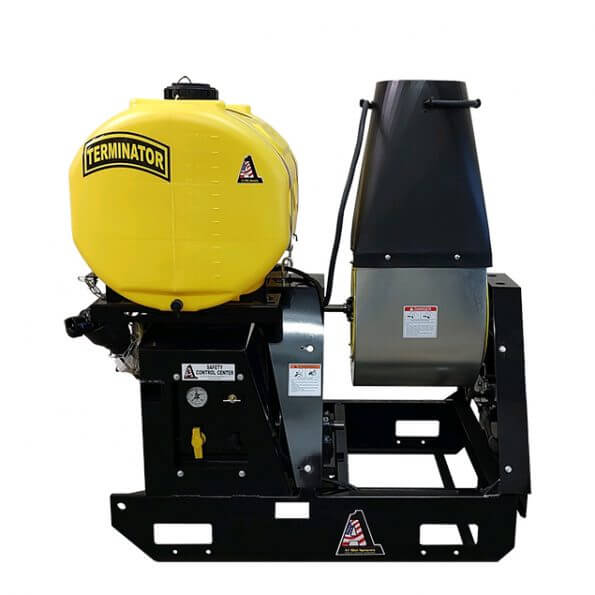
Then there’s the A1 Mist sprayer series, also out of Nebraska. They carry the Terminator line as well as an interesting two-sided volute option that employs conventional nozzles and allows one pass down an alley rather than two. This is a big productivity booster:
A1’s two-way volute header. (Image from website)A1’s PTO-driven 60 gallon, skid-mounted “Terminator”. (Image from website).
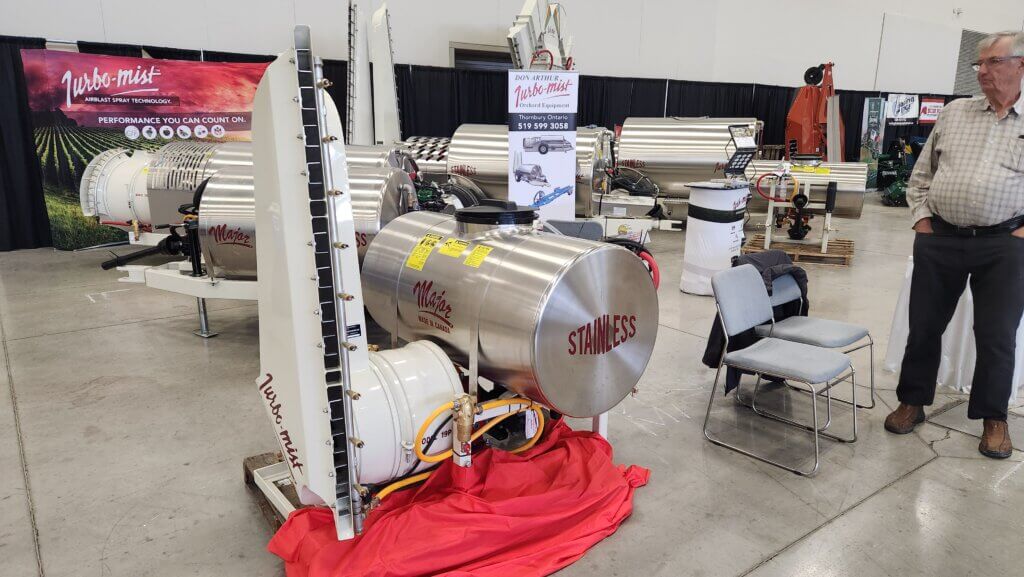
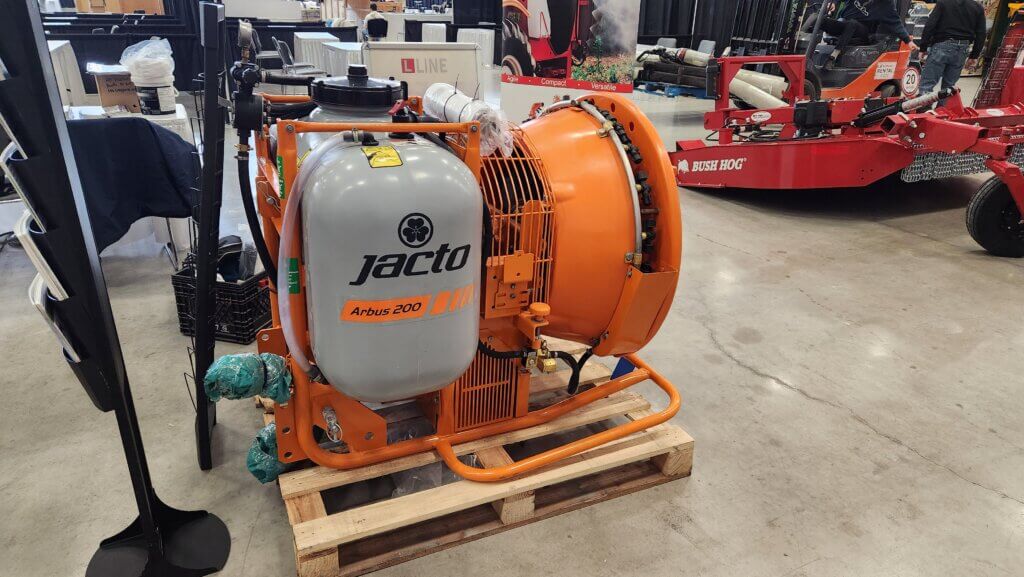
Then there are larger, PTO-driven, three-point hitch options. In fact, there are many options for this manner of sprayer, but they tend to be out of the price range for small operations, and they do require a tractor. That isn’t a deal-breaker, though, as they can sometimes be found used. Pictured below is British Columbia’s Major 193 (Slimline Manufacturing) and a Brazilian-made option (Jacto) distributed out of Quebec.
Slimline Manufacturing (aka Turbomist) makes the Major 19P 3-pt hitch tower sprayer (PTO-driven)Jacto’s Arbus 200 3-pt hitch airblast sprayer (PTO-driven)
When considering your options, give serious thought to your work rate, refill time and other factors that go into developing a robust spraying strategy. What’s a spraying strategy? That’s a farm’s overall management and operational plan for achieving safe, effective and efficient spray coverage. You can read more in chapter 8 of Airblast101, which you can download for free, here. And, just to play Devil’s Advocate, go small but not so small that the sprayer is underpowered.
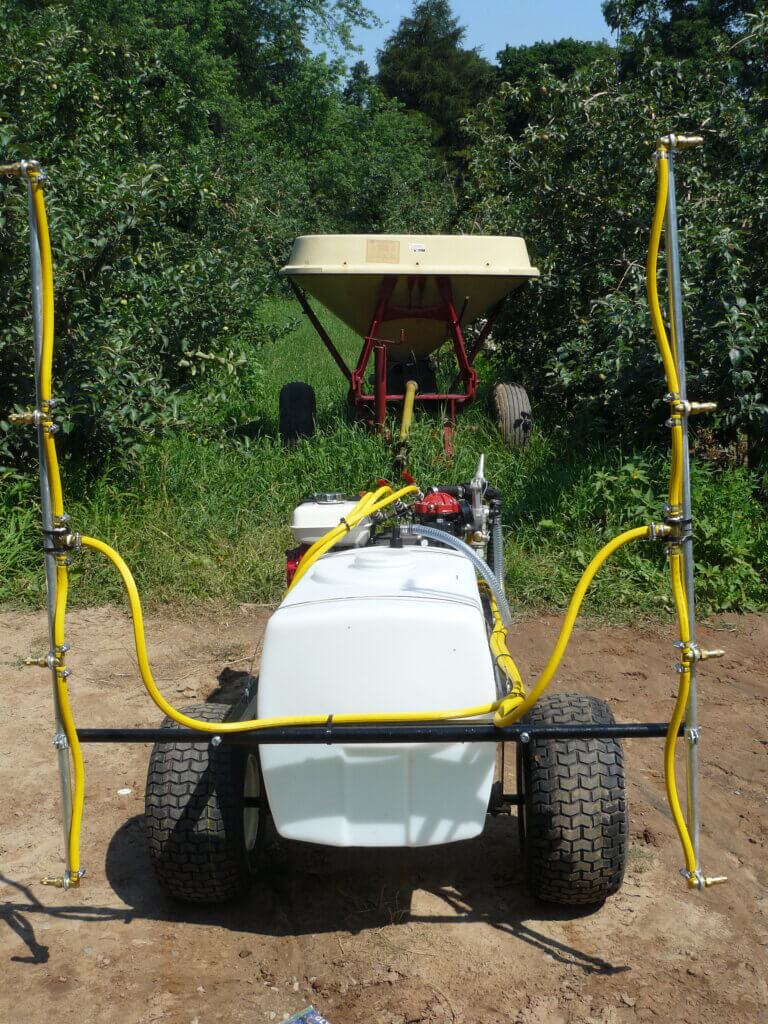
We staged this video in 2011 (spraying only water, so don’t mind the lack of PPE) to show how a sprayer can be too small for an operation. This 3-pt hitch GB cannot overcome the cross wind and the spray barely reaches the apple trees. Reducing travel speed and increasing pressure won’t cut it, either.
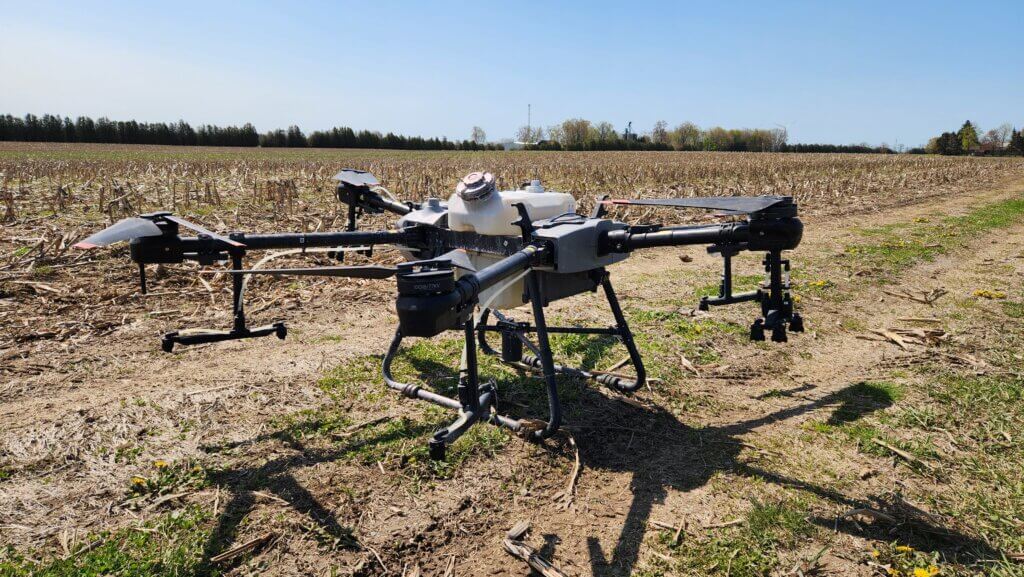
Of course, other possibilities are emerging for crop protection in small acreage perennial crops. Multirotor drones are capable of delivering air-assisted spray from above the canopy. While it’s still a drift-prone and inconsistent means for broadcast spraying, it might lend itself to perennial row crops. Equipment design is evolving quickly and global research is underway to establish best practices. As regulators and agrichemical companies focus more on this method we may see drones as a cheap alternative to a tractor/airblast sprayer, with no compaction, no mechanical damage to fruit/berries, and no potential for splashing infection throughout an operations.
DJI’s Agras T30
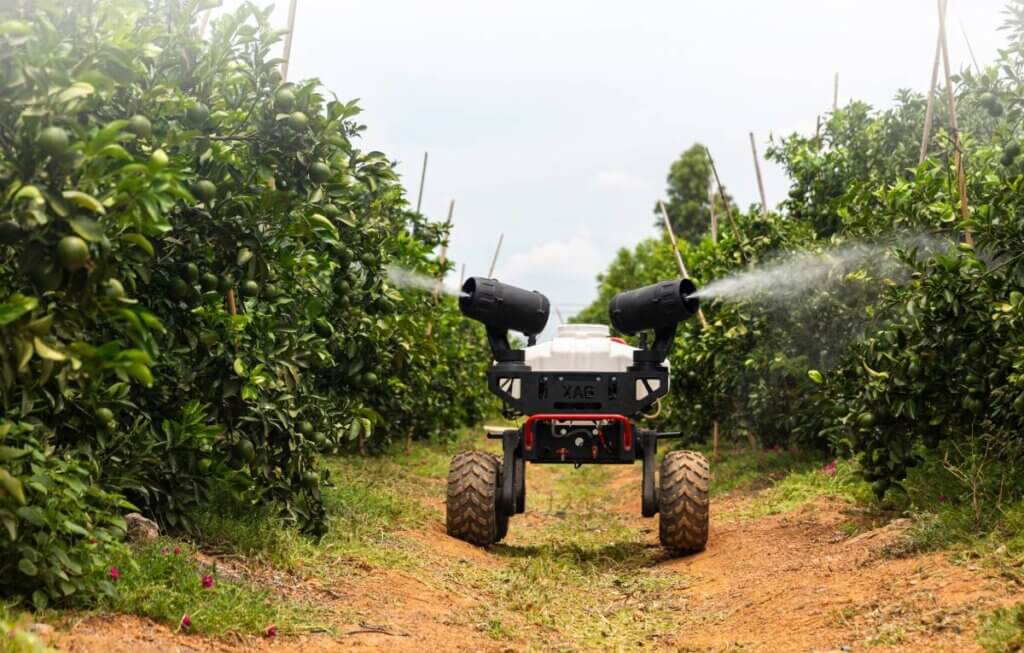
Even further into the future, small autonomous sprayers may be viable, too. Very much in their early days there is great potential. One example is the XAG Revospray Ground 2 with it’s 150L capacity or the R150 with it’s 100 L capacity.
The R150 – Image from https://hse-uav.com/. Modular system and ~32K USD (as of 2023)… if you can find one.
It’s early days, but there are researchers looking at the spray pattern from these units. The image below may not be a fair indication because the nozzle used may not have produced as wide a swath as possible. Thanks to Dr. M. Reinke for the image.
A test pass using food grade dye. You can see the waveform created by the two spray heads as they move up and down during travel.
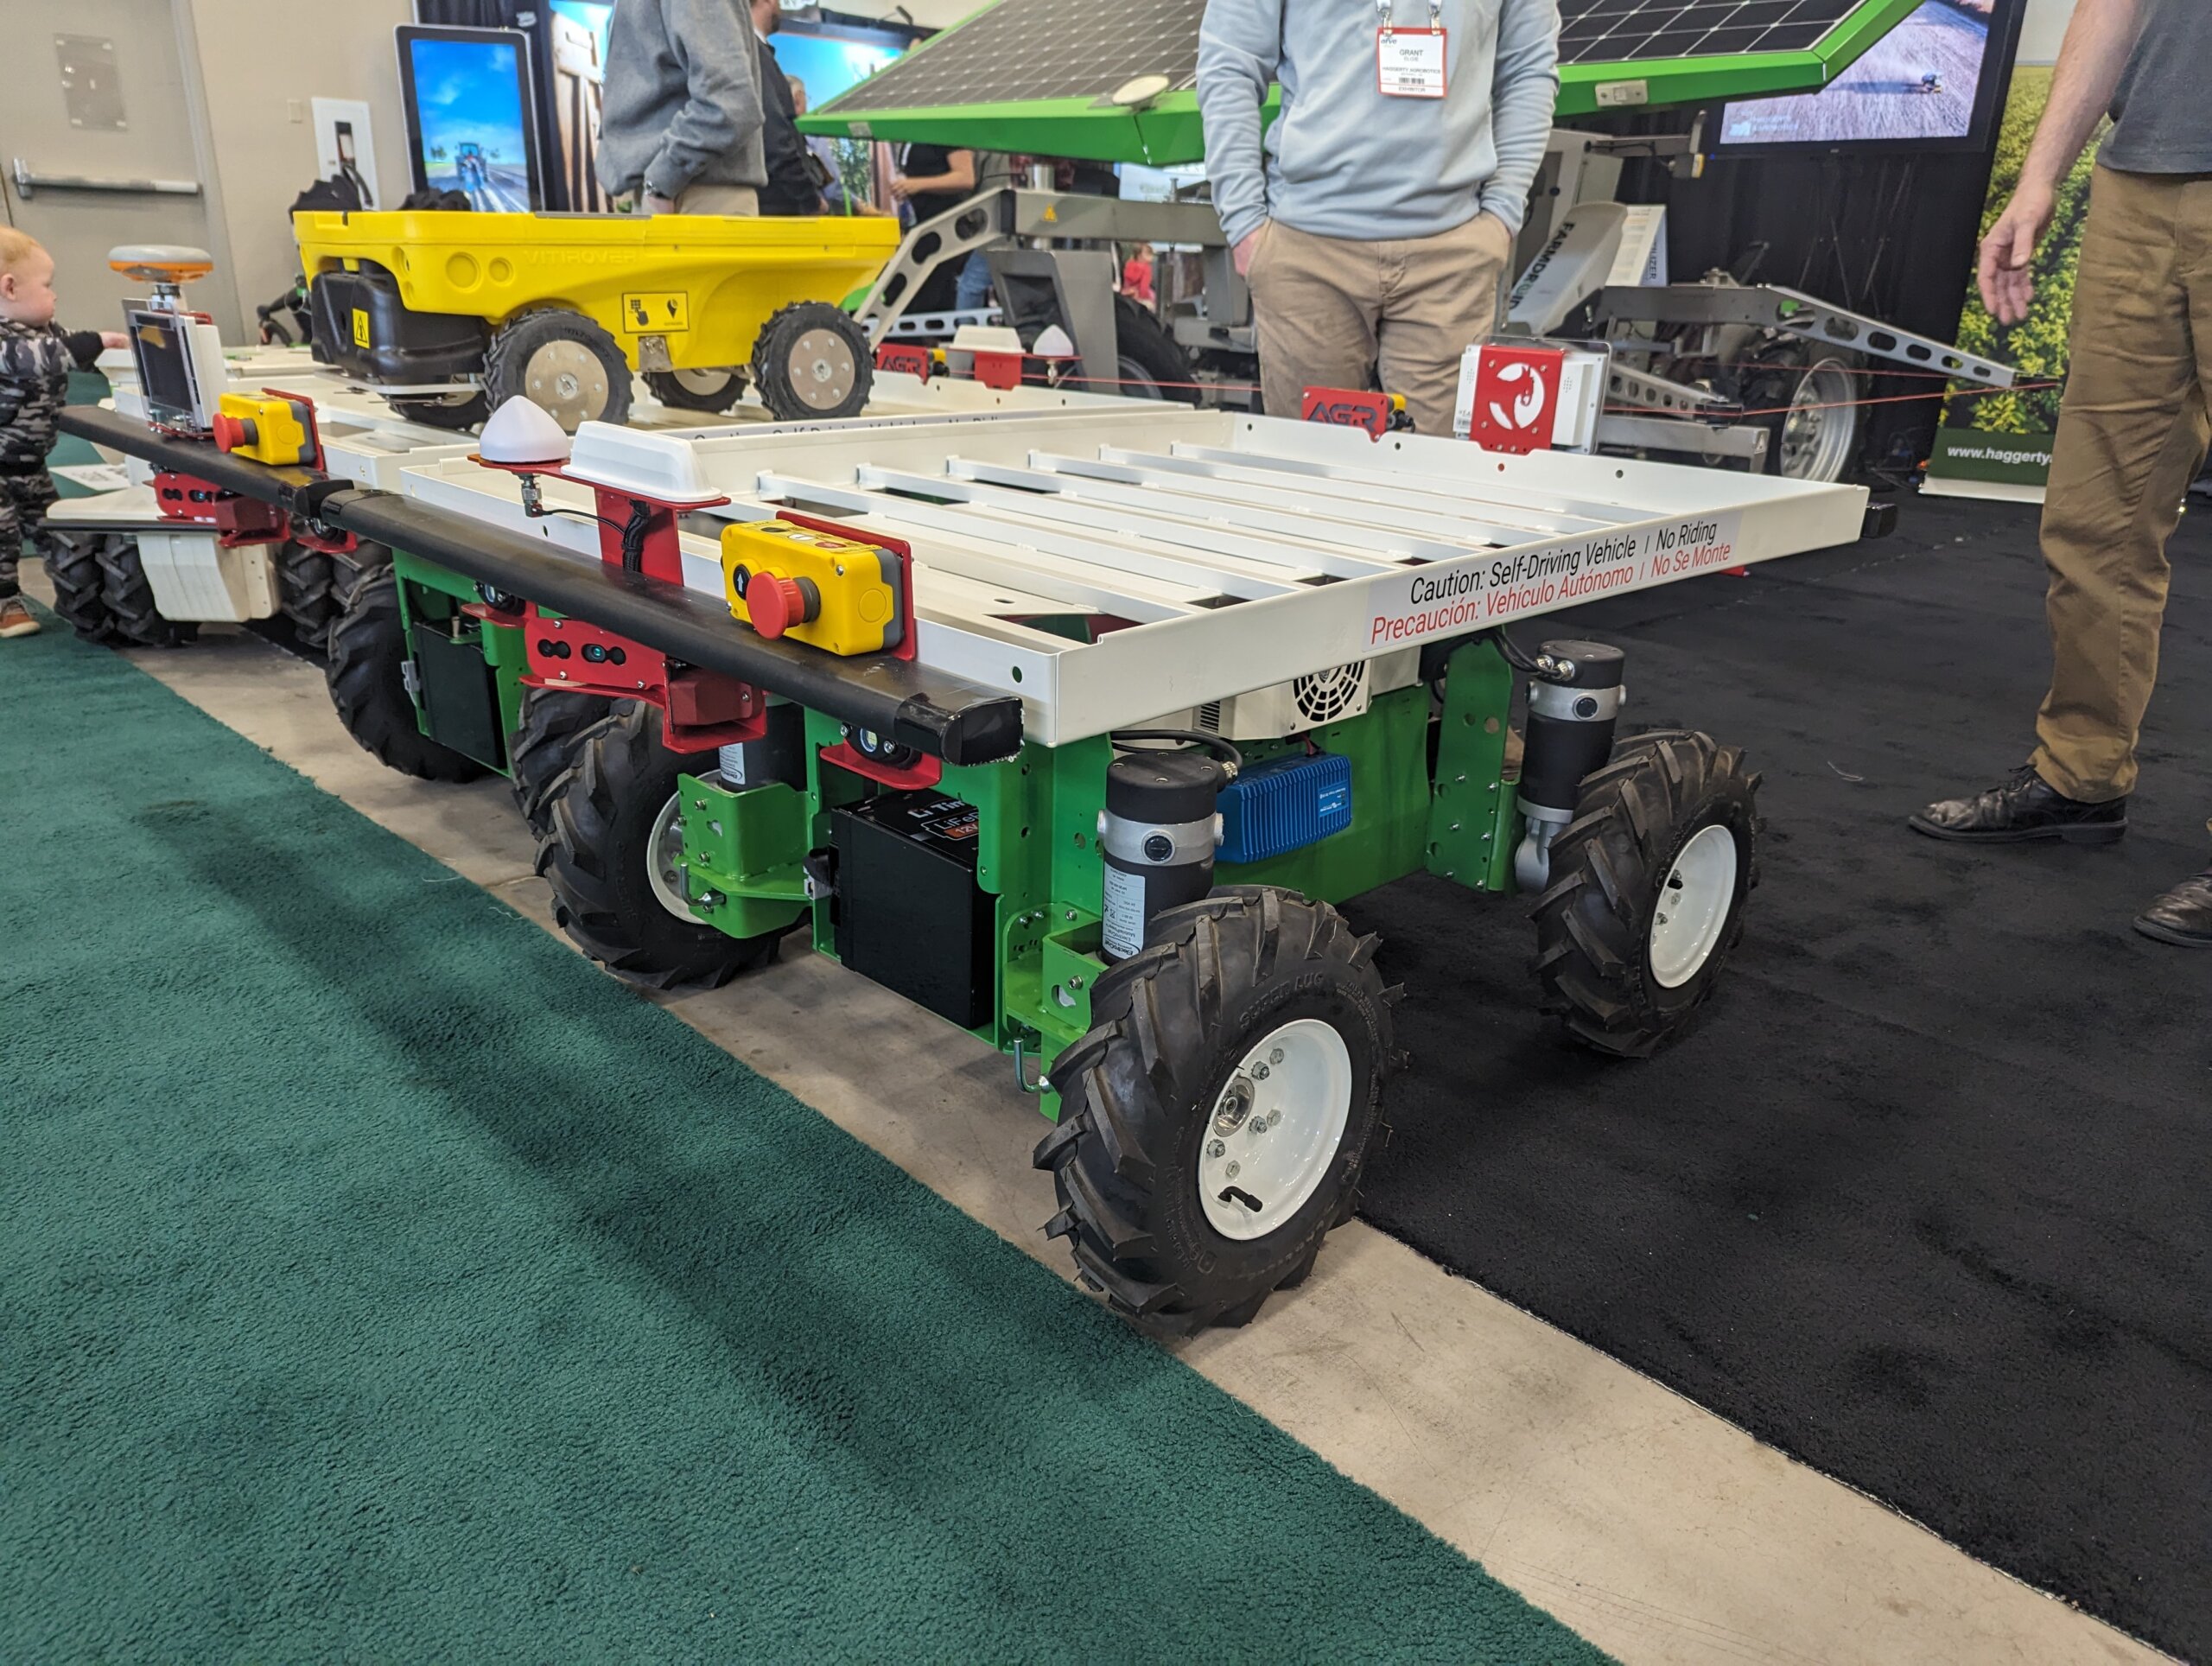
And recently, small autonomous platforms have become more common. Perhaps there’s an opportunity to place a gas powered sprayer on these platforms, or use them to pull a hitch-style sprayer. One such possibility is created by the Burro, shown below at the Ontario Fruit and Vegetable Convention in 2024.