Introduction
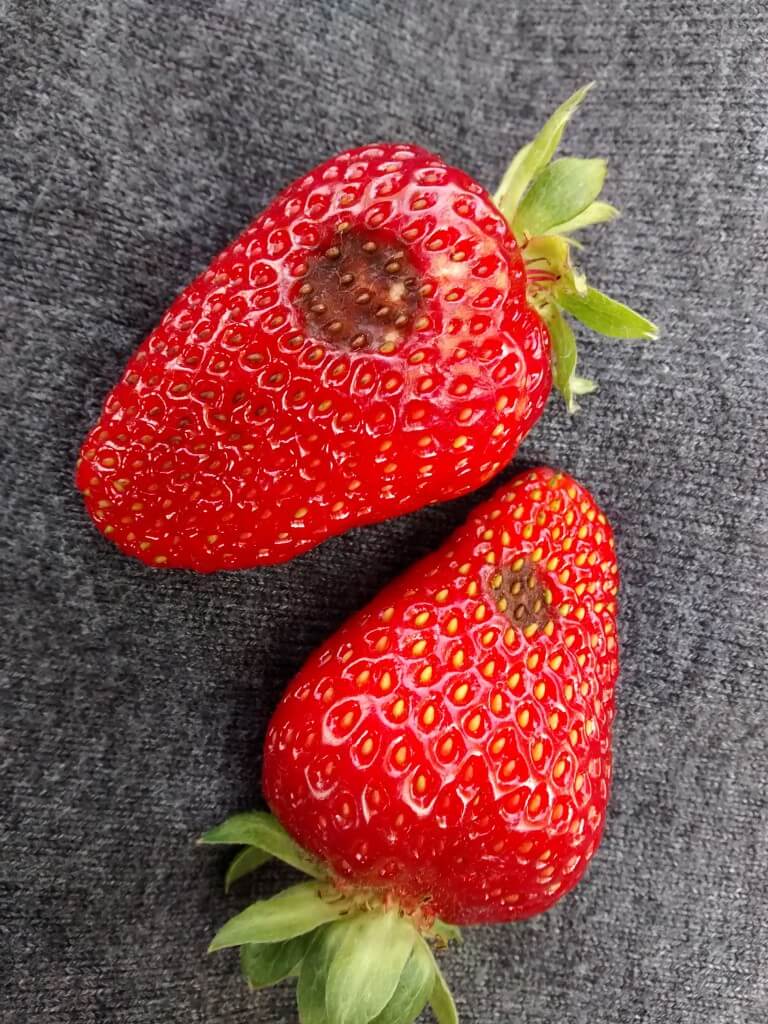
A local strawberry producer was just beginning his harvest when the entire field was suddenly stricken with anthracnose. He would have done almost anything to save it, but he could only watch in frustration as the disease quickly devastated his crop. While he was telling me this story, he was wringing his hands; I’m sure he didn’t realize he was doing it. It had been more than a month since the crop was lost and he was obviously still very upset. Let’s put on our deerstalker hats and consider what might have caused the trouble.

Most of the fungicides we apply in horticulture are protectants, not curatives. What that means is that the fungicide has to be in place before disease has a chance to take hold. Once it establishes a beachhead, you can typically only hold it at bay, not eradicate it. So, if you’re guilty of waiting too long between fungicide applications, the problems may have already begun. This is exacerbated when you don’t achieve the necessary spray coverage. Put the two together and mix in rainy and warm conditions and diseases like anthracnose can spread at alarming speed.
Method
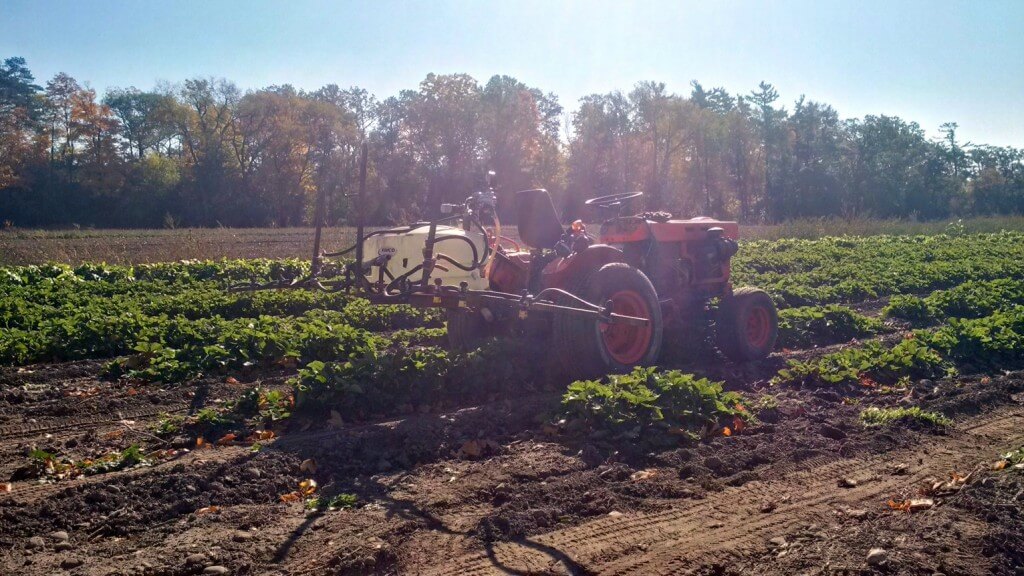
I focus on the sprayer part of disease management, so I have to assume that inoculum is being controlled as much as possible (e.g. culling infected plants, drip irrigation, etc.). I asked the grower about his sprayer and his spraying schedule. He admitted to pushing the limits between fungicide applications, and being uncertain about the spray coverage he was achieving with his conventional flat fan nozzles.

In cases like this I try to find gentle ways of introducing the idea of using more water, increasing the frequency of applications, or buying new nozzles, because there is time and expense involved and many growers don’t want to hear that. However, when I started my soft sell routine, he looked me straight in the eye and said he’d lost tens of thousands of dollars in revenue so a few nozzles or a couple more applications were not a pressing concern. There’s a point in any endeavour when you’ve committed so much time and money that you’ll do pretty much anything to see it come to fruition (pun intended). He was willing to do whatever it took. This was my kind of guy.
So, in preparation for next year, we diagnosed spray coverage from five different sprayer set ups. Let me point out, as I always do, that spray coverage analysis does not necessarily extend to control. They correlate well, but if you aren’t using the right product or your timing is off, even the best coverage won’t help you. Caveats aside, here’s what we tested:
Setup1:
Broadcast application using a horizontal boom with TeeJet Twinjet 8006’s at 8.3 bar (120 psi) on 50 cm (20 in) centres. We calculated a nozzle rate of 3.9 L/min (1.03 gpm), so at 5.0 km/h (3.1 mph) that’s 923 L/ha (98.7 g/ac).
Setup 2:
Banded application on a horizontal boom equipped with a row kits suspending three TeeJet XR 8002’s at 8.3 bar (120 psi). We angled the two side nozzles so the fans were not perpendicular or parallel with ground. This kept more spray on the raised row and out of the alleys. The swath covered 50 cm (18 in) and we calculated a nozzle rate of 1.29 L/min (0.34 gpm), so at 5.0 km/h (3.1 mph) that’s 1,016 L/ha (108.6 g/ac).
Setup 3:
Banded application on a horizontal boom equipped with a row kits suspending three TeeJet XR 8002’s at 6.2 bar (90 psi). We angled the two side nozzles so the fans were not perpendicular or parallel with ground. This kept more spray on the raised row and out of the alleys. The swath covered 50 cm (18 in) and we calculated a nozzle rate of 1.14 L/min (0.3 gpm), so at 5.0 km/h (3.1 mph) that’s 896 L/ha (95.8 g/ac).
Setup 4:
Broadcast application using a horizontal boom with TeeJet Twinjet 8004’s at 6.2 bar (90 psi) on 38 cm (15 in) centres. We calculated a nozzle rate of 2.27 L/min (0.6 gpm) so at 5.0 km/h (3.1 mph) that’s 717 L/ha (76.5 g/ac).
Set up 5:
Broadcast application using a horizontal boom with TeeJet Twinjet 8006’s at 6.2 bar (90 psi) on 38 cm (15 in) centres. We calculated a nozzle rate of 3.4 L/min (0.9 gpm) so at 5.0 km/h (3.1 mph) that’s 1,076 L/ha (115 g/ac).
Protocol and Conditions
It was late September, so the weather was a cool 8 °C, humidity was low and winds averaged 5 to 15 km/h. We timed our passes to correspond with lighter wind wherever possible. Three sets of water-sensitive paper were placed in a single row, but only one pass was made per sprayer setup. One paper was placed at the top of the canopy which is always very easy to hit, so we oriented it sensitive-face-down. The second paper was placed midway down the canopy, oriented facing up. The final paper was also oriented facing up, but placed at the very bottom of the canopy, more or less on the ground. Collectively, we spanned the depth of the canopy.
Following each application, papers were collected for digital analysis using “DepositScan” which determines the percent of the paper covered with spray, and the droplet density. Both of these factors contribute to overall coverage. This wasn’t intended to be a rigorous experiment, so the means are presented here with standard error for the sake of comparison. There was no statistical analysis. In the case of papers located face-down, when only trace amounts of spray were discernible they were assigned a percent coverage of 1% and droplet density of 25 droplets/cm2.
Results
A few observations before we get to the results. Research has demonstrated that row kits and higher volumes improve spray coverage, and that’s why we tried banding the applications using row kits in Setups 2 and 3. However, this grower didn’t use GPS to plant his rows, and while they weren’t too crooked, they made it challenging to apply in a band. Further, there is some concern that a banded application would miss any inoculum in the alleys. These are important points to factor in when considering methods to control disease.
The keen reader might notice we sprayed using pressures that exceed the manufacturer’s recommendations. In fact, none of these tips were rated over 60 psi and I used a formula to calculate their output at our high pressures. I have been heard to say (many times) never to exceed the manufacturer’s rates because it makes a mess out of the spray quality: droplets get much finer and pressure does not cause finer drops to penetrate a dense canopy. Better to switch to larger nozzles and stay within the pressures indicated on the manufacturer’s rate tables. I maintain that assertion. However, the grower was assured by fellow growers and custom applicators that this was the way to go and he wanted to try it. So, that’s where Setups 1, 4 and 5 came from.
Be aware that a small sprayer like the one in this study needs considerable pump capacity to support such high pressure and flow to the boom and maintain effective agitation. For more information on pumps, check out this article.
The following table expresses the coverage obtained by setup:
| Set up | Paper Position | Mean % Coverage (±SE) | Mean Deposits/cm2 (±SE) |
| Setup 1 – Broadcast XR 8006’s on 20” centres at 120 psi for 98.7 gpa | Top | 1.0 ± 0 | 25.0 ± 0 |
| Middle | 23.6 ± 4.5 | 253.5 ± 72.9 | |
| Bottom | 15.2 ± 2.1 | 423.2 ± 35.3 | |
| Setup 2 – Three banded XR 8002’s at 120 psi for 108.6 gpa | Top | 2.1 ± 1.1 | 78.9 ± 53.9 |
| Middle | 54.8 ± 12.1 | 275.2 ± 145.3 | |
| Bottom | 29.1 ± 2.7 | 544.5 ± 70.4 | |
| Setup 3 – Three banded XR 8002’s at 90 psi for 95.8 gpa | Top | 7.4 ± 5.9 | 134.4 ± 52.2 |
| Middle | 31.6 ± 15.9 | 203.6 ± 108.5 | |
| Bottom | 8.1 ± 3.9 | 224.4 ± 102.3 | |
| Setup 4 – Broadcast Twinjet 8004’s on 15” centres at 90 psi for 76.5 gpa | Top | 1.0 ± 0 | 25.0 ± 0 |
| Middle | 33.3 ± 5.0 | 240.7 ± 70.9 | |
| Bottom | 12.9 ± 6.0 | 263.9 ± 95.2 | |
| Setup 5 – Broadcast Twinjet 8006’s on 15” centres at 90 psi for 115 gpa | Top | 2.3 ± 1.3 | 105.6 ± 80.6 |
| Middle | 48.9 ± 5.5 | 194.3 ± 25.6 | |
| Bottom | 19.5 ± 10.3 | 246.8 ± 40.4 |
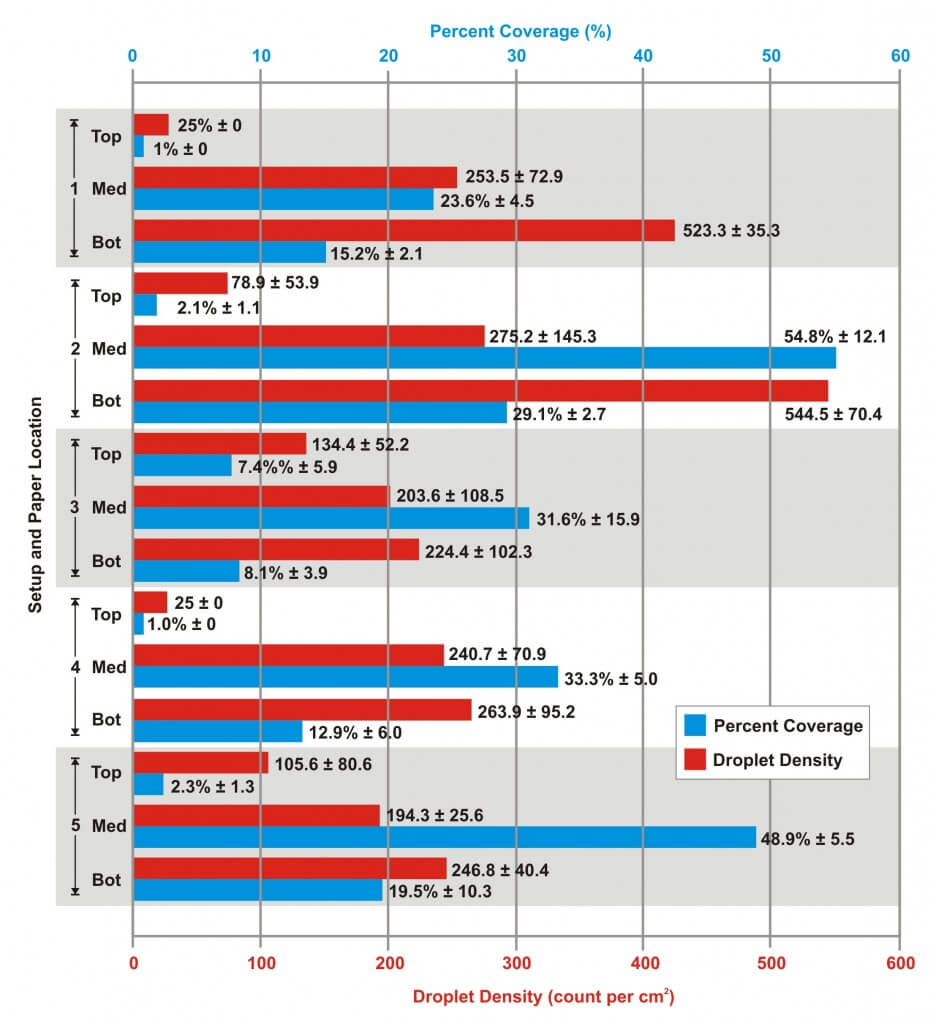
The results may be easier to compare and contrast in the following graph.
Observations
According to the results, Setup 2 appeared to provide the best overall coverage. This is no surprise given that it was the second highest volume and employed a row kit. This corresponds with findings that have been published elsewhere. However, the excessively high pressure did create a lot of drift and the row kit didn’t always line up with the planted row. Further still, there’s the potential for missing anything that might harbour inoculum in the alleys, like runners. This setup wasn’t appropriate for this particular situation.
The second-best overall coverage was obtained from Setup 5. This represented the highest volume, and a preferably lower pressure on twinjets, which may have allowed the spray to penetrate the canopy from multiple angles. This broadcast application is more reliable for hitting meandering rows and covers the alleys as well. So, the grower plans to employ this setup for the 2016 season, spraying at shorter intervals and confirming his coverage with water-sensitive paper. Let’s hope it works out.
End-of-Season Update
The grower that volunteered his time to this study has reported that his strawberries at the end of the 2016 season were absolutely beautiful. Granted, it is always difficult to draw a direct correlation between sprayer calibration and control. For example, 2016 was a very dry growing season and disease pressure was lower than in 2015. Nevertheless, spray coverage plays an important role in crop protection and our work to improve sprayer performance definitely played it’s part. His success is great news!
