It’s odd to begin an article by suggesting the reader consult another, but Dr. Tom Wolf wrote a great summary about adjuvants for SaskPulse in 2023 and you can and should download it here. While I’m at it, also grab this article by Rich Zollinger, Emeritus Extension Weed Scientist, North Dakota State University.
OK, back to the article at hand. An adjuvant is “any substance in a formulation or added to the spray tank to modify the biological activity or application characteristics”. This means they have an array of functions, such as masking pesticide odor, conditioning carrier water, improving mixing and reducing drift (Utility modifier adjuvants). They can also improve the degree of contact between droplets and the plant surface, or enhance product uptake or rainfastness (Activator adjuvants which include a subset of products referred to as Surfactants [SURFace ACTive agENTS]).
For example, this short video was filmed in 2015 to demonstrate how a sticker surfactant reduces runoff and how a penetrant surfactant can help a product pass through a waxy plant surface. This video was filmed and edited by former OMAFA summer student, Victoria Radauskas.
Generally, pesticides already come preformulated with the requisite inerts, which include the utility modifier and activator adjuvants that ensure ease of use and optimal product performance. But sometimes the pesticide label requires the operator to add a particular name brand or category of adjuvant. In this case, the pesticide does not include the adjuvant because it might negatively impact product stability, increase bulk and/or increase expense.
Canada is seeing an increase in the number of adjuvants for purchase (particularly utility modifiers). Claims of improved performance make it tempting to reflexively and proactively throw them in the mix. The grower is free to use any adjuvant provided it is registered for use on the crop and in combination with the pesticide being applied. You can learn more about the regulatory realities in our tank mix article.
We suggest that adding any adjuvant is an optional last step in optimizing a sprayer’s performance. Dialing in all other aspects tend to reap the greatest rewards. Here are a few general guidelines when using surfactants in horticultural crops:
Do not use penetrant surfactants (including oils) with copper, sulphur or captan fungicides.
Do not use penetrant surfactants with contact or surface pesticides.
Stickers may impede the movement of systemic products.
Stickers may prevent redistribution to newly emerging leaves early in the growing season (but they may be desirable during wet springs).
Deposition utility modifiers may negatively affect canopy penetration when employing multi row or alternate row traffic patterns.
Spreaders are more likely to incur runoff so adjust volumes accordingly.
Additional Resources
The following video presentation was recorded for a 2021 adjuvant conference in Argentina. It’s a primer to introduce what adjuvants are and why we might consider using them. You’ll note that I speak slowly during the presentation – that’s because it was being translated and I wanted to make that process as easy as possible. Also, I think I mistakenly said captan was an insecticide – in fact it’s a fungicide. Oops.
And here’s a 2022 interview from Real Agriculture’s “The Agronomists” featuring Tom Wolf of Agrimetrix, and Greg Dahl of Winfield United. For the adjuvant-related part of the conversation, you can pan ahead to the six-minute mark.
And here’s a 2025 interview from Real Agriculture’s “The Agronomists” featuring Jason Deveau and and Austin Anderson of Helena.
In this fourth installment of the Drive-Along Diaries, we’ll shift our focus a little. I’ll continue to share observations about real world spraying practices, but we’ll also dip a toe into the business side of custom application. Every contractor’s situation is different, but perhaps you’ll be able to relate to some of these experiences.
4:30 am
Once again, I found myself driving through Ontario in the wee hours, sipping life-giving coffee and marveling at the total absence of traffic. I was headed to Grande Pointe near Chatham to meet with Paul Delanghe, who’d invited me to tag along with him. I was looking forward, but I was also experiencing a little dread as I imagined subjecting my posterior to another day in the buddy seat. When I arrived at 7:00, I found Paul and his staff in the office. Handshakes were shared all around. Then I dove right in by asking how he got started and how his business worked.
Hello darkness my old friend. I’ve come to sit on you again.
An evolving business model – fertilizer and/or fungicide?
Paul’s family has farmed cash crops, including field tomatoes and sugar beets, for four generations. When he left the aviation industry in 2015, he invested in a high clearance sprayer and a set of Y-drops to apply fertilizer on the family farm. It wasn’t long before he was doing neighbouring farms as well. By 2017 he was saw potential in custom fertilizer work and started Acres Unlimited (AU), which incorporated in 2019.
The original business proposition was straightforward. A split fertilizer application with optimal timing can increase yield while saving fertilizer dollars. For example, perhaps a customer would lay down 150-175 lbs of fertilizer early season, and then call on Paul for another 25-50 lbs using his Y-drops. They might request a single rate, or a variable rate depending on soil type and yield potential (or none if hail or drought wreaked havoc).
This worked well for a few years, so Paul expanded into fungicides. He observed that many corn growers didn’t want to invest in their own high clearance sprayers and preferred to let a contractor worry about minimizing the trample (~4% of the yield). In the case of wheat, many growers were too busy planting to thoroughly clean their sprayers after herbicide applications and were happy to make that the contractor’s problem.
Paul found that fertilizer applications weren’t as lucrative as fungicide applications. High volume fertilizer applications meant spraying 300 ac/day instead of the 5-700 typical of herbicide or fungicide applications. That loss in productivity bit deeper when he had to rely on the client to load UAN because it meant chasing refills and waiting on small-capacity pumps.
Those delays created scheduling conflicts. Typically, as June slips into July, the window for fertilizers closes as the window for fungicides opens. But when there’s a wet spring (like we had this year) it stretches the planting window. Paul would get calls for fertilizer applications in late July, overlapping the fungicide sprays that extended into early August.
So, was offering custom fertilizer still worth it? Fungicides represent the biggest opportunity for profit and are relatively low risk. UAN is hard on equipment and machine prices and depreciation costs have increased significantly (Paul figures $200.00 CAD/engine hour). He calculated that he would have raise his prices to $25/ac for custom fertilizer applications, and that just wasn’t feasible. So, for all these reasons, he decided to leave custom fertilizer applications behind.
Staff roles and coordination
Today, Acres Unlimited consists of Paul, two full time employees (one sprayer operator and one tender truck operator) and one part timer. In addition to working for AU, employees have personal endeavours, such as running their own farms or hauling tomatoes. That means work assignments must be flexible because availability isn’t always a given. Paul sprays from April to November and when he works on his own, he can handle 3 to 500 acres a day. As long as everyone is on board for the peak spraying season in late July / early August it all seems to work.
Staff coordinate their activities through their phones. They drop pins in Google Maps, use a group chat and call regularly to stay in touch. Each employee is trusted to operate semi independently, using their own judgement to establish the safest, most effective, and most efficient means to get the job done. I was left with the impression that the business functioned almost as a cooperative under the Acres Unlimited banner.
7:45 am – The yard
This was great office conversation, and I was so engrossed that I didn’t notice when the staff left for the yard to get ready for the day. We followed behind and Paul showed me their spraying equipment.
The Sprayers
Paul has experience with several asset tracking packages (e.g., AgLeader, Raven), but he likes John Deere’s Op Centre the most. When he started spraying, Deere was the most expensive North American option, so he went with Miller and Hagie. However, the cost of sprayers has increased in recent years and closed the price gap sufficiently for him to justify buying a 412R in 2023. AU also runs a 2022 Miller Nitro 7310, and that’s used by their second operator.
According to Paul, Deere really isn’t interested in producing a high clearance machine for corn (he was encouraged to go buy a Hagie) so he had to add tall tires and a lift kit to climb from the 1.53 m (60”) stock clearance under the frame to 1.82 m (72”). He also protected the hydraulics behind the tires by covering them with canvas bags. Other growers use 5 gallon pails or even car mats to accomplish the same thing.
Tendering equipment
AU recently upgraded to a Phiber DASH 4.4 on their 15,900 L (4,200 gallon) tender truck. It caused a little sticker shock but paid for itself very quickly. The sprayer was no longer idling while the operator filled the bowls, saving on engine hours. Plus, the less than eight-minute fill time added to their overall productivity.
The tender truck itself was designed for the operator to forklift totes onto an overhead platform and gravity feed chemistry into the inductor bowls. Paul likes the bulk format over the jugs and uses it whenever it’s feasible. However, he installed transfer pumps because they’re faster than gravity feed and do a better job emptying the totes completely. Paul prefers to trust the embossed sight gauge on the side of the bowls over a flow meter; Variability in product viscosity makes the flow meter inaccurate, and that adds up over several loads. In fact, when using totes, they’ve seen discrepancies as high as 50 L (13 gallons) at the end of a day.
There was also a humble 1994 cube truck to service the other sprayers with diesel and chemistry, and a 27,250 L (7,200 gallon) water truck. AU gets their water from municipal stations, and one was conveniently located across the street from the yard. It’s a fast fill, and while there’s rarely a line up, they still make sure to fill each night to ensure an efficient start the next morning.
Float trailer
Chatham-Kent and Essex are big counties. When Paul ran the numbers on engine hour depreciation, the operator’s time, fuel, maintenance, and tire wear, floating the sprayer between jobs made sense. So, he uses a 12,100 L (3,200 gallon) float trailer to transport his Deere 412R.
He chose the two-bowl Phiber DASH 2.4 because they use a lot of jug formats with this sprayer. The left bowl (J) is a push-to-rinse system and on the right (R), a knife. This is handy for co-packs. For example, Veltyma DLX is a co-pack with one larger and one smaller jug. The smaller jug gets upended on the rinser and the larger jug gets spiked on the knife. Spiking is faster, but there’s always a chance of stabbing yourself, so better to spike the larger jugs.
8:05 – Heading out
While I waited, Paul circle-checked the float trailer. Then he flipped open the tractor trailer hood and climbed inside to get it to start! He explained that he had to manually operate the fuel pump because the electrical was cranking too slowly. This truck had almost 1,000,000 km on it and fixing the pump was going to be ~$7,000.00, so this little work-around was fine with Paul. Plus, it’s great anti-theft security.
We drove on narrow county roads which required us to lean on the gravel curbs. Paul noted that it typically kicks up a lot of dust and aggravates the people driving behind him. It can spur them to passing unsafely. But since we’d had so much regular rain this season, there was no dust and people seemed more patient.
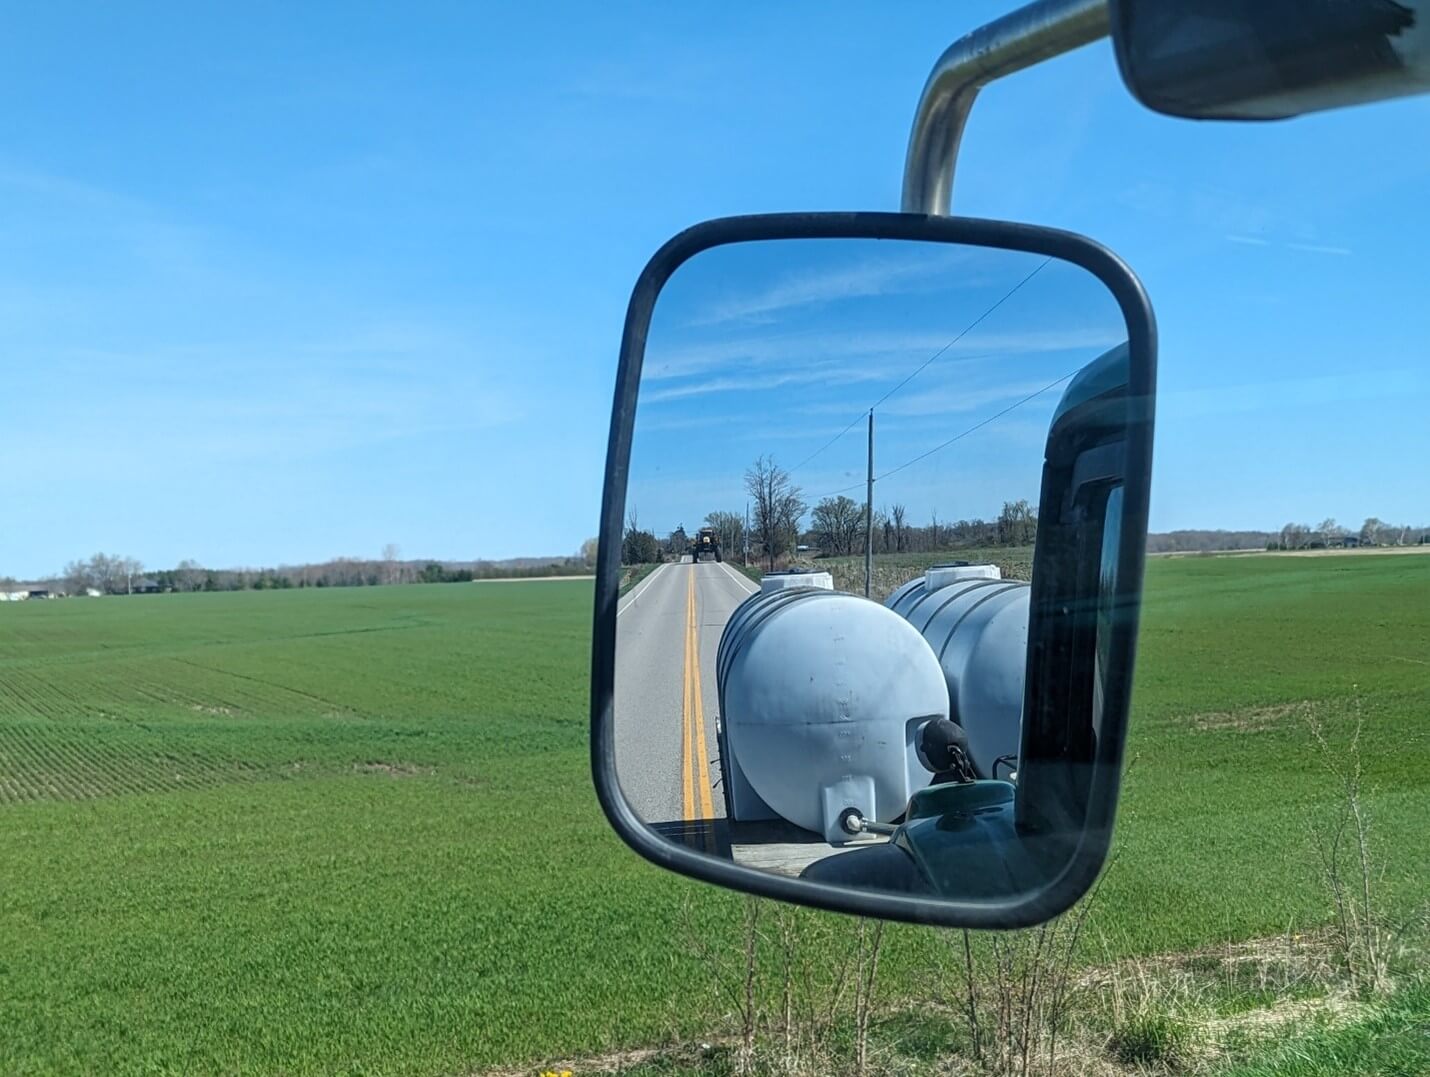
This isn’t actually Paul, but only a few weeks after spending the day with him I ended up driving behind a sprayer. The photo op was too good to miss. and yes, I passed him.
8:18 am – Loading
Now at our destination, Paul found a safe and accessible place to park and began untethering the sprayer. That consisted of removing the four chains with turnbuckles that secured the sprayer to the trailer. He always does this first, so he doesn’t forget before backing it off… ask him how he knows. This took about two minutes to complete. Then he hit a switch under the sprayer to send up the airbags and grabbed some gloves to start filling the inductor bowls.
As Paul was pouring chemistry into the inductor bowls his phone started ringing. He said he never answers when he’s focused on loading. It takes time and attention to ensure it’s done right, and he didn’t want any distractions. Paying a little extra time and attention now means avoiding costly issues later.
This was a 54 ac job, but Paul was adding enough for 60 acres because he didn’t want to run short. A little leftover fungicide on the next job (soybeans) would be a nice bonus for the client. Each jug was emptied, rinsed immediately, had the cap replaced and was dropped back in its cardboard box. The water truck operator would grab them later when he came with our refill. Removing caps and labels for recycling is a rainy-day job.
Prepping jugs and cardboard for recycling is rainy day work.
The loading process
Perhaps I should have explained sooner, but here’s a short and generic description of the chemical loading system. Product gets added to a conical inductor bowl. This can be via jug (poured or knifed), or from bulk containers via gravity or transfer pump, or dry products get blended with a recirculating agitator. One of several bowls might be filled, each with their own product, or one bowl can be filled and emptied serially. Then the operator starts the carrier pump and begins pushing carrier (usually water) into the sprayer tank. Once enough is loaded, a valve at the bottom of the bowl is opened and the Venturi effect creates suction to draw the chemistry into the carrier stream. Then a second valve is opened to activate a rinse head in the bowl, or this is done manually using a hand-held hose. This process can then be repeated to separate products and control mixing order. Finally, it’s followed up by more carrier to rinse the lines and finish filling.
Alternately, the suction pump on the sprayer itself can draw in carrier and the induction bowl on the side of the sprayer can be used to add chemistry. In a similar fashion, onboard water is used to rinse the jug and the bowl.
Paul used a hybrid of these two methods by engaging the pump on the tender system and the pump on the sprayer simultaneously to speed up the process. There are some caveats to doing this. The concern is that some formulations may cause damage to the sprayer pump, but Paul feels there’s so much carrier water following behind the chemistry that it flushes the pump and the entire line. Here’s how he did it.
Paul backed the sprayer off the trailer and hooked up to the front-fill. He started the pump on the DASH to add about 750 L (200 gallons) of water to the 4,540 L (1,200 gallon) sprayer tank. This was not the ideal “half full”, but unless he’s anticipating a mixing issue, that’s all he uses. In situations when he’s pushing multiple products into the sprayer, he’s found that the tank can fill before he’s done. Ironically, that’s when it’s so important to start with more water, but I’ll get off my high horse now.
He had already poured or knifed products into the bowls, so he opened the valve under the first, drawing the contents into the water stream before rinsing the bowl down. Then he did the second. Then he walked over to the sprayer and started the sprayer pump to add a “pull” to the “push” and speed up the fill before returning to the DASH to wait.
Paul said he’d installed an Accu-Volume on his Miller sprayer (and loves it) but saw no need for it on the Deere. He said the float in the tank quickly and accurately responds to the level in the tank. At that point the sprayer registered as “full”, the sprayer pump automatically shut off and the valve closed. You could hear it happen. But the DASH was still pushing and would quickly stretch and damage the hose, and even cause leaks.
That sound was Paul’s cue to quickly shut off the DASH pump. Then he closed the Banjo quarter turn valves on either side of the connection and disconnected the feed. He said he never pushes UAN through this system. Ag retailers don’t use flow meters with UAN because they can be inaccurate – instead they use weigh scales. However, it was too hard to navigate an oversized tender truck onto a scale, so UAN got loaded directly.
At 8:32 we were filled and ready to go. That was 14 minutes from the time Paul started untethering to when he started backing the sprayer off the tender truck. And it would have been a lot faster if he hadn’t taken time to explain it to me.
8:35 am – Job 1
At the edge of the first corn field, Paul unfolded the boom and set up the monitor. We would be applying 20 gpa at 60 psi and travelling about 12 mph. When spraying corn, Paul tends to travel between 10 and 14 mph. He double checked that the pneumatics he’d switched on earlier had lifted the sprayer high enough to clear the corn.
One of the chemical companies had given him a set of Low-Drift Air 11005 flat fans (PSLDAQ1005) to try, and this was his first time using them. We immediately saw that they were not all pointing in the same direction (or even alternating). They were just on willy-nilly. We figured it wouldn’t matter since we were only just clearing the tassels, but it tweaked both of our latent OCD personalities and we decided to fix them next chance we got.
Nozzles tilting at windmills – just not all in the same direction.
We finished at 8:59 am and found we’d covered 51 of the estimated 55 acres, due in part to a few missed strips and rounded-off corners. Why did we miss them? Read on.
Fungicides versus herbicides and fertilizers
I’d tagged along during fertilizer and herbicide applications, so I began to notice that overhead fungicides in corn seemed to follow different rules. Here are some observations I made throughout the day:
It’s not ideal to have to stretch a tank of herbicide, but you can if it’s not too dilute. And you can always go top up if you really must. However, for fungicides, you absolutely do not want to run short because that means increased trample. You can stretch the tank a little, but if it means running over corn, then leaving a few “test strips” and unsprayed corners is the profitable choice. Quote from Paul: “The most important part of fungicide in corn? Don’t run over the corn.”
Paul felt sectional control was more than enough resolution for fungicide applications in small/medium sized fields. The uniformity and product-savings associated with nozzle-level resolution (e.g. PWM with turn compensation) pays with herbicides and expensive fertilizer, but not fungicide.
A low and steady boom is ideal, but not critical for corn fungicides. Increased drift potential and a loss of coverage uniformity are still bad practice, but rather than slow down and drop the boom, we leaned into maintaining our speed and raised the boom ends until they were clear of the tassels. Even then, the centre rack was still deep in the canopy. C’est la vie.
9:00 am – Job 2
Job two was the for the same customer, so all we had to do was cross the street to a 60 acre soybean field waiting for an application of Delaro Complete. This time we were full in seven minutes (because I didn’t ask silly questions) and we were starting to run short of water. We called for more.
I haven’t mentioned it, but the Deere was equipped with Precision Planting’s ReClaim recirculating booms. He was actually one of the prototype testers, having installed it on his old Patriot a few years back and his Miller as well. I’ll discuss the system in more detail later on. So, at 9:10 am we started recirculating the boom to dilute the residual Veltyma DMX and prime the Delaro Complete. Veltyma DMX has some “greening effect” on soybean, so while a full dose wouldn’t hurt anything, it would leave a conspicuous green triangle at the edge of the field that no one wants to see.
We drove the perimeter manually. The ruts left from such a wet year kept tugging the sprayer, so Paul steered with a light touch, correcting when the wheels pulled. Once we got to the interior, we were applying 20 gpa at 13 mph. Paul relied more on autosteer (although he still fought the ruts a bit) and took the opportunity to text customers and get in touch with staff. Just as when he’s focused while loading, never taking a call, he doesn’t take them when spraying field boundaries. At 9:39 we were empty and done.
Acquiring and scheduling customers
I asked how AU found and scheduled customers. Paul said that roughly 40% of their business came from contracts with ag retailers and the remainder was direct. AU works with a few ag retailers, and they don’t all operate the same way. Here’s how it was explained to me.
Ag retailer 1 acquires a customer and sells them any number of agronomic services, including crop inputs. Then they use their own sprayer, or subcontract someone like AU to spray those crop inputs. AU has the option to decline a job (perhaps it’s too small, too distant, or generally undesirable), but they can’t do that too often. If they accept, they pick up the chemistry and apply it within 24 hours to avoid long-term storage.
Ag retailer 2 has a different arrangement. In this case Paul refers to a project management app called “Monday.com” which allows him to review and select open jobs. Once again, they pick up the chemistry and apply it within 24 hours.
AU also takes on customers directly. Weather events and breakdowns are problems for farmers but represent opportunities for contractors. AU is often hired by large farming operations (e.g. >1,000 ac) when they can’t keep up, and this is far better than chasing 10-15 ac fields.
Juggling all these customers can be challenging. In the winter, the core, repeat customers are penciled into the schedule. However, in the chaos of fungicide season, the ag retail customers get priority because of contractual obligations. And, of course, AU is always open to opportunities and slots in new jobs as best they can. They take advantage of social media while operating because Paul believes it’s important to stay involved in the community, but also because it’s a means of free advertising. People see when they’re in the area and it’s resulted in lots of jobs.
Duck hunting
I debated including this in an already epic article, but it was too interesting to leave on the cutting room floor. Paul also described a long-standing niche job working as a land manager for a few private “duck-farm” operations. Nearby Mitchel’s Bay is some of the best duck hunting in the world because of strategically placed duck-farms next to marshes or lakes. They grow corn to attract the ducks, then mow parts down to make pathways for boats, and then flood the fields using dikes and pumps.
These clubs aren’t necessarily big revenue generators. They’re perks for businesses to offer employees, or locales for casual business meetings, or maybe just status symbols for the wealthy elite. Given that they spend a lot of the year flooded, the ground is tough to spray because it’s always soft. Sprayers can’t go in full, and that tends towards premium fees for crop management.
Paul sprays for a few of these operations because he finds the whole practice fascinating. And, as a duck hunter himself, he’s permitted access to places most never see. There’s no such thing as free corn, Daffy.
9:43 am – Water fill
The water truck arrived and six minutes later we were topped up. Then it left to go support the Miller about 30 minutes away, promising to come back to us right after. Paul appreciated not having to go back to the yard for water – how can you ever be satisfied with coach after you’ve flown first class? We headed off to the next job.
Paul made this look easy.
9:51 am – Job 3
This 50 acre soybean field abutted a tomato field, and after seeing this sort of thing all season I wondered aloud if buffer zones were just a white lie that we tell ourselves. Paul chuckled and said there’s generally no stress when spraying fungicide this close to a sensitive crop, but herbicide would be tense. He changed fields on the monitor, verified that he was applying the right amount and started spraying. He noted there was a soft area in the field where the owner replanted soybeans. We avoided it.
This was one of the direct customers and not an ag retail client. The customer was a tradesman that left the crop protection choices to Paul. Custom operators can have a lot of influence on their client’s product choices because they spray so many acres with so many chemistries. In order to better guide his clients, Paul makes an effort to get involved in product testing and performance trials. But, as a sprayer operator, he’s not only interested in efficacy and price, but also ease-of-use.
Running a product comparison trial
For example, powdered manganese plugs a sprayer horribly while liquid formulations are far more forgiving. Another example, perhaps one product is 1 L/ac while another is 2 L/ac. Handling less is always easier. Or perhaps all this is trumped when a customer is swayed by loyalty points, which are issued by some registrants to reward a customer for using their suite of products.
We were done at 10:11 and found we’d covered 47.5 of the 50 acres because we skipped that wet, replanted area. That left about five acres worth of spray mix in the tank that we’d have to consider on the next job.
Recirculating booms
Paul secured the sprayer to the trailer, and we hit the road. While we drove, he talked about why he felt a recirculation system was necessary. Beyond the savings in chemistry and water, he said it was tricky charging the boom on some of the farms in the county. Severed lots meant more homes and private gardens, and that limits where it’s safe to prime.
Precision Planting released their aftermarket ReClaim recirculating boom a few years ago. We’ve written about it. Basically, it relies on dropping the pressure below the ~10 psi required to open the check valves in the nozzle bodies. So, no shut-off valves required. However, some Deere pumps won’t operate under 20 psi, which requires a work-around. Despite having that fix in place, we still saw nozzles dribbling while we were recirculating. Obviously not ideal, but Paul said it cost about a seventh of what the factory option would have cost, so he could live with it.
But there are other points to consider. For example, the sprayer doesn’t know the feature is there. So, when recirculation is engaged the sprayer “thinks” it’s spraying, and as liquid passes the flowmeter, the display shows the volume dropping… but it isn’t. As a result, the operator must know how much liquid circulated and manually adjust the volume prior to spraying.
And this system isn’t plumbed to flush the lines from the clean water tank. And it increases the length of hose that needs to be rinsed. And while you can recirculate glyphosate and UAN, many operators won’t do it with sticky products like atrazine or dicamba, preferring to just prime normally and keep them out of the recirculation lines.
While Paul and I were discussing all of this, and you can’t make this stuff up, the second operator called to say they broke an elbow on their recirculation line. To their credit, Precision was out there like a shot and had it mended in an hour (amazing service). But the delay meant we had to redistribute some of the remaining jobs. It was decided that Paul would take on some extra work and then both operators would meet up at the end of the day and split the last job.
10:50 am – Job 4
We parked, dismounted from the trailer, loaded and taxied to the headland. Paul said it was another 50 acres of corn, but I saw something was different. He treaded out the tires to a 138″ spacing to align with what I was told was a 23” corn spacing. Until now, we were on a typical 30” planting architecture. I soon learned that I didn’t like 23” corn. Tracking between such tight rows without trampling everything was a nightmare.
Here are two videos. We’re driving 30″ corn in the first and 23″ in the second.
I asked if Paul had tried row feelers, but he said they didn’t work on such tight spacing. In any case they got in the way when he used his float trailer. So, I watched as Paul studied the row ahead and referred to the feed from the cameras, micro-adjusting the steering for the entire 47.8 acre field as he fought to stay between the rows. It felt like forever, but we were done at 11:24 and back on the road for tendering a few minutes later.
11:38 am – Job 5
As we drove alongside this 45 ac field to get to the entry, we saw rows of sweet corn planted on the perimeter (surprise). Paul said there was a variety trial planted in the centre of the field somewhere as well and that we weren’t supposed to spray it. And it was another 23” row spacing.
Once again, we found it hard to stay on course. Just for added fun we got pulled by the planter draft and the occasional guess row. We finished at 12:10 pm and planned to meet the water truck. As we left, Paul reset the treads to 120” from 138”. Never good to forget that bit – again, ask Paul how he knows.
1:07 pm – Job 6
After a short and uneventful drive to the next client, we parked, loaded, and unfolded at the headland of a 45 ac cornfield. As we sprayed, Paul was on the lookout for a bridge that would give us access to another, smaller field. It turned out to be a substantial land bridge, which disappointed Paul because he was hoping to take me over a rickety little wooden bridge. The buddy seat was rough enough without testing its absorptive qualities as well, so I was good with it.
There were plenty of obstacles in this field. Paul was well acquainted with “the tree”. They’d had dealings in the past. I asked about wind turbines, which were all over the county, and I was surprised that he liked them. All turbines in the area have associated hard-packed lanes leading through the field. Paul took advantage by parking on them and filling there if needed. Plus, he watched them to monitor wind speed and inversion situations.
Still on the subject of obstacles, we found a field of peppers hidden in the corn. We left the test strip there. As we made these on the fly decisions, Paul wondered how an autonomous sprayer would handle all these little surprises. A good question.
I was finding the rows a little hypnotic and said so. Paul said corn was hard to spray day after day. In windy conditions, the tassels sway and it can make an operator dizzy. Some operators slow down to 10 mph or use row feelers to stay on track. We finished at 1:37 and when we got back to the trailer, two new jobs came in over the phone. Paul decided that his other operator could absorb those. We got ready for what might be our last job – rain was forecast
1:58 pm – Job 7
Full again, this 74 acre corn field would also get a test strip. Paul reiterated that it’s better to trample a field once, and not go in and out to get more spray mix. So, we filled for 70 acres spraying at 17 gal/ac and 9.6 mph to empty a single tankful as accurately as we could.
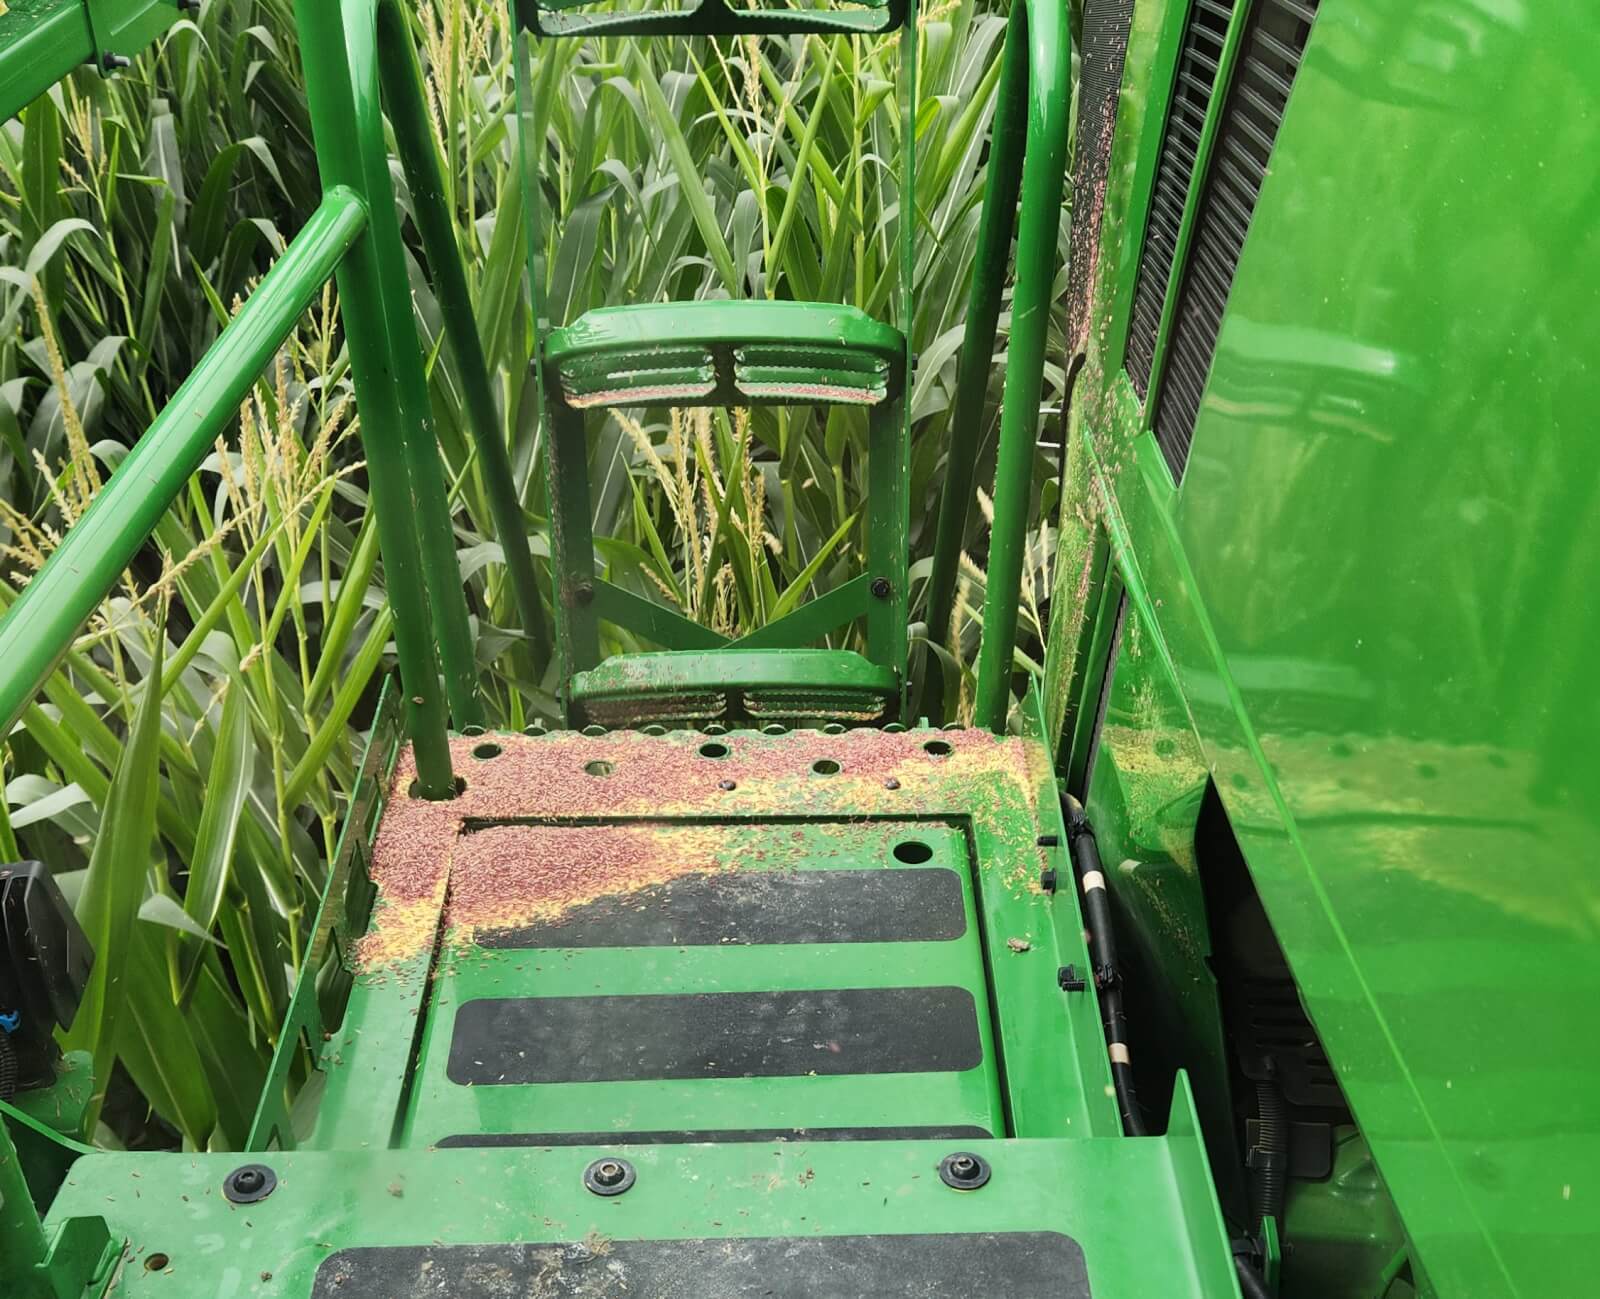
I watched as the pollen and anthers broke in waves over the hood and onto the steps. The radiator fan periodically reversed to blow it all out, but not as frequently as we needed. Paul occasionally did it manually. The sound of corn scraping and hitting the sprayer was loud. Paul said corn can beat the paint off a sprayer and damage the side induction bowl – wow. Carbon filtered cab or not, my pollen allergy was driving me crazy, and I was glad this was our last job. We were done at 2:37 and back on trailer five minutes later.
3:30 pm – Back at the yard
As we pulled into the yard it looked like rain was indeed coming. We weren’t worried about the fungicides we’d applied because they were rainfast in an hour. But it did put a premature end to the spray day. We’d covered more than 365 acres in the Deere, which was a light fungicide day for Paul. Combined with what the Miller did, AU covered 735 acres.
As I was packing to leave Paul asked if I was interested in seeing his new battery-powered backpack sprayer. I was, but I didn’t realize he’d put me to work spot spraying weeds. So, I suppose we actually covered 736 acres that day: 735 in sprayers, and one manual. Worth it.
It was May 16th, and I was standing at the front counter of Clean Field Services (CFS) in Drayton, Ontario, looking forward to an interesting day in the buddy seat. While I was waiting on the sprayer operator to check and fill the sprayer, I asked Todd Frey, Customer Service Rep, to give me some background into the company.
Clean Field Services
Todd’s father, Dennis, started spraying for a neighbour in the 1990s using a truck-mounted skid sprayer. In 2003 he began offering custom application services from their Drayton location, and in 2009 incorporated as CFS. Primarily offering contract application services to small fields (<20 acres), they also offered scouting and agronomy services, sold seed, and created nutrient management plans.
A big part of the business is liquid fertilizer. Many local retailers are set up to apply dry fertilizers, but here they pre-blend liquid fertilizer and can fill a sprayer in three minutes thanks to their new John Blue, 20 hp pump with it’s 4” inlet. More on tendering, later.
Scheduling
Todd explained that today would be all about pre-plant herbicides in soybean and corn. The farmer tills, then CFS sprays, then the farmer tills again to incorporate the herbicide before planting.
Much of the scheduling is arranged over the previous winter, but plans had to be flexible to accommodate changeable weather. Case in point, there were originally six jobs scheduled for today, but two were added at 6 am when clients called to ask for last-minute service. The wet spring was keeping farmers off their fields, so planting pressure was mounting, and sprayer scheduling had been particularly tough. Todd tells people “We’re not 911 dispatch!”, but ultimately does his best to accommodate the short notice.
That’s when Brendan Bishop came in to collect me. This was Brendan’s second year as an operator having started in 2023 as a tender truck driver and “graduating” mid-season to spraying. As I followed him out, I wondered how he’d stack up compared to the older, more experienced operators I’d worked with. Spoiler: Brendan had skills.
The Sprayers
CFS owns a John Deere 410R and a 4038. They also have an operator on retainer who owns his own 4030. CFS used Rogator in the past and Apache before that. The Rogators featured a lot of flow capacity, making them great for spraying 28%. CFS switched to Deere for the service and to take advantage of a few technologies I’ll describe shortly, and now they can stream liquid fertilizer at rates as high as 46 gpa at 14 mph.
Today, we’d be in the 410R, which featured pulse width modulation (PWM) and boom recirculation. I was told that customers appreciated the optics of not wasting up to 40 gallons on priming. But the sprayer also featured direct injection from four, 50 gallon tanks, and that puzzled me. Why would a sprayer have two seemingly incompatible features? No one would inject product just prior to the manifold and then circulate it right back to contaminate the tank.
Brendan agreed that they were mutually exclusive, but both had roles in minimizing waste and downtime from priming, rinsing, and custom spray mixes. For example, an early pass over corn might have Marksman and Armezon PRO in the tank, and then Roundup could be direct injected at rates specific to the weed pressure. On the other hand, if he didn’t need direct inject for custom mixes, he could utilize recirculation to avoid priming.
The sprayer automatically disengaged recirculation when direct injection was operating. That restriction could be over-ridden, but you couldn’t run them both by accident. Nevertheless, his policy was to always take a breath before engaging either system because a mistake might be irreversible and require a purge and refill.
8:30
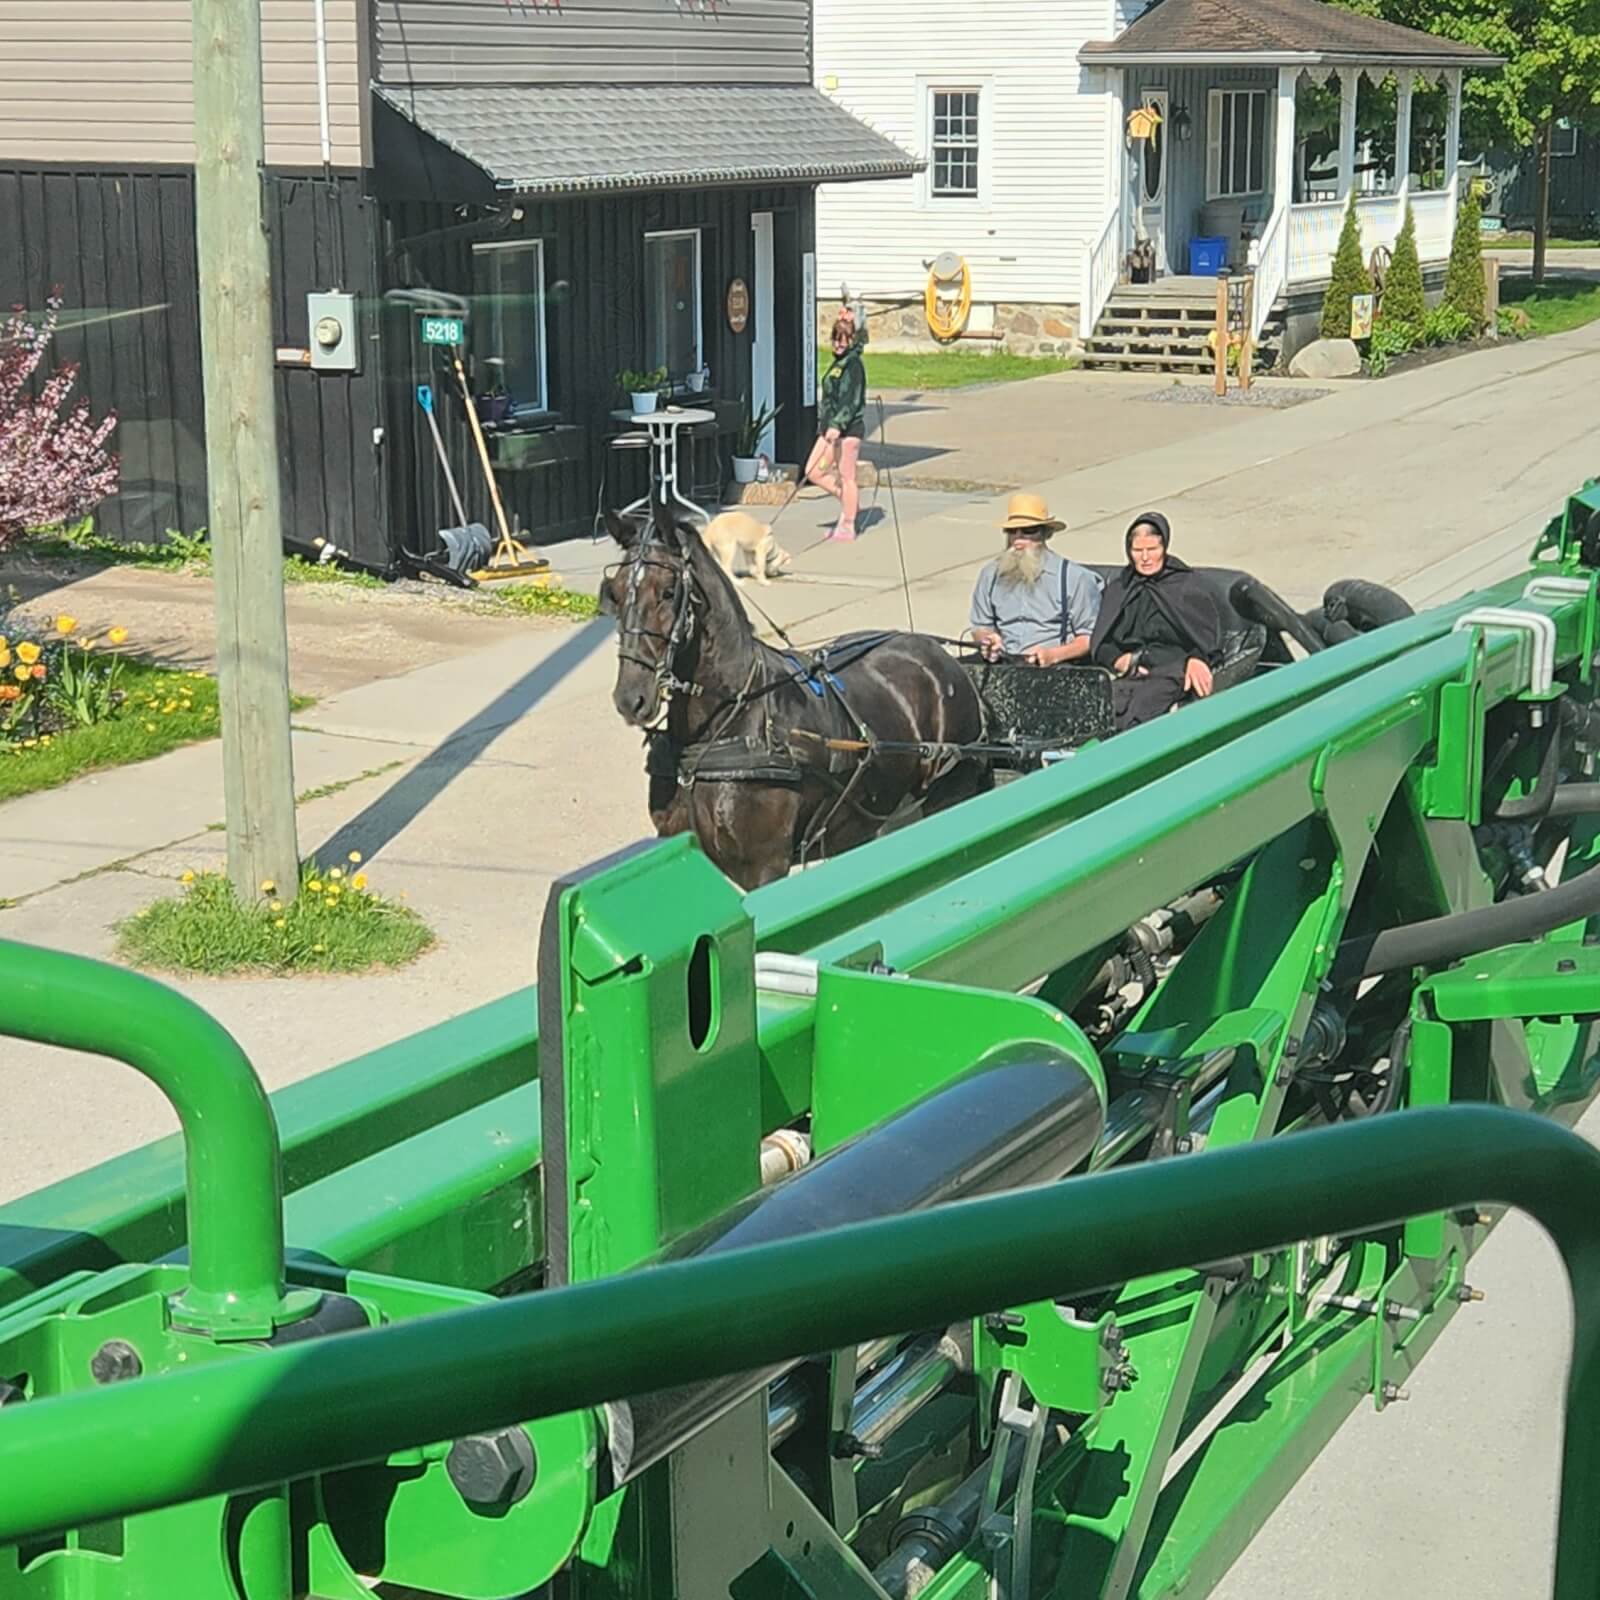
We left the yard and cruised down country roads at 40 mph until we hit the more populated regions. This part of Ontario had a lot of Mennonite residents, and their horse-drawn carriages required a wide berth. That got particularly tricky on narrow roads and single-lane bridges, but Brendan was patient and obviously practiced.
We arrived at our first field at 8:50. We parked at the edge and started unfolding the boom as Brendan called dispatch on the cab radio. The field was 15 acres of Roundup ready corn, and we’d be spraying a pre emerge herbicide in 28% UAN at a rate of 20 gpa. We knew all this before we ever left the yard thanks to CFS’s operations management system.
The AgLogic Operations Management System electronically assigns work orders (e.g. chemistry, field location, field boundaries) to the equipment, allowing dispatch to track, schedule and route their assets. It also pushes weather information and any special notes to the operator. The AgLogic tablet and the John Deere monitor are supposed to be compatible with one another, and it was generally slick, but there were a few glitches.
AgLogic and the Job Centre monitors showing how the boundaries were different for the same field. The operator has to make a commonsense call.
Dennis was on dispatch, and Brendan asked if he should send for Simon, their tender truck operator. He was going to need water for the next job and had planned this job to end as empty as possible. Dennis agreed to send him as Brendan noticed aloud how rough the ground was – this field had only just been plowed. Dennis said they’d had to wait for the farmer to plow and warned Brendan of a particularly bad patch that he was familiar with. Brendan signed off and smiled as he warned me to hold on tight. Then he hit start on the AgLogic work order, and we were off.
He wasn’t joking – this ride would have qualified as a theme park roller coaster. I’m sure I left hand and face prints all over his windshield. He had to turn off boom track and go manual and had to cut a second headland. It was hard to hold the rate steady because our 4 mph speed dropped the PWM to the minimum 25 PSI and the duty cycle was maxed out.
Eventually we got up to a roaring 7.7 mph and by 9:25 we were done with less than two gallons left in the tank. While I searched for my kidneys, Brendan entered the summary into AgLogic: 19.65 gpa. He added a few choice comments to the file and in less than a minute he was done. CFS now had the information for billing with no hardcover book for the operator to mess up and no bad penmanship to decipher. As I said, slick. Have a look at a field ticket, here.
9:30
We waited in the client’s yards for Simon. Brendan said he’d fill wherever he needed to; on the shoulder of the road or slinging the hose across a ditch into the field. But a client’s yard was always safer and therefore preferred. It was worth waiting.
According to the work order, the next job was 15 acres of Roundup burndown at 12.5 gpa, so Brendan was doing the math on how much water he’d need (plus one acre’s worth for buffer). Simon showed up at 9:42 and we were loaded by 9:45. Just before we hit the road Brendan called dispatch to ask where to send Simon next. Efficiency takes planning.
9:54
We parked at the field entry and Brendan engaged the recirculation to push the remaining UAN and pre-emerge in the lines back to the tank to dilute them. Then he turned it off, engaged the direct injection of Roundup, and started priming the boom. This sprayer featured Auto Boom Prime: The operator set a target displacement volume (in this case, 40 gallons) and when the flow meter reached that value, you were primed.
As we waited Brendan explained that we weren’t doing anything today that couldn’t handle a little Roundup, so even if it somehow did circulate back to the tank, it was no big deal. He started the work order log at 10:02 checked for any warnings associated with the field before we were off again.
This was a narrow field. So narrow that we would likely overlap in the middle just from spraying the boundary. Brendan drove that first side manually, cleaning up the corners and margins while skillfully dodging fenceposts as best he could. Nevertheless, we tested the breakaway section a few times. He was nonplussed and said that any operator claiming they’ve never nicked a tree or a fencepost is either too far away or lying.
I asked why he didn’t use fencerow nozzles with Roundup and he gave two good reasons: 1. If you succeed in burning out all the grasses, broadleaf weeds like burdock move in and cause new problems. 2. Overspray was too risky when the target field abuts another crop.
Regarding his second point, I saw what he meant as we turned to spray the rest of the boundary, right next to winter wheat. On the back of the joystick are the secondary controls, which Brendan used to nudge the boom a few inches left or right along A-B line, constantly adjusting for the wheat.
At 10:17 he closed the work order, which digitally winged its way back to CFS for accounting. We folded up and followed behind as we headed back to the yard for a refill. Going back made more sense than tendering since the yard was en route to the next job.
Tendering
CFS fills their 20,000 gallon holding tanks from their own well, which is 300 feet deep and rated at 4,000 gallons per hour. Instead of installing more holding tanks, they doubled the floats to half the refill time. In addition, they have a tractor-with-wagon tender system with a 4,000 gallon capacity (and four serial induction bowls). Their transport truck is strictly for carrier and has two, 4,000 gallon tanks. In total, they can have 32,000 gallons of water on hand.
They recently improved their transfer pumps to keep up with so many small acreage jobs. It used to take up to 25 minutes to fill a 4,000 gallon trailer. Now they can pump up to 480 gpm through 4” lines and fill that same trailer in less than 10 minutes. And they have two such fill systems so no one has to wait their turn.
Their efficiencies are now found in the logistics of planning jobs that avoid rinses and minimize sprayer travel time where possible. The company isn’t afraid of road miles, preferring to drive further between jobs to avoid having to clean out the sprayer. Floating the sprayer to save engine hours didn’t made economic sense for them since you needed a wide-load permit, time to un/load the sprayer and you couldn’t transport at night.
It wasn’t “Gone in 60 Seconds” but we weren’t there much longer than that.
10:57
The next job was an L-shaped field. Brendan noted that weird field shapes were par for the course. As we drove, he said that some fields were so tight that he had to fold the booms almost completely to fit while spraying. He said he’d sprayed fields that no 120’ boom had any business being in. He’d had sideview mirrors pushed against the cab and was happy the Deere plumbing wasn’t on the outside of the folded booms, because he’d been snagged by branches in other sprayers.
Speaking of the boom, he was using LDM 08 nozzles, and the height was set to 30”. He would have liked a lower boom, but it wasn’t realistic on these rough and rolling fields. This field was short and sweet, and we were soon headed out.
11:10
This field was 19 acres and once again I saw it was narrow, meaning a lot of manual spraying on the boundary and very little autosteer in the middle. Brendan scanned back and forth between the boom end, the monitor, and ahead of the sprayer as we drove along at 7.5 mph.
When I mentioned the lack of autosteer he said he didn’t get to use it as often as I might think. Many of the corn fields he sprayed were planted by farmers with no GPS, so while he did use the A-B lines, they were mainly to alert him to turns. The actual steering was manual as he followed the planting lines.
I should mention that Brendan established a new boundary for every field, even through AgLogic provided one. He elected to establish this new boundary because once he sprayed the perimeter the monitor could tell him exactly how much area was left to spray. So, he would spray the boundary, check the area remining, and use his cell phone to calculate the differential between the volume in the sprayer and the target rate. He did this now to ensure he had enough water for the last four acres. He wanted to end empty because he would be switching back to 28% UAN next. Based on his math, he pushed the rate to 20.5 gpa to use up the water.
These rate changes would be difficult (perhaps impossible) to achieve without PWM because it would be based on pressure changes, and not duty cycle. It might even require switching nozzles. This is also when direct inject shines as it could maintain the Roundup rate independent of the carrier rate. Brendan said that fields were somehow always bigger than expected, so he was a big fan of the flexibility these features afforded him.
11:28
Now we’re back in the yard to fill with 28% UAN. Brendan was planning on a six acre corn field in the Township of Southgate, which was about a 45 minute drive, so we had to fill precisely.
We arrived at 12:27 and had to ask the client where the field was on the property. Surprise! The client wanted us to do eight acres, or 25% more than we’d anticipated. There was no way we could stretch the load that far, so Brendan told him we’d drive all eight at a reduced rate and make up the remaining nitrogen later when he came back with drops. We adjusted the rate from 28.75 gpa UAN to 22.6 gpa and at 12:46 we were done spraying, and the job submitted.
12:51
Simon is back with water and Integrity for our next job in pre-emerge corn, which is why Brendan wanted to be empty of 28% UAN. By 1:02 we were full and headed to a 32 acre job spread over two fields. Brendan chose to do the smaller, four acre field first so if he had to make any rate changes in the second field, he could spread a smaller difference over more area. Clever.
But where was this little field? Turned out, it required us to drive through a swamp, flushing two ducks and a deer in the process. As if that wasn’t bad enough, we both started to laugh when we saw the field. The ground must have been plowed 10 minutes before we arrived because it looked like an earthquake had hit it.
There’s a good reason you don’t spray freshly plowed fields. Once again, I did my pinball impression and idly wondered if Deere didn’t install seat belts in the buddy seat because they were trying to dissuade people from using it. Even Brendan bounced around despite the air ride driver’s seat.
We were relieved that the larger of the two fields was a breeze. Brendan did his math trick and elected to nudge the 16.1 gpa up to 16.7 in order to end empty. By 1:45 we were off for our last tender of the day.
1:50
The last three jobs totaled 70 acres and required a single fill. We were moving into Roundup-ready soybean, so we’d be spraying Roundup Transorb HC (glyphosate) + Tavium (S-metolachlor and dicamba). Brendan said they’d clean the sprayer thoroughly afterwards if they had to, but it was preferable to schedule a series of corn fields for tomorrow because they wouldn’t be bothered by dicamba residue.
We met the tender wagon and Brendan and Simon started loading Tavium into the inductor bowls for transfer to the sprayer. Then Brendan hosed down each bowl to rinse them and transfer that rinsate into the sprayer as well. Afterwards Brendan used the inductor bowl on the side of the sprayer to rinse the jugs because he felt the water pressure was higher on the sprayer and did a better job of cleaning them out.
2:35
This was a 11.75 acre field, and it should have been simple… but it seemed nothing was. The work order map showed the digital boundary, but the actual plowed field was much larger. So, it was one continuous field and we were supposed to spray only part of it. Where exactly was the boundary?
Eventually Brendan spotted some unsprayed grass that hinted at where other equipment had driven in the past. That subtle visual cue would have been impossible for an operator to see in the dark.
As we positioned ourselves to start spraying we saw the note on the work order to “mind the garden”. Garden? What garden!?
Eventually “Eagle-eye” Brendan spotted a couple rusty, foot-long lengths of rebar hammered into the soil along the edge of the field. They were perfectly camouflaged to match the colour of the tilled earth, hungry to puncture the tires of the unsuspecting, and doing a very poor job of indicating a “garden”. Once finished, we primed the boom (40 gallons) on the field margin to have it ready for the next job.
3:05
According to the work order, this 37 acre job warned us of yet another small garden. This garden was emerged, making it easier to find, but also making it a nerve-wracking off-target risk. So, we literally steered clear of it, leaving a wide berth.
That didn’t stop the woman who was tending the garden from marching purposely out to sprayer to get Brendan’s attention. He stopped and braced himself as he climbed down to speak to her. We both expected he’d get an earful for spraying around those vegetables. After a brief exchange he climbed back into the cab and smiled. She didn’t chew him out – she chastised him for not getting close enough! You can’t win.
4:05
The last field was 20.5 acres. It was flat, square and promised to be a straight-forward end to a complicated day. We drove 9.6 mph on the headland and just as we were finishing the circuit, we saw tilled earth outside the boundary indicated on the monitor. Wait – is that bit planted, too? Are we supposed to spray that as well?
Brendan guessed it was an additional three acres. He’d asked Simon to load an extra acre’s worth of spray mix when we loaded, and I now understood why. He did some quick math and said we’d have enough if we dropped the rate a bit.
We coasted back and forth over the field, watching the remaining volume drop on the monitor, hoping we’d make it. We considered adding rinse water to the tank to thin the concentration. That would give us enough volume, but we’d be diluting the chemistry too much. Then we figured if we had to we could empty the tank just to the point of starving the pump, add water from the rinse tank and push the ~40 gallons left in the lines from behind.
The tiny, unsprayed strip caused the PWM to flutter between one and three nozzles on that last pass. Neither of us realized we were holding our breath as we watched the spray volume drain away on the monitor.
And then we were done! It was a photo finish and we both let out an explosive gasp as we started breathing again. It was such a narrow victory that we climbed out to look in the tank, and I’m here to tell you, it simply does not get any closer than this. We bragged like successful hunters all the way back to the yard and told anyone that would listen when we arrived at 5:00.
As I packed to leave, Brendan asked Dennis if he had to go clean out the sprayer. Dennis said a little dicamba would help tomorrow morning’s pre-emerge applications, so no. But he smiled as he warned “Although, betcha someone will call in at 6 am to ask for IP beans first.” Driving home, thankful for my comfortable car seat, I wondered if they would.
Take Homes
Planning ahead is always good advice. However for a custom applicator, it’s absolutely critical. The goal is to be efficient and effective with as little risk as possible, and you can’t accomplish that unless you know where you’re going, when you’re going there and what to expect when you arrive; and not just the immediate job but minimum three jobs ahead. When time, manpower and consumables equal money lost, the stakes are high to have a solid strategy before you leave the yard.
Then again, rigid planning can be A BIG MISTAKE… unless it includes planning for the unexpected. Almost without exception, these fields were not as advertised. Most were larger than anticipated, so knowing how to stretch a load (e.g. dilution, changing rates, carrying a little extra, using clean water to push spray mix from behind) meant we could roll with the punches without leftovers or deficits. One strategy was to spray smaller fields first, so larger remaining fields could absorb a smaller, distributed differential. Another was to spray the headlands, calculate the remaining area, then determine a rate that fits the remaining volume in the sprayer. This all assumes you performed some solid sprayer math when you loaded, of course.
Autosteer, while awesome, was not used near as much as I expected. Small, irregularly-shaped fields that were recently ploughed, abutting sensitive crops and land-mined with “no spray” gardens meant manual headlands (maybe two) and slow speeds. And when the client doesn’t use GPS to plant, you don’t use it to spray except to alert you to turns. Anyone that thinks the operator can be replaced by automation should ride along in these conditions. There are lots of situations where we still need grey-matter and experience behind the wheel.
I’d been pestering Dan Petker to let me come along as he and his father Paul applied 28% UAN to the winter wheat on their family farm in Port Rowan, Ontario.
Me: “Today?” Dan: “Nope – Wheat’s not at the right stage.” Me: “Today?” Dan: “Nope – Rain in the forecast.” Me: “Today?” Dan: “We’ll see if the ground can hold a full sprayer. I’ll let you know.”
April 26th, 8:00 am
My first lesson was a reminder that farming requires a lot of advance planning and preparation because ultimately, it’s opportunistic. The Petkers were toeing the start line as they focused on weather forecasts, crop staging and field conditions. As soon as they determined that the wheat in the tram lines would bounce back rather than get mashed into the soil, they were ready to roll. I suppose I was opportunistic as well because as soon as I got the thumbs-up I dropped everything and raced to their farm.
10:30 am
When I arrived, I found Dan filling their tender wagon in the yard. All their farm inputs are stored in their chemical shed, including 27,000 gallons of 28% UAN. The wagon had two, 1,000 gallon tanks which Dan was filling from a 2” line. He said that as the season progressed, they would move up to faster fills by swapping to a 3” line. They weren’t in that kind of rush today and he didn’t want to have to lug the heavier line around if he didn’t need to. Fair enough. At that point Paul radioed from the sprayer to tell Dan he was ready for his first refill.
As we drove to meet Paul, I learned that the goal was to spray two fields totaling 200 acres. A single, 1,000 gallon tankful would cover 20 acres. Dan noted that these soils were a loamy silt and clay mix that held nitrogen very well. On sandier soils, farmers often choose to split the application where a smaller amount is applied earlier in the season and the remainder later, but Dan said it never paid dividends on these fields. Of course, that reasoning may have been moot since it was such a wet spring; They couldn’t get out earlier even if they wanted to.
The two fields were within a 5 km radius from the yard, so nothing was more than 10 minutes away. The county roads were narrow, but throughout they day I saw that the locals knew how to share the road with farm equipment; lots of polite waves and no one risked their necks trying to pass. Good to see.
10:40 am
We pulled up alongside the sprayer and Dan started filling as I greeted Paul, who’d I’d ride with for the rest of the day. We were using their John Deere R4038 equipped with Pentair Hypro six-stream fertilizer nozzles (FC-ESI-11015’s) on 15” centres. The Petkers used 06’s the year before and found they had to drive too slowly, so investing in these larger nozzles was a productivity booster.
While filling, they both watched the sight gauge on the side of the sprayer. I asked why they didn’t use a flowmeter and they said it could be off by +/- 10 gallons, so if the sprayer was level, the sight gauge told them what they needed to know.
10:50
I joined Paul in the cab and we drove into the field. Paul pointed out the pink field boundary on the monitor and grimaced at the rounded corners that were established during planting. He wanted to reset the A-B lines and square off those corners. His reasoning was to ensure weeds didn’t grow in the margins and affect yield. However, he also said it looked terrible and I got the impression this was as much about pride in a job well done as it was yield.
We backed into the corner. Paul explained that the rate controller “hunts” a little as the sprayer speeds up over the first few meters and wouldn’t apply a full or consistent rate. By temporarily disengaging it until we got up to speed, we would avoid the weed escapes common to field corners. We’d be applying a slightly higher rate than required for those first few meters, but it was the lesser of two evils.
He set the first pass using GPS: “Got-Paul-Steering” and I watched as the breakaway section started snagging the treeline on the edge of the field. I asked if that was a problem and he replied that he was driving slowly, and it didn’t bother anything. It was important to get those margins and the trees were always growing and dropping branches, so hits were inevitable.
Soon we were back in the hands of GPS-guided autosteer and rate control and moving at a respectable 12 mph. 20 acres later we’d sprayed the 1,000 gallons and were headed back to meet Dan for a refill. On the way we noticed a triangular area that we missed while I was distracting Paul with questions. He said we’d double back later and let sectional control take care of it. Paul loved sectional control.
11:30
Soon Dan was empty, and we were full, so we got right back at it. I wouldn’t describe the field as hilly, but it was far from flat. On occasions where the sprayer dipped significantly, one side of the boom would sometimes kiss the ground while the other hung precipitously in the air. We had the boom height set to about 36” but Paul was manually raising each side if the boom got too close. You can forget the fantasy of sitting back and letting the machine do all the work; It certainly wasn’t the case, here.
Slower travel speed and a reasonably-low boom are the best practice for crop protection sprays. However, streamer nozzles don’t form droplets and overlap was maintained, so I wasn’t worried about our lively boom causing drift or coverage uniformity concerns. I was, however, increasingly focused on my lower back and teeth. The buddy-seat didn’t have the padding or air-ride suspension Paul was enjoying.
When we hit level ground again, I began to appreciate the process of passing back and forth over a field. It was satisfying to watch the sprayer icon on the monitor filling the screen with blue as we covered ground. Like the old-school, low-res, 1980’s video games that ate all my hard-earned quarters. Then we were empty again and it was time to go beg for more quarters.
11:46
Dan was busy so we drove back to the yard rather than wait for tender. There was a Rogator on the road ahead of us and Paul pointed out the muck it was flinging from the tires. A quick peek behind us showed we weren’t tracking mud. Paul said it was because of their soil management practices – no-till left the fields better able to weather droughts and absorb rains. The Rogator was operating in fields that employed deep tillage and were full of standing water and now, muddy tire ruts. Paul pointed out a few such fields as we drove, and I could soon see for myself which fields were managed by the Petkers and which were not. In fact, I only saw one puddle of standing water in their fields that day when all around us were shallow swimming pools.
12:15
We filled, drove back to the field, and picked up where we left off. Paul noted they had to plant their wheat a little later than they would have liked because they were delayed getting the beans off. Despite that, he was very happy with the stand we were fertilizing. We were able to have this conversation because Paul (like Dan) did not listen to music or podcasts in the sprayer. He said it helped him focus and that he liked the peace. I think being alone with my thoughts all day would have driven me around the bend. And then we were empty again, so back to the yard.
12:47
We filled, drove back, engaged the A-B line, and started the last section of this field. I asked about sprayer sanitation. UAN is notoriously caustic and can cause compatibility issues with some products, so I wanted to know how diligent they were about rinsing or cleaning (two different things). Paul agreed that it was messy stuff and it got all over the sprayer. So, at the end of the day, they would perform a thorough rinse of the plumbing before washing the exterior out behind their equipment shop. We finished with 300 gallons left in the tank, so we elected to head over to the second field.
1:10
At field number two, Paul changed fields on the monitor and grumbled about the round corners on the boundary. He pointed out that the edge of this field wasn’t straight – it contoured along a wavy treeline. Paul briefly disengaged rate control, set the “A” point and started driving manually again, hugging the treeline and dipping in and out using Got-Paul-Steering until we’d cleared the trees. Now that the field boundary was straight, he erased the “A” point and set a new one before later setting the “B”. He looked over at me, anticipating my question, but I’d already guessed that Paul didn’t want to repeat that wavy line on every subsequent row. Instead, we’d now run parallel to a straight A-B line and let sectional control handle the overlaps on our twisty start. That earned me an approving smile. And to add to that feeling of pride, our tank emptied exactly at the end of that first row. Perfect.
1:27
Back at the yard for our refill, I thought about how long our previous fill times were compared to now. From this second field it was 10 minutes on the road, 10 minutes to fill, and 10 minutes back, so 30 minutes compared to maybe 15 for the first field. Longer than I thought it would be. At 1:48 we were back and spraying again and I was beginning to notice how technical this field was. We performed a number of three-point turns in order to back into corners while the monitor alternated between happy chirps and stern alarms as we passed over A-B lines. Then we were empty, so back we went for more.
2:41
To continue to video game metaphor, this field was an advanced level and the Big Boss was coming. Not only was the shape odd, but it had chain link fences, posts, more trees, a water course, and they stored some farm equipment on one part of it. Paul calmly negotiated all these obstacles with stops, starts, boom adjustments (either height changes or partial folds), and then, shockingly, asked me to drive.
Paul: “Line up the tracks.” Me: “I’m trying.” Paul: “Do not try or you won’t get it right. Do!” Me: “…what!?”
As a card-carrying Star Wars fan, I thought Paul was teasing me. His Yoda impression was perfect. I asked if he’d seen Star Wars and he replied that he was vaguely aware of it. So, he was being sincere, and I relaxed knowing I was in good hands. I even negotiated a few turns under his tutelage. But I confess I was relieved when the hydrostatic lightsaber was back in his capable hands.
3:04
Empty. Drive. Fill. Drive. Spray at 3:43. The last section was quick and easy and once we’d finished, we headed to their equipment shop to find Dan waiting. Dan pointed out the nitrogen all over the sprayer and reinforced Paul’s assertion that they’d rinse it out and wash the exterior off later that evening.
He drove me back to the yard so I could retrieve my car and we said our goodbyes. As I was headed home, I happened to pass their equipment shop where I saw Paul, a man in his mid 70’s that hadn’t stopped to eat and had been spraying all day, hard at it washing off the exterior. Wow.
Take Homes
I’m guilty of over-emphasizing the fill-time aspect of spraying because that’s the biggest time-suck on productivity. However, some tank mixes (e.g. SC’s) don’t appreciate being rushed, and while time is always pressing, there are those occasions where it isn’t mission-critical. Fill-time never came up on this job. There were, however, other aspects that deserved attention.
In the case of applying UAN to winter wheat on these irregularly shaped home-farm fields, it was more important to be attentive and manually adjust sprayer settings to fit the moment rather than always trust in the technology. Granted, the technology (namely rate control, boom leveling and GPS sectional control) was brilliant once we’d finished the headlands and dealt with any obstacles and topographical challenges.
I also appreciated that this family has been farming for many years. Dan and his father had a practiced rhythm that made it look easier than it actually was. Equipment was prepared, decisions were made, and everything was in place well ahead of the application. That included how they managed their soil and knowing how their fields responded to nitrogen. They communicated well, using digital records and redundant written notes to ensure everything was coordinated and going to plan, and that good planning made for a good day.
I feel it’s important to occasionally remind myself why I do what I do, and who I’m doing it for. With that, let me tell you a story.
I was recently asked to give a presentation about spray coverage and drift mitigation to an arborist organization. I agreed but harboured reservations. I’ve given talks of this nature many, many times, but I rarely work with arborists. In preparation I looked back through my files and discovered I’d spoken to them 10 years ago. Coincidently, that was also the last time I’d encountered an arborist.
So, what value could I possibly offer? My concern was that all I’d leave them with was a few “factoids” and the vague sense that they’d been entertained. But would I leave things better than I found them? What could I say that would move the needle and give them something actionable?
Fortunately, I was paired with a veteran sprayer operator and together we worked out a presentation / demonstration. It went over very well, and I was relieved that people were engaged and asked insightful questions. Crisis averted.
I believe the reason it worked was because I asked the operator about the real-world challenges (however unpopular) that he faced. We discussed and agreed upon a few lesser-of-two-evils solutions to share with the group. It was authentic, it was pragmatic, and it was appreciated.
As a result, I decided to dedicate some time this spring/summer to riding along with a variety of sprayer operators as they perform their jobs. If they’d have me, I’d promise to stay out of their hair, acting only as an observer. I wouldn’t make suggestions and I wouldn’t criticize. I would ask the occasional question and I’d watch to see where policy and reality crossed paths.
I was hoping for a few educational experiences that would inform my research trajectory and teach me a few tips and tricks to share at winter meetings. Perhaps I’d reinforce my understanding of spray application, or maybe I’d be forced to re-evaluate my position on what is a technical truth and what is a practical truth. At the very least I would get to see how professionals did their jobs, and which best practices got sacrificed when things didn’t go to plan.
And, while I was at it, I decided to keep a journal to create articles in the vein of “A Day in the Life”. You’re reading the first one right now and I hope you find it as interesting to read about as I did to live it. It’s unlikely you work in all the agricultural spaces I’ll be writing about in this series but keep an open mind. The potential for cross-pollination is enormous; Perhaps your “cousin” sprayer operator has solved a problem you face in your own operation.
And so, given our recent success, my first victim will be my new arborist-friend. You can read all about it here.
A quick selfie in suburbia as I’m guided through a day in the life of an arborist.