In 2016, Ontario berry growers were surveyed to determine the typical spray volume they used to apply unspecified crop protection products. For strawberry growers (day-neutral and June-bearing), the results spanned 50 to 1,000 L/ha (~5 gpa to ~100 gpa). In an earlier survey (2013), respondents specified 250 to 650 L/ha (~26.5 to 70 gpa) for fungicides, herbicides and insecticides. Miticide applications were as high as 750 L/ha (80 gpa).
This rather wide span of carrier volumes shouldn’t be surprising. No matter the horticultural cropping system, the choice of carrier volume reflects the operation’s unique pressures and priorities. These variables include, but aren’t limited to, operation size, spray equipment, crop varieties/staging, geography, and pest profiles. The ultimate goal is to achieve threshold coverage (i.e. efficacy) while maximizing productivity.
However, even the highest carrier volume reported did not reach the volumes required for those crop protection products intended to drench the soil. These products can span a range of 1,200 to 2,000 L/ha (~128 to 214 gpa). Experienced matted-row strawberry growers employ different methods to apply soil drenches, and we will discuss them later in the article. But first let’s address three common factors that must be considered:
Know the target
If (for example) the target is white grubs in the root zone, or phytopthora root rot, then the spray should be focused at the base of the plant in a banded application. Performing a broadcast application that covers the alleys as well as the plant rows may represent wasted spray. Knowing the target can help make the most efficient use of carrier.
Know the soil
Soil that is compressed or has high clay content won’t soak up water as quickly as drier, looser or sandier soil. If the beds are raised and resist absorption, much of the volume will run off into the alleys. This may not be desirable if the target is the raised bed itself. The following basic water movement principles come from the Manitoba Agriculture, Food and Rural Initiatives Soil Management Guide.
Water flows more quickly through large pores (sandy soils) than small pores (clay soils); water is held more tightly in small pores (clay soils) than in large pores (sandy soils).
Water moves from wet areas to dry areas (not necessarily by gravity) due to forces of adhesion and cohesion. This is called matric flow.
Water will not move from small soil pores to large soil pores unless conditions are saturated.
Know the weather forecast
Spraying on a hot, dry day means a higher rate of evaporation. As the carrier evaporates, the product will have less opportunity to infiltrate the soil. Conversely, applying product just before a heavy rain can result in a much diluted product being rinsed too deeply into the soil and beyond the target area.
Consider that one millimetre of rain on one hectare of land is 10,000 litres. That seems like a lot, but how deeply does it infiltrate into soil? One way to know is to use calculations based on soil porosity and bulk density. From these calculations it can be generalized that 25 mm of rain will infiltrate 45 mm into dry, sandy soil, but only 32 mm into dry clay soil. Remember, that 25 mm of rain represents 250,000 L/ha!
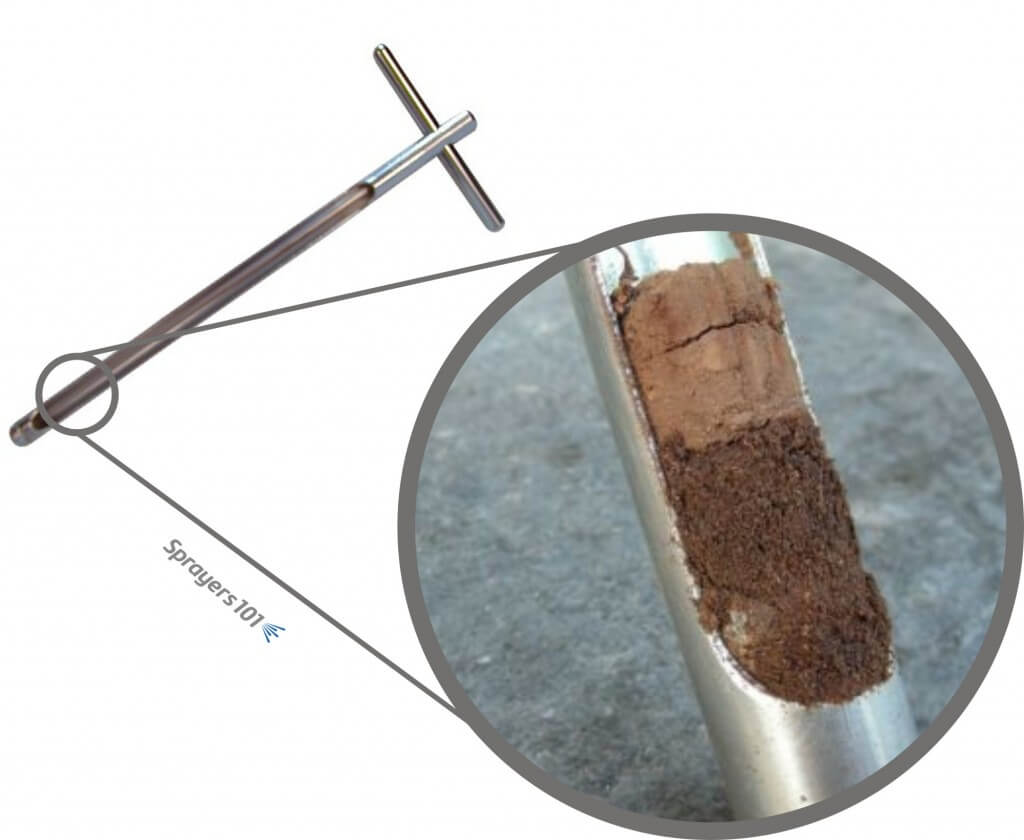
Perhaps the best way to know how far water will infiltrate the soil is to use a soil probe (aka soil sample tube). They can be purchased from local dealers for about $100.00 CAD, or they could be borrowed from whomever provides soil sampling services in the area. For the best results, perform this test in multiple locations in the field.
The soil probe. See how far water infiltrates soil by taking core samples.
So what methods do strawberry growers employ to apply a drench? Here are the top three:
1. Slow down
Some growers elect to use their existing sprayer setup, but they slow down to get more volume on per hectare. For example, if the grower normally applies 500 L/ha (53.4 gpa) driving at 5 km/h (3.1 mph) they would have to drive 1.25 km/h (0.78 mph) to achieve the 2,000 L/ha some labels require. If the sprayer tank held 1,500 litres (~400 US gallons) that would mean doing 0.75 hectares (1.9 acres) to a tank compared to the normal 3 hectares (7.5 acres). That would be four times as long, without considering the time for the extra refills.
Alternately, but related to slowing down, is double-pass spraying. In this case the tank is mixed at half-rate and the operator makes a pass through the field. Then, a second half-rate tank is applied immediately afterwards, ideally driving from the opposite direction. This effectively gives a full rate of product in a higher volume of water.
2. Re-nozzle
When slowing down is not enough (or not an option), some growers elect to re-nozzle. It may be tempting to increase the operating pressure to increase output on existing nozzles, but that makes finer droplets which tend to drift off target. The largest hollow-cone nozzles will only emit ~870 L/ha at 5.0 km/h (93 gpa at 3.1 mph) and that’s at 125 psi, which many trailed sprayers cannot manage. Further, many labels indicate a need for Coarse droplets in a drench, and hollow cones cannot produce such large droplets.
There are a limited number of flat fan nozzles that can achieve sufficiently high rates, and even then they must be used at slightly slower travel speeds. For example, the TeeJet AI11008 used at 70 psi will apply 145 gpa (~ 1,350 L/ha) with a Very Coarse spray quality at 4 mph (6.4 km/h). Driving slower can rise those volumes considerably. Alternately, streamer nozzles (e.g. TeeJet’s 5 or 7 hole StreamJets) require lower pressures (up to 60 psi) to emit as much as 2,310 L/ha at 5.0 km/h (247 gpa at 3.1 mph). The grower can maintain their travel speed, but will still have to refill more often.
3. “Wash In” the spray
Still another choice is to apply the product using the existing sprayer set-up, using a typical carrier volume, just prior to a rain event or sprinkler (not drip line) irrigation. For example, if the grower normally applies 500 L/ha (53.5 gpa), they would continue to do so. If the grower is relying on rain to wash the product in, it should be sufficient precipitation to move the product to the desired soil depth. Where sprinklers are an option, this can be controlled, and the depth of infiltration tested with a soil probe. Washing in the spray should take place as soon after application as possible to ensure the product is distributed evenly into the soil.
Thanks to Pam Fisher, former OMAFRA Berry Crop Specialist, and Anne Verhallen, former OMAFRA Soil Management Specialist, for their contributions to this article.
At first glance, spot sprays are a no-brainer. Why spray a whole field when you can save product by spraying just the weeds?
But then the first commercial green-on-green systems introduced user fees, complicating the cost equation. Companies sell the hardware, and charge a fee for use of their detection algorithms.
Currently, costs range from $3 to $4 per acre, and this fee is either applied once per season (no matter how many times the algorithm is used on a specific field) or each time the system is deployed. As of September, 2023, Bilberry (via Agrifac as AICPlus, but also via Goldacres in Australia and Dammann in the EU) was using the former approach, and John Deere with See & Spray Ultimate in the US was using the latter. Greeneye is not charging fees. For Green-on-Brown systems, the likes of Rometron’s WeedIT and Trimble’s WeedSeeker, no fees are charged. In the summer of 2024, John Deere announced they would only be charging fees on acres that were not sprayed, i.e., areas in a field in which the weed sensing technology identified no reason to turn on a nozzle. The fee question is likely not quite settled yet.
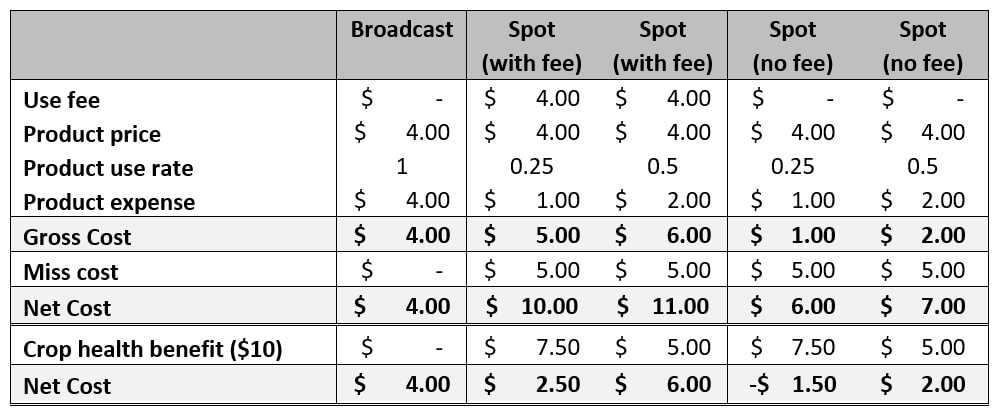
Fees essentially identify a pesticide price point below which spot sprays are not economical. Let’s take an example of a $4.00 per acre price of herbicide, broadcast (column 1 in Table 1). The “Gross Cost” of the broadcast treatment is simply the cost of the herbicide. For a spot spray, if a specific field requires just 25% of the herbicide (a 75% saving), the herbicide cost is $1/acre (column 2). Add a $4.00 per acre algorithm fee, the Gross Cost is $5.00 per acre. Broadcast spraying would cost $4.00 per acre, less than the spot spray cost. The cost for herbicide at which spot sprays become economically interesting is therefore above $5.00 per acre.
The gross cost of a spot spray pass can be calculated as follows:
Gross cost = (pesticide price * use rate) + use fee
Where “use rate” is the proportion of the field sprayed with the product.
Table 1: Spray cost scenarios for low value crops and herbicides
Now let’s assume a weedy field, one in which only a 50% saving is possible (column 3). Herbicide cost is now $2/acre, added to the $4.00 algorithm fee, for a total cost of $6.00 per acre (column 3). The weedier the field, the higher the herbicide price needs to be for a spot spray to be justifiable. Spot sprays without fees, on the other hand, allow the user to keep all the savings (columns 4 & 5), and will be the most economical option no matter the herbicide cost.
But that’s not the whole story. Spot sprays aren’t perfect. Companies are quoting a minimum weed size of about ¼” diameter (say, 6 mm), below which the plant can’t be detected. Some weeds are invisible due to shading by crop residue or other plants.
The technological answer to this problem is to implement a low-rate broadcast spray in the background. The lower rate is sufficient to kill the smallest weeds, but it reduces the overall savings. Current systems are capable of doing this due to their use of PWM valves that can deliver broadcast and spot sprays at the same time from the same nozzles.
Use of a background spray adds to the herbicide costs. If a 30% broadcast background spray were used in this example, it would add $4.00 * 0.3 = $1.20 to the cost (not shown in table). The assumption is that the lower rate broadcast would easily kill the smallest weeds that were undetected, without adding to the likelihood of resistance development from under-dosing. The assumption is also that large weeds weren’t undetected.
Users who opt for a spot spray with no background run the risk of having misses that would not be incurred with a broadcast spray. The cost of these misses depends on the situation. In some cases, it is inconsequential. A tiny weed may not cause much harm if the crop is larger and growing vigorously.
But what if the weed is competitive, and could ultimately cause yield loss? A re-spray may be required. What if this weed later causes harvesting difficulties that may necessitate a desiccation spray? What if it is resistant, and its seed production causes problems in the future? Those costs need to be considered.
In this case, we are assuming the cost of a miss at a conservative $5.00 per acre, which could be the cost of operating the sprayer for a re-spray. The cost would apply to all spot sprays equally, but not to the broadcast spray. Now the broadcast spray, still at $4.00 per acre, is the most economical.
There are also potential benefits to consider. One is the yield loss caused by the application of a herbicide with low crop safety. Think of Status (dicamba and diflufenzopyr) in corn, or metribuzin in lentils. Limiting the exposure of the crop to the herbicide reduces the potential yield loss. We rarely consider this effect because it is quite uncommon, but when it does occur it’s offset by the yield benefit of removing the weeds. Spot spraying can also open up new uses for herbicides with low crop safety.
Let’s assume the yield benefit of avoiding phytotoxicity to the crop is $10 per acre. We’ll apply this saving to the proportion of the field that is not sprayed. The spot sprays regain their advantage, but only in cases where the weed density was low or no fees were charged (“Crop Health Benefit”, Table 1). Where weeds were sprayed in larger proportions of the field area, yield benefits were reduced.
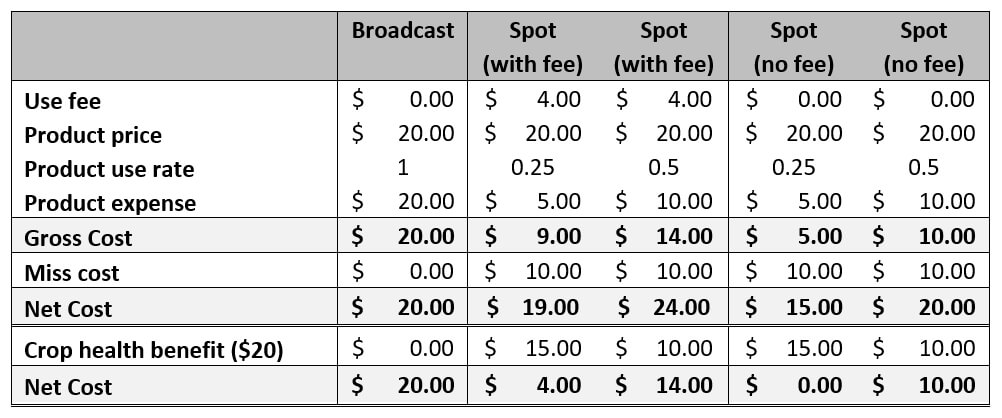
We repeat the whole exercise for a higher value crop, with more expensive treatments but also higher penalties for misses and greater crop phytotoxicity costs.
First considering only the “Gross Cost” scenario, the advantage of the spot sprays grows in this scenario (Table 2). But when the cost of a miss is added, it’s surprisingly close. As in the lower cost example in Table 1, the broadcast spray remains relatively competitive even with higher costs.
Table 2: Spray costs for higher value herbicides and crops
When we add a potential crop health benefit of $20/acre, the spot sprays regain their larger advantage.
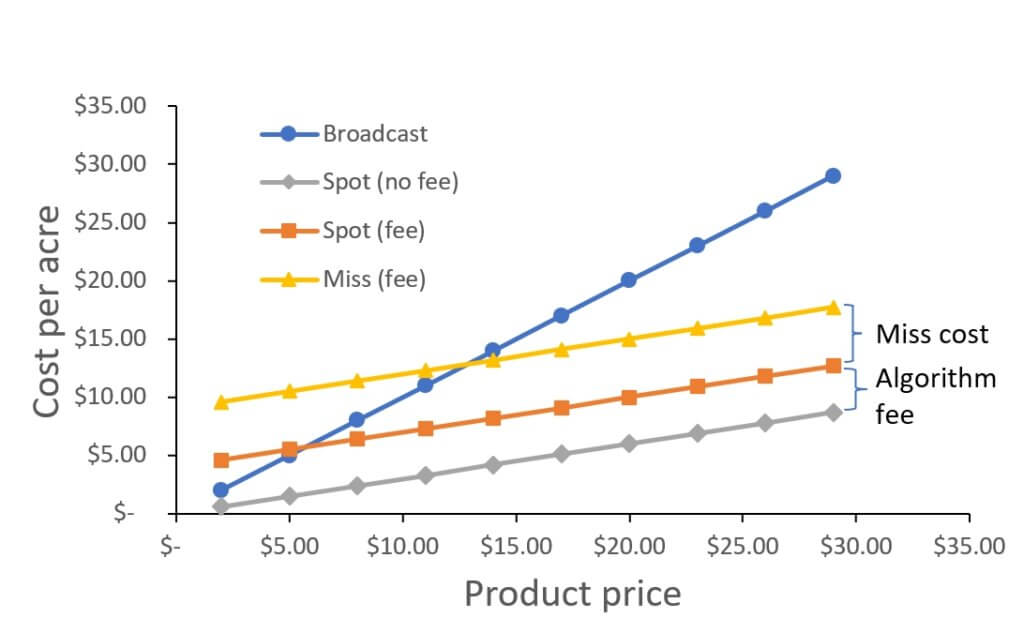
Using the herbicide price as the variable and plotting the broadcast and spot spray costs, the place where these lines cross is the herbicide cost below which the broadcast application is most economical. In the example below, the use fee was $4.00, and the miss cost was $5.00. As expected, the “no fee” situation was always more economical than broadcast when no miss costs were added. As algorithm and miss costs were added, herbicide prices needed to be above $5.00 and $14.00, respectively for the spot sprays to be more economical than the broadcast application.
Figure 1: Spot spray costs as a function of herbicide prices, assuming a 20% spot spray use rate, with $4.00 algorithm fee or $5.00 miss cost added.
This exercise is not intended to declare winners and losers. Its purpose if simply to initiate a discussion about the overall cost of various approaches. What if owners of spot sprayers make, on average, more passes over the field? What would the value of a lighter, cheaper sprayer be on their bottom line? With less expensive sprayers, the fixed cost of a spray, or a re-spray would drop. Is there a benefit from reduced soil compaction? What if the use of more complex tank mixes, necessitated by resistance, jeopardizes crop safety? The benefit of spot sprays would increase.
Continued development of nozzles specifically for spot spraying, as well as better boom levelling, will improve spot spray economics because the smaller width and length of an applied band that stable booms allow will increase savings. As these take hold, they will tilt the calculations in favour of the spot sprays.
I’ve often repeated that the savings created by spot sprays ought to be re-invested in herbicide tank mixes, with a goal to prolong the utility of herbicides before resistance develops. This could ultimately create the biggest long-term return on investment because once herbicides are no longer effective, alternative strategies will be needed.
I’m as hopeful as anyone else that agriculture can retain the benefits of effective and safe herbicides for a long time to come. But it will only take one weed on a farm to become resistant to all available herbicides for major change to be necessary. The more time we have to develop these alternatives, the better. Spot sprays are definitely a part of that strategy.
We’ve written extensively about angled flat fan nozzles and their ideal operating parameters (i.e. pressure, boom height, droplet size, volume and travel speed) for spraying wheat heads. Generally, coverage on the sprayer-approach side of a wheat head (aka the advance side) is easier to achieve because droplets from a conventional flat fan geometry tend to follow a downward-forward vector. Imagine dropping a ball from the window of a moving car. An outside observer would see it travelling forward as it fell.
The back of the wheat head (aka the retreat side) and the sides are harder to hit. When we introduce a rearward angle to coarser, fast-moving droplets, the high momentum and downward-rearward vector deposits spray on the retreat side of the wheat head after the sprayer passes over. Mythbusters produced a cool video segment that illustrates this concept by matching the rearward velocity of a soccer ball to the forward velocity of a truck; the ball falls straight down. Of course, in our case we want it to shoot backwards.
A great deal of independent research has determined that low booms coupled with dual fans that produce coarser spray and higher volumes will optimize coverage on any vertical target. Asymmetrical nozzles that have a more aggressive rearward angle perform better still. Of course both of these claims assume a “reasonable” wind speed, because the finer droplets in the spray experience a comparatively lower degree of inertia. Inertia is a property of matter that describes the resistance of an object to changes in its state of motion and it’s related to the object’s mass. What this means is that smaller droplets slow quickly, are easily deflected by wind, and tend to deposit on the windward side of the wheat head.
So, maybe you already knew all that. What’s new?
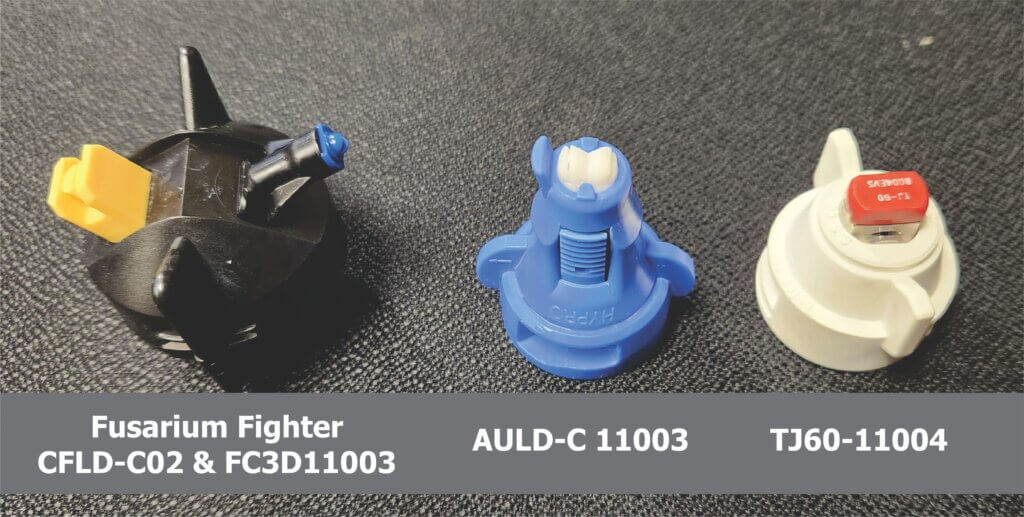
Two asymmetrical tips have been introduced in recent years and we wanted to characterize their coverage (Figure 1).
The first is the “Fusarium Fighter” which is a combo-tip developed by Nozzle Ninja in Stettler, Alberta. It combines Pentair Hypro’s FC-3D100 (a non-AI tip with a 2 star rating from LERAP and a 100° wide fan) with ASJ’s, Compact Fan Low-Drift Coarse with its 120° wide fan. The 3D already has a 55° angle from vertical and the twin cap brings that to a very steep 65°.
The second is Pentair Hypro’s Asymmetric Ultra Lo-Drift AI Ceramic. This is the same as the Lechler IDTA where the front angle is 120° wide, angled 30° forward from vertical and sprays 60% of the spray volume. The rear fan is 90° wide, angled 50° back and sprays the remaining 40%.
Finally, and only to illustrate how symmetrical fans and finer droplets are perhaps not ideal for reliable wheat head coverage, we ran TeeJet’s TwinJet Twin TJ60-110VS. This is two 110° flat fans and the angle between them is 60° (30° fore and 30° back from vertical).
Figure1. Evaluating coverage from three nozzles in winter wheat.
For each treatment, five nozzles were positioned mid-boom on a Deere 410R to minimize any turbulence from the sprayer wheels and chassis and to reduce the degree of yaw. Extensions were used on all tips to ensure the spray did not impact the boom itself. All other nozzles were turned off. Nozzle bodies were on 50 cm (20″) centres and positioned 50 cm (20″) above the average wheat head. Travel speeds were selected to achieve 187 L/ha (20 gpa) at a pressure ideal for the tip in question and this is recorded in Table 1. Contractors and other such custom applicators may find these speeds low and the volumes high, but in this study we chose to emulate usage in smaller operations. The effect of travel speed on coverage is debatable but likely quite minor. More can be found on the subject in this article.
Nozzle
Spray Quality
Speed
Pressure
AULD-C 11003
C
6.6km/h (4.1mph)
483kPa (70psi)
FF (CFLD-C02 & FC3D11003)
VC & M
8km/h (5mph)
207kPa (30psi)
TJ60-11004
F
8km/h (5mph)
207kPa (30psi)
Table 1. Operating parameters for three nozzles applying 187 L/ha (20 gpa) to wheat heads.
The weather was 25°C, 40% R.H. and there was a very light and consistent tail wind of 2-4 km/h (1.2-2.4 mph). These were ideal conditions because it was not hot or dry enough to evaporate finer spray appreciably, and not windy enough to deflect the spray.
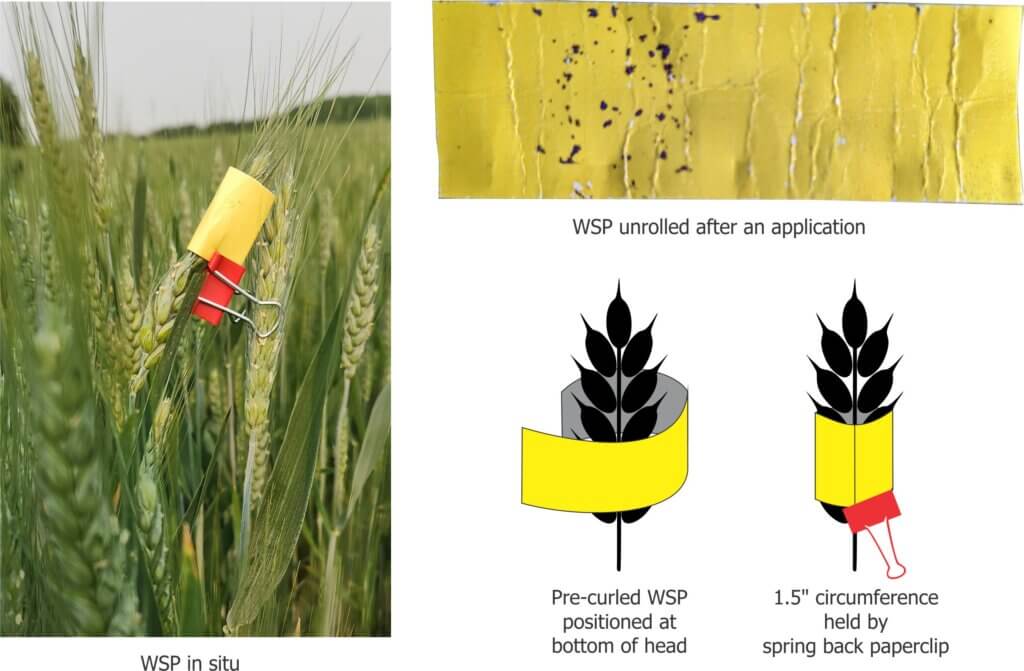
Water sensitive paper (Syngenta) was wrapped around the wheat head and held by a paper clip (see Figure 2). This gave a panoramic representation of coverage. Two more were mounted nearby on a length of rebar at wheat head-height; One faced the sprayer advance and one faced the retreat. Three such sets were positioned inline, spaced about 1 m apart and centered on the swath produced by the five nozzles. This was repeated 2x for each nozzle. Papers were retrieved, digitized and analyzed per the method described in this article.
Figure 2. WSP wrapped around a wheat head.
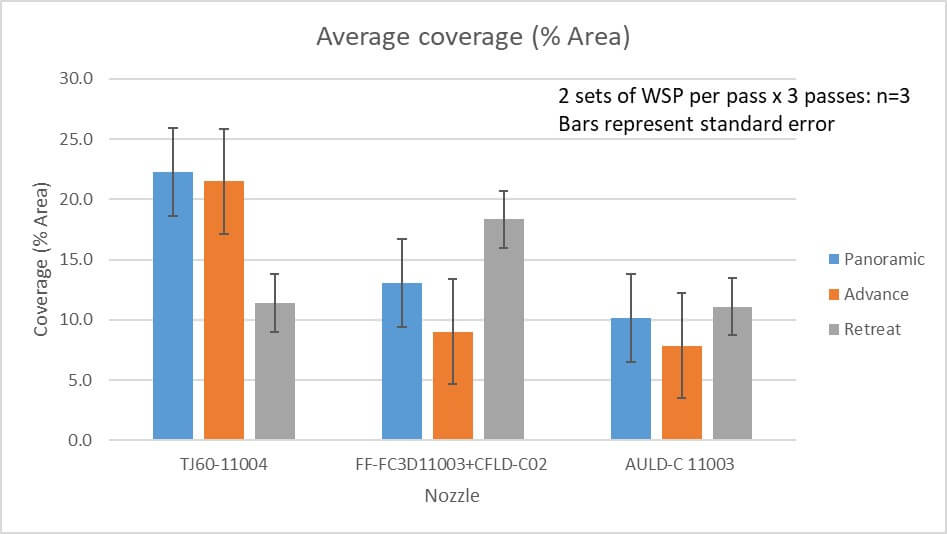
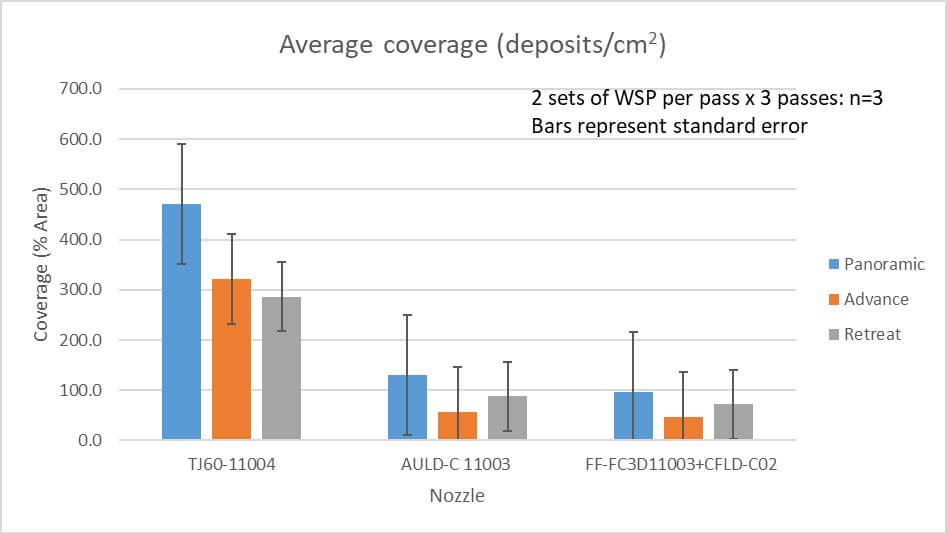
The resultant coverage is recorded in Table 2 and graphed in Figures 3 and 4.
Nozzle
Panoramic: Area covered (%) & deposit Density (#/cm2)
Advance: Area covered (%) & Deposit density (#/cm2)
Retreat: Area covered (%) & Deposit density (#/cm2)
AULD-C 11003
10.2% 130.4 deposits/cm2
7.9 % 56.1 deposits/cm2
11.1% 87.7 deposits/cm2
FF (CFLD-C02 & FC3D11003)
13% 97.5 deposits/cm2
9.0% 46.9 deposits /cm2
18.3% 72.4 deposits/cm2
TJ60-11004
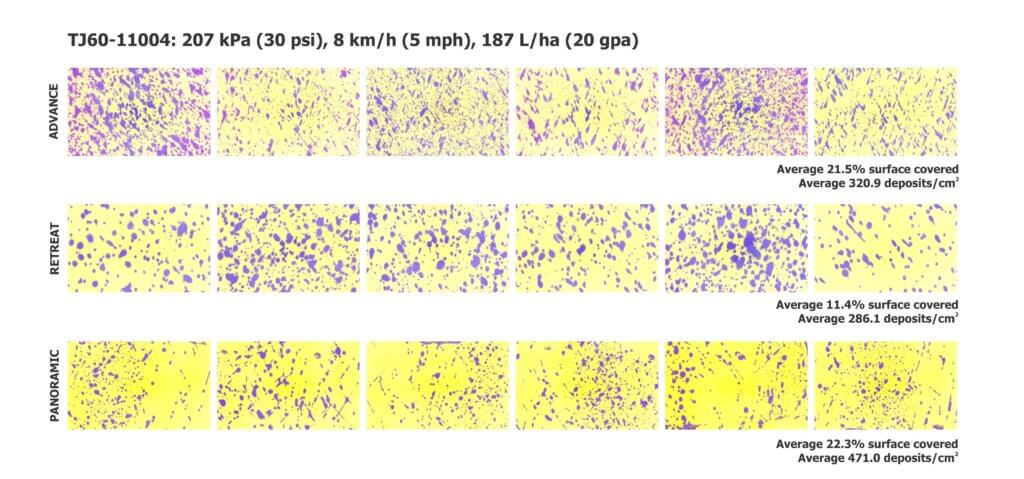
22.3% 471.0 deposits/cm2
21.5% 320.9 deposits/cm2
11.4% 286.1 deposits/cm2
Table 2. Average coverage from three nozzles applying 187 L/ha (20 gpa).
Figure 3. Comparison of average percent area covered for three nozzles.Figure 4. Comparison of average deposit density for three nozzles.
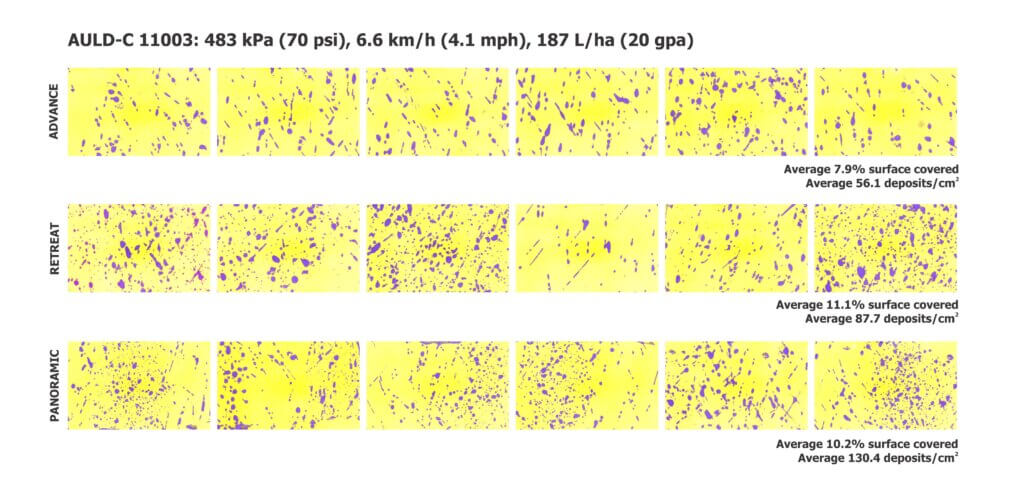
Unless you are experienced with interpreting coverage data, these numbers and graphs may not convey what coverage truly looked like. And since we saw some unexpected results, we felt it would be best to digitize the papers from each nozzle and create graphics to support our observations and opinions on how they performed. Each image shows six replications of each orientation. We’ll begin with the AULD in Figure 5.
The AULD was operated at a relatively high pressure to create the Coarse droplets recommended by the nozzle manufacturer. The steep rearward angle produced a higher degree of coverage on the retreat side compared to the advance. The streaky or tear-drop shaped deposits indicate a droplet that “scuffed” along the paper surface, almost but not quite in parallel. On the panoramic targets they tend to correspond with the sides of the paper, where the droplets are not aimed directly at the surface as in the “advance” and “retreat” surfaces. All in all, this nozzle performed well and created droplets large enough that we feel they would stay on course in a higher wind and not get tied up on the awns of the wheat head.
Figure 5. Digital scans of water sensitive papers from the AULD nozzle. Spray quality was C.
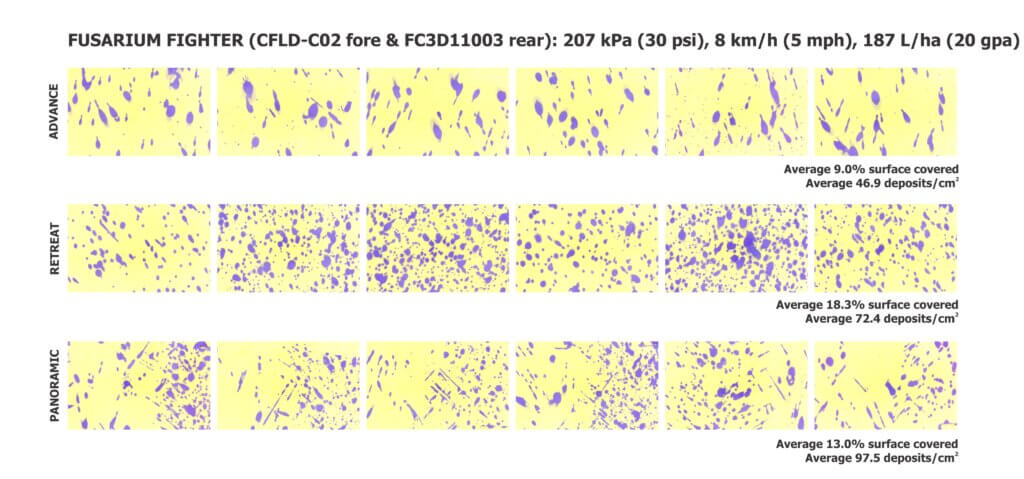
Next is the Fusarium Fighter. This nozzle was developed in Western Canada where, on average, sprayers tend to travel faster than they do in Ontario. Certainly this isn’t the case for all Ontario fields, but we chose to emulate usage in home farm operations where fields may be smaller and less level. This is relevant because faster travel speeds permit the use of a larger 3D nozzle to achieve 20 gpa, which in turn produces a coarser spray quality. In our trials, we traveled more slowly and that necessitated a smaller 3D that produced only a Medium droplet size. We hypothesized that those smaller droplets may not stay on course, but the papers show otherwise (Figure 6).
Figure 6. Digital scans of water sensitive papers. Spray quality was VC and M.
Coverage on the retreat side was very good and far outstripped the coverage on the advance side. In fact, the Very Coarse spray quality from the CFLD-C may be too large. Dropping from VC to C would create more droplets and a higher deposit density on the advance. We did see some gaps in the panoramic papers that likely reflect the lack of finer droplets which tend to move more erratically and contact the sides. Recall that we said weather conditions were ideal. It is still questionable how well a 3D producing a Medium spray quality would perform in windier conditions or on the boom ends where yaw tends to lift tips well above the ideal operating height.
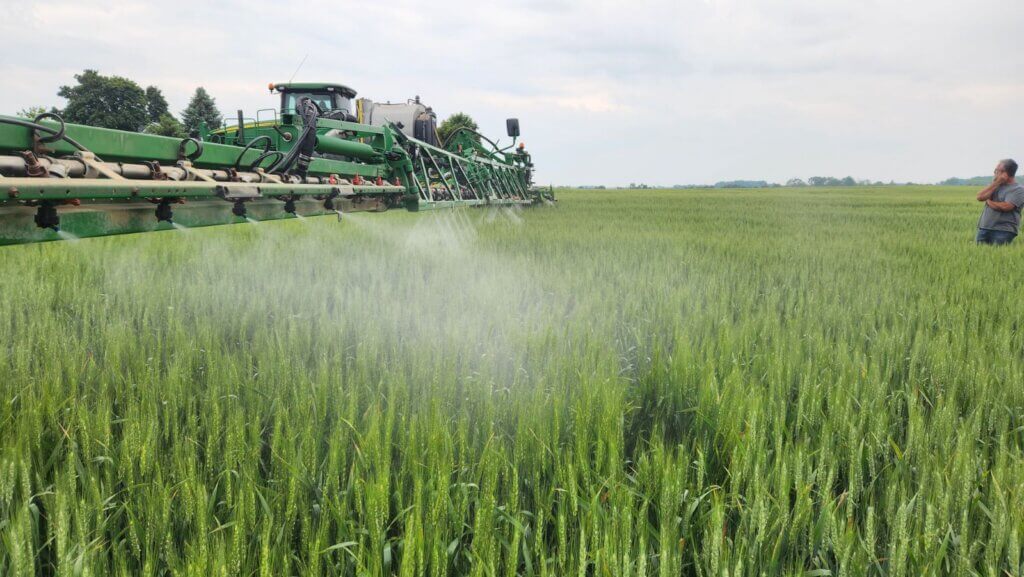
Figure 7. All three tips operating on a stationary sprayer at 40 psi. The Fusarium Fighters (foreground), the TwinJets (middle) and the AULDs in the background.
Finally, the TwinJets (Figure 8). We used this nozzle only to demonstrate how the lack of an aggressive rearward angle and a Fine spray quality was not conducive to reliable wheat head coverage. Many studies have demonstrated that such a nozzle outperforms a single, conventional flat fan, but it is not the best choice of angled nozzles. Once again recall that these nozzles were positioned centre-boom where yaw and sprayer-induced turbulence were not an issue and in absolutely ideal environmental conditions.
We saw tremendous coverage on the advance side and while we saw comparatively less on the retreat side, it still performed well compared to the other nozzles. The panoramic targets also indicated suitable coverage, both as percent area covered and deposit density. BUT, if we have some questions about how the Medium spray from the 3D would perform in more challenging conditions, we are far more concerned about the fines from this tip. Having used this nozzle in past demonstrations we are well aware of how non-uniform and erratic coverage can be, and that translates to poor efficacy and increased drift. However, sometimes circumstances conspire to create exceptions, and the coverage we saw in this trial is hard to fault.
Figure 8. Digital scans of water sensitive papers. Spray quality was F.
This trial was not intended to rank nozzles, but to explore the merits of a few new designs and evaluate their respective coverage. If anything the results reinforce the need to operate angled sprays correctly and in appropriate weather conditions. Water sensitive paper remains a quick and easy method for sprayer operators to evaluate their own coverage and inform any corrective actions to improve results in their own unique circumstances.
Thanks to Dan and Paul Petker (Petker Farms) and Don Murdoch (Simcoe Research Station, University of Guelph) for providing the fields and operating the sprayers. Nozzle Ninja is gratefully acknowledged for the donation of AULD and Fusarium Fighter nozzles, and Spraying Systems Co. for the TwinJet nozzles and water sensitive paper.
The decision on which application method is best for herbicides boils down to two main factors: (a) target type and (b) mode of action. In general, it’s easier for sprays to stick to broadleaf plants on account of their comparatively larger leaf size and better wettability compared to grassy plants. There are exceptions, of course – at the cotyledon stage, broadleaf plants can be very small and a finer spray with tighter droplet spacing may be needed. Water sensitive paper is a very useful tool to make that assessment. Imagine if a tiny cotyledon could fit between deposits – that could be a miss!
Some weeds are also more difficult to wet, and those may also need a finer spray or a better surfactant for proper leaf contact. An easy test is to apply plain water to the leaf with a spray bottle. If the water beads off or the droplets remain perched on top in discrete spheres, the surface is considered hard to wet. Most grassy weeds are hard to wet, while most broadleaf weeds are easy to wet.
Grassy weeds are an especially difficult target because they have smaller, more vertically oriented leaves, and almost without exception are more difficult to wet than broadleaf species. All these factors call for finer sprays for effective targeting and spray retention.
Broadleaf weeds usually have more horizontally oriented leaves which also happen to be larger. As a result, they can intercept larger droplets quite efficiently.
There are about thirty mode of action (MOA) groups among the herbicides with about ten accounting for the majority in Canadian prairie agriculture. It’s probably an over-simplification to categorize them into just two groups – systemic and contact. But that grouping goes a long way to making an application decision.
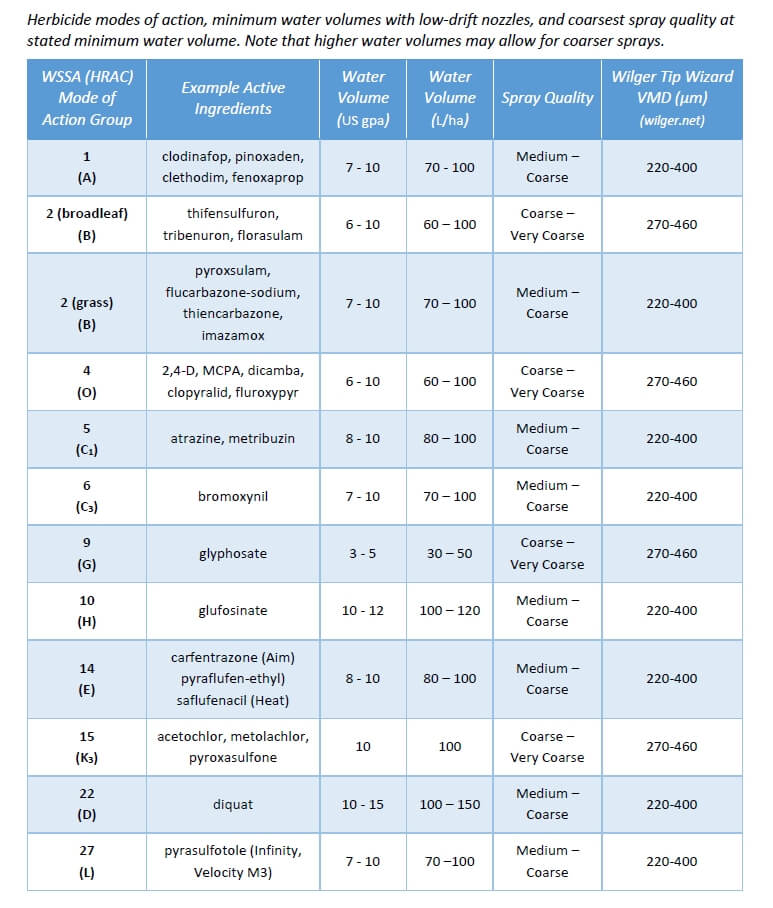
Contact products (MOA Group 5, 6, 10, 14, 22, 27) must form a deposit that provides good coverage. Good coverage is an ambiguous term that basically means that droplets need to be closely spaced and cover a significant proportion of the surface area because their physiological effects occur under the droplet, and don’t spread far from there. One way to generate more droplets is to reduce droplet diameter, another is to add more water. A reasonable combination of both is ideal because simply making droplets smaller creates issues with evaporation and drift.
Systemic products (MOA Group 1, 2, 4, 9) will translocate within the plant to their site of action after uptake. As a result, coverage is less important as long as sufficient dose is presented to the plant. In practice, this means coarser sprays and/or less water may be acceptable.
When two factors are combined, either in a tank mix or a weed spectrum, the more limiting factor rules. Application of a tank mix or product that is active on both broadleaf and grass plants will be governed by the limitation placed on grass targets. A tank mix comprised of both systemic and contact products is governed by the limitations placed on contact products.
A factor we should also consider is soil activity and the presence of residue. Studies have shown that soil-active products are relatively insensitive to droplet size. But if they have to travel through a layer of trash to get to the soil surface, more application volume is the best tool.
Below are some recommended spray qualities and water volumes for use in Canada. The spray qualities listed in the table can be matched to a specific nozzle by referring to nozzle manufacturer catalogues, websites, or apps. Note that Wilger also offers traditional VMD measurements on their site, allowing users to be a bit more specific if necessary.
This article was co-written with Dr. Sean Westerveld, Ontario Ginseng and Herb Specialist.
An effective ginseng protection program begins with observing the Integrated Pest Management (IPM) process:
diagnose the problem,
monitor the problem,
control the problem, and
monitor the results.
When spraying is warranted, the operator should understand the basics of application technology. This not only includes the equipment, but the effects of changing spraying parameters (such as pressure or carrier volume), the impact of weather conditions (such as wind and relative humidity) and the product being applied (such as correct timing and safety requirements). The operator should also understand how to properly maintain, calibrate and orient the sprayer according to the nature of the target. Finally, monitoring the results requires the operator to respond to changes in the environment and target during application and to consider these factors when evaluating the outcome.
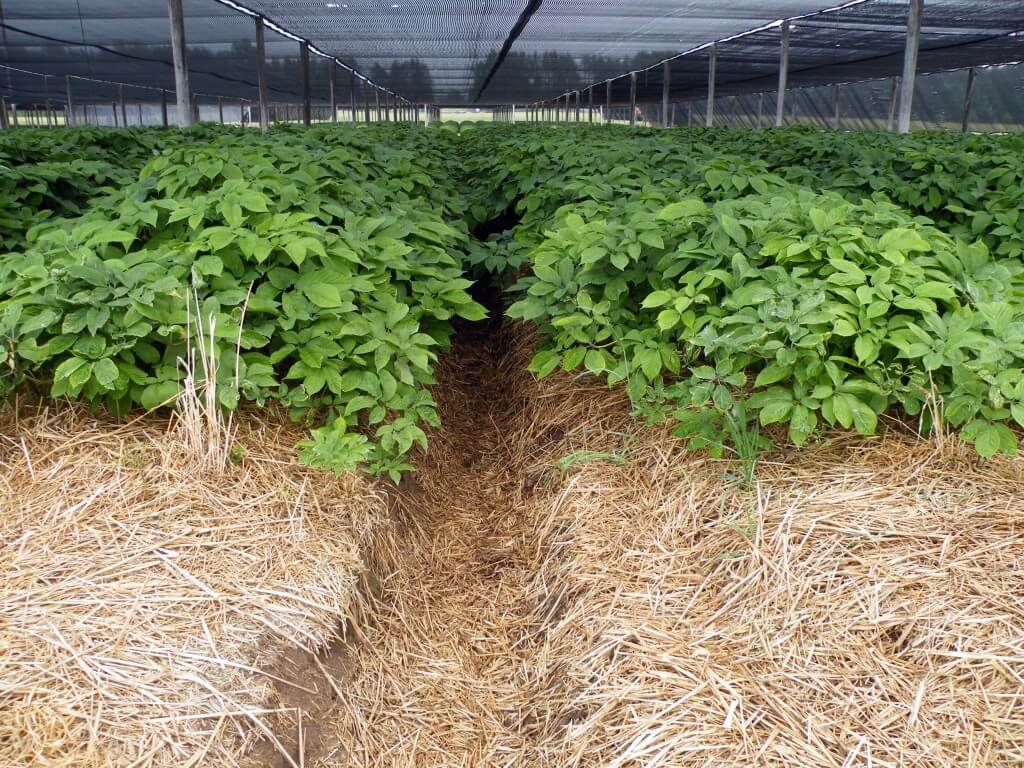
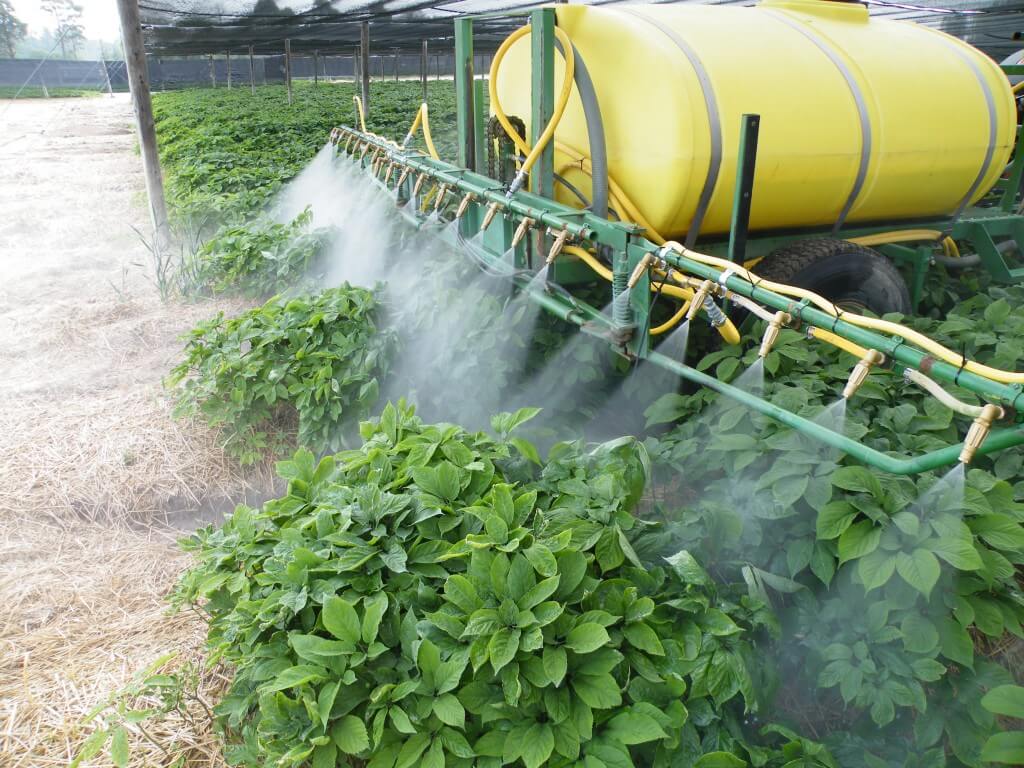
The ginseng garden
This is a four-year old garden, which represents one of the largest, densest ginseng canopies an applicator can spray. The six-foot wide beds in this particular garden are higher than most beds, making sprayer/tractor clearance an issue. It also means the distance-to-target from boom to canopy is less in the middle of the bed than it is nearer the alleys, making it difficult to ensure consistent coverage. Sprayer operators typically drive in the same direction over each bed, “training” the plants to bend in the same direction each time the tractor passes over the surface. This practice, combined with fenders on the tractor wheels, helps to minimize physical damage as the sprayer passes.
Ginseng gardens have high beds.Clearance is an issue in a four year old ginseng garden.
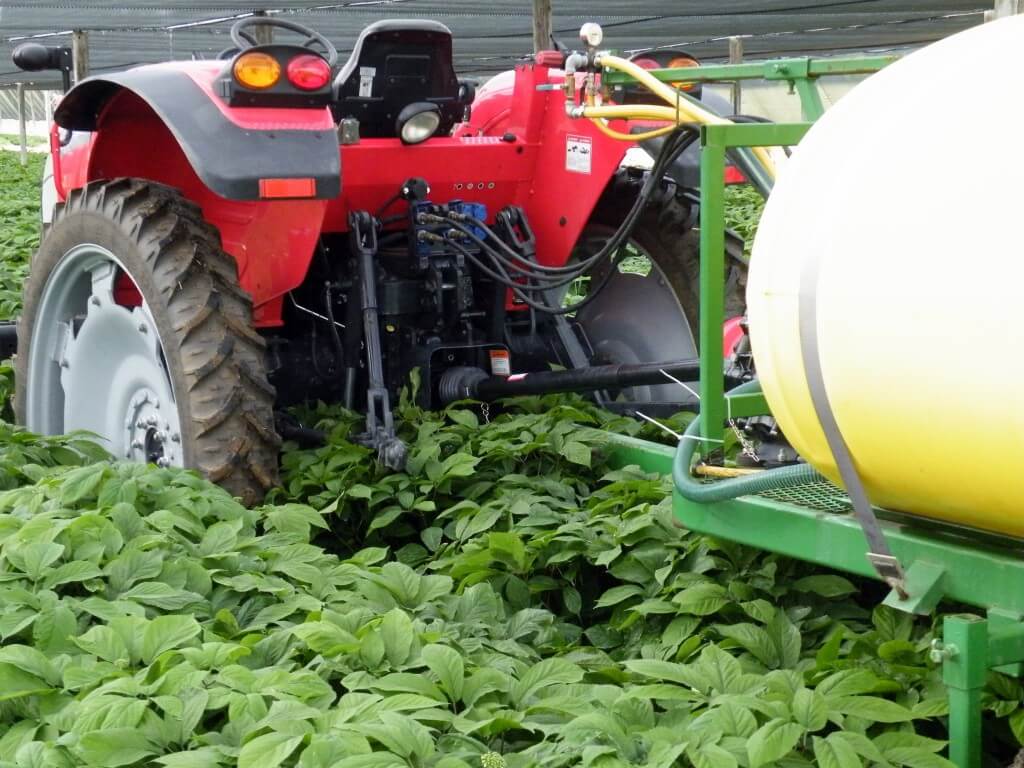
The sprayer
This custom-built sprayer is a fairly standard design for most ginseng operations: Eight nozzles on each wing and nine on the centre boom. Spacing varies but this sprayer is on 11 inch centres, with the outermost nozzles on five inch centres and aimed outward towards the adjacent beds. Given the limited boom height, all nozzles are aimed back about 45 degrees to increase the distance to target and allow for overlap. The angle is critical to prevent gaps in the spray swath, but given the recommended practice of limited overlap for hollow cone nozzles, the 11 inch spacing may be a little shorter than required.
Custom-made ginseng sprayer. A standard design in Ontario.
Spray coverage
There is no hard and fast rule for spraying ginseng. The crop can receive 30 or more applications a year, most of which are fungicide applications. Tip: Monitoring the small plants inside the canopy is a good indicator of overall garden health.
The following lists products available for use in Ontario at the time this article was published. The application target varies for each product, depending on the pest or disease the applicator wishes to control. As such, the application volume should reflect the location of the intended target. For example, a foliar-and-stem application should achieve consistent coverage of all leaf surfaces without incurring run-off. An application intended to reach the crown through the straw will require some run-off down the plant stem and should require a higher volume than a foliar-and-stem application. Many products will become immobilized if they dry onto the straw. Applications are best done to wet straw, followed by irrigation or rainfall to wash the product into the root zone. Applications for diseases like Rhizoctonia generally take place early in the season before the canopy closes, and higher volumes may not be required to achieve root coverage. In order to know how much is required for optimal coverage, read on.
Table 1 – Spray target and relative volume by pest
Pest
Application Target – Specific Product
Garden Age
Relative Volume
Alternaria and/or Botrytis
Foliar and Stem – all products
Seedling – 2nd year
Low
3rd – 4th year
Moderate
Phytophthora Leaf Blight
Foliar and Stem – most products
Seedling
Low
2nd-4th year
Moderate
Foliar – Aiette and Phostrol
All
Low
Phytophthora Root Rot
Root – xylem-mobile root rot products
All
High
Foliar – Aiette and Phostrol
All
Low
Phytophthora Leaf and Root
Root – xylem-mobile root rot products
All
High
Foliar – Aiette and Phostrol
All
High
Cylindrocarpon
Root – all products
All
High
Rhizoctonia
Root – most products
All
High
Root – Quadris
Seedling
High
Pythium
Root – all products
All
High
Aphids
Foliar and Stem/Berries – all products
All
Moderate
Cutworms
Stem – all products
All
Low
Four-Lined Plant Bug
Foliar – all products
All
Moderate
Leafrollers
Foliar and Stem – all products
All
Moderate
Root Lesion Nematodes
Root – all products
All
High
History of the ginseng boom in Ontario
Historically, ginseng sprayer operators used brass hollow cone nozzles to spray ginseng. For reasons that are unclear, many then adopted the Casotti-style sprayer, which used higher volumes and an oscillating nozzle assembly to create a larger swath. This was determined to be overkill for ginseng, and it produced inconsistent coverage.
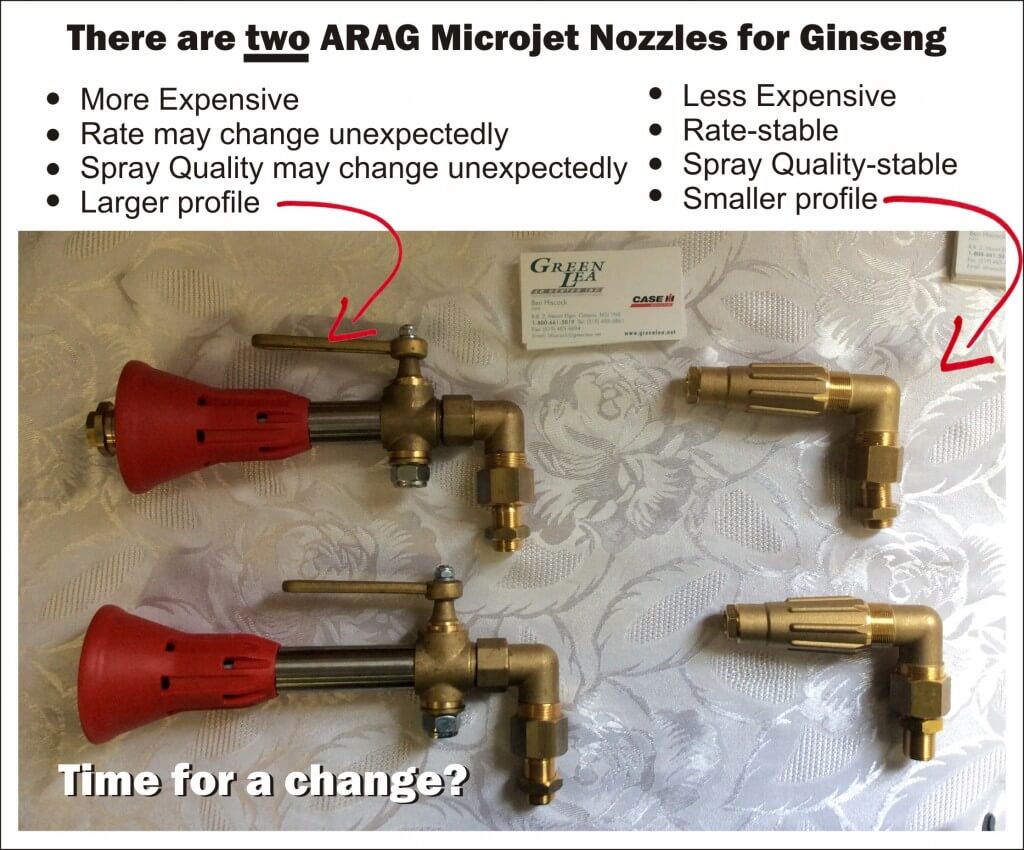
Many growers (sadly, not all) switched back to horizontal booms and began using the Arag microjet assembly. Drop nozzles (aka drop arms, drop booms, drop legs, etc.) were positioned with disc-core hollow cone nozzles behind the wheels to direct spray into the canopy from below.
Later, we demonstrated that the microjet mixing valve was difficult to set accurately, creating outputs +/- 50% the optimal rate. In response, a new variation on the Arag microjet was introduced, with a more reliable rate adjustment and a lower price tag (they are imported from Italy by a single North American distributor). The drop nozzles are absolutely critical for under canopy coverage, and growers have begun suspending them in each alley – not just behind the sprayer wheels. I predict the future boom arrangement will return to hollow cone nozzles, but in the form of molded poly nozzles with ceramic handling and drop nozzles with full cone disc-core assemblies. Air assist would be even better.
Sprayer settings
Most operators employ a ground speed of about 5 km/h (3.1 mph), operate at about 13.8 bar (200 psi) with nozzles spaced 25-30.5 cm (10-12”) spraying anywhere from 1,000 L/ha (107 gal./ac.) to 1,686 L/ha (180 gal./ac.). The application volume should reflect the stage of crop growth, the age of the garden and the target in question (see Table 1). Applicators should also consider droplet size (Table 2). This is difficult to control given that the majority use Arag microjets with the 1.5 mm orifice disc. In which case, pressure choice will affect median droplet size, with lower pressures increasing median droplet diameter and vice versa.
Table 2 – The Impact of Droplet Size
Droplet Size
Drops per area
Retention
Canopy Penetration
Drift Potential
Fine
High
High
Low
High
Medium
Moderate
Moderate
Moderate
Moderate
Coarse
Low
Low
High
Low
Two versions of the ARAG Microjet.
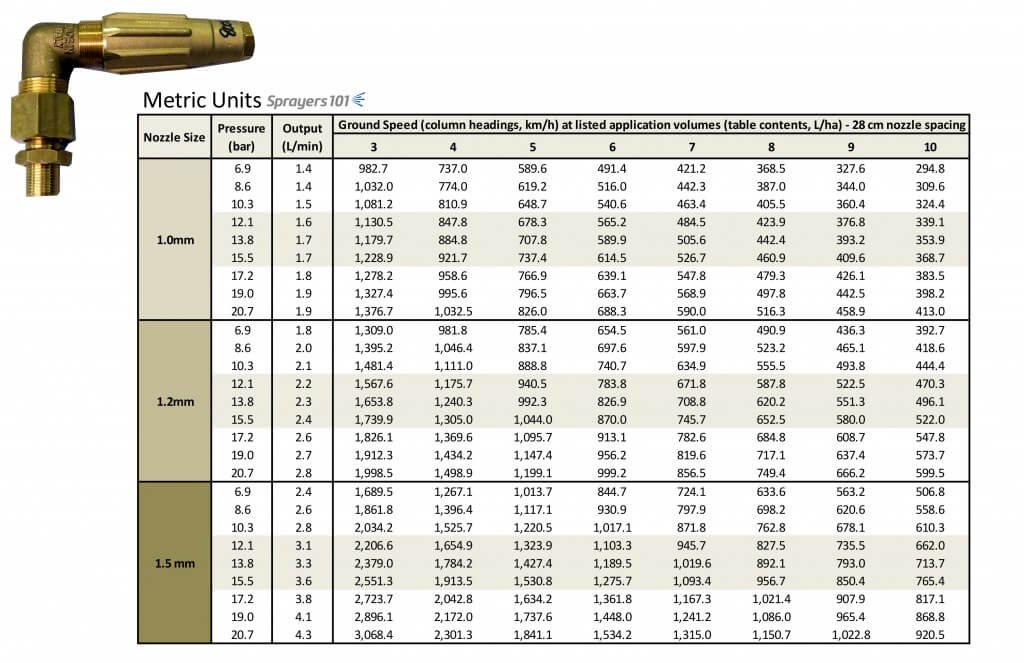
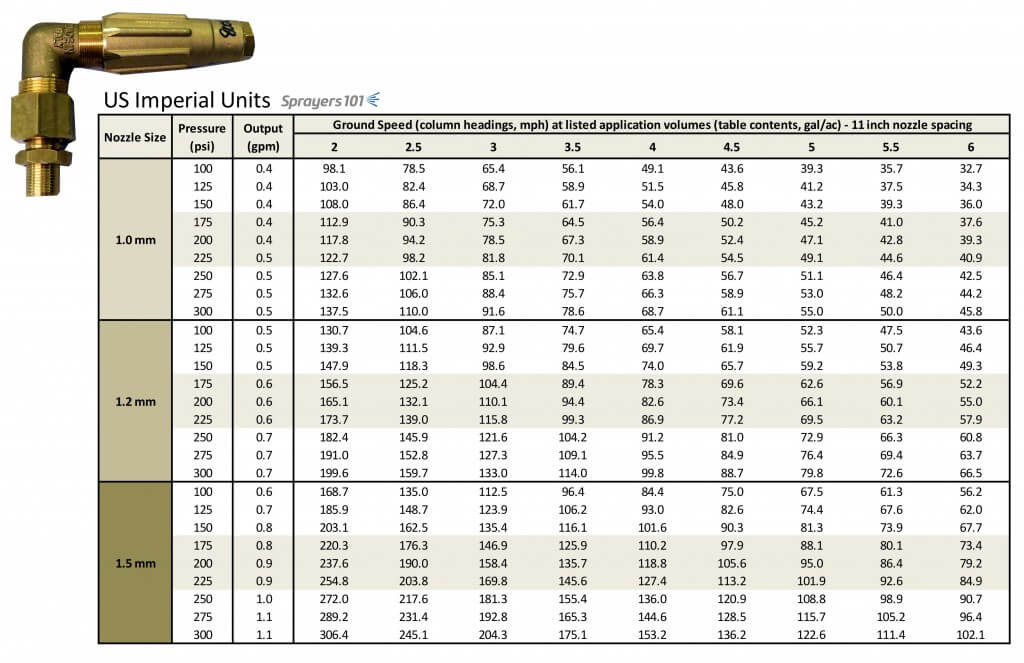
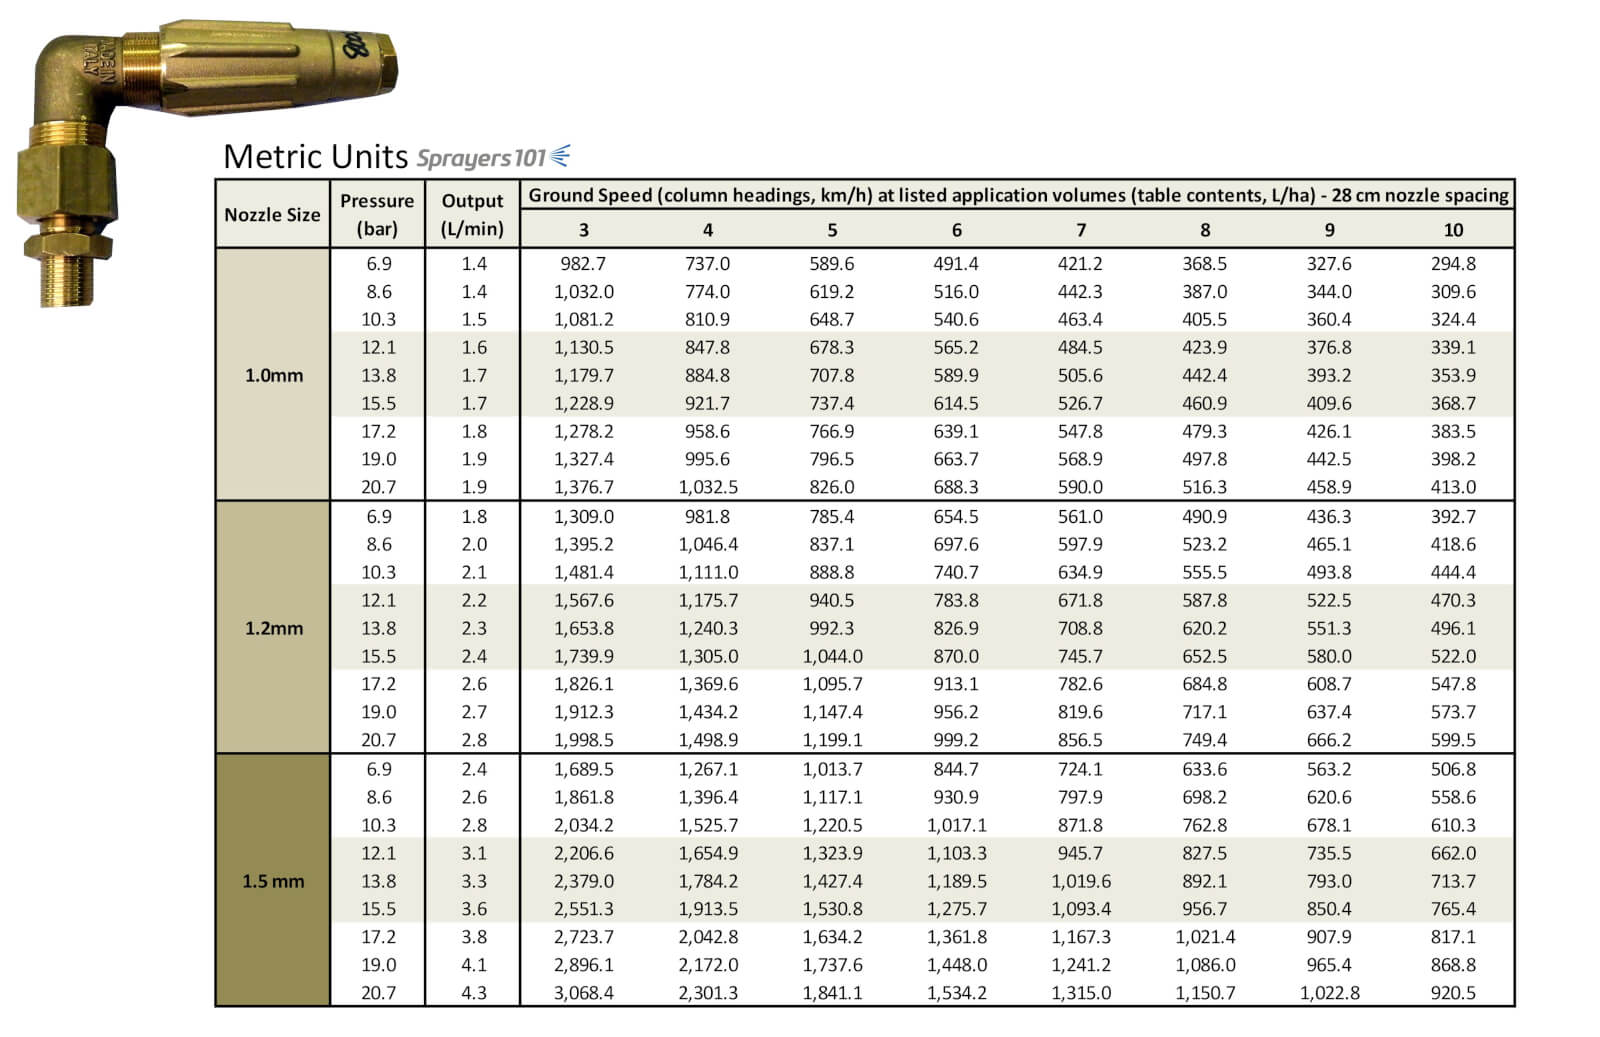
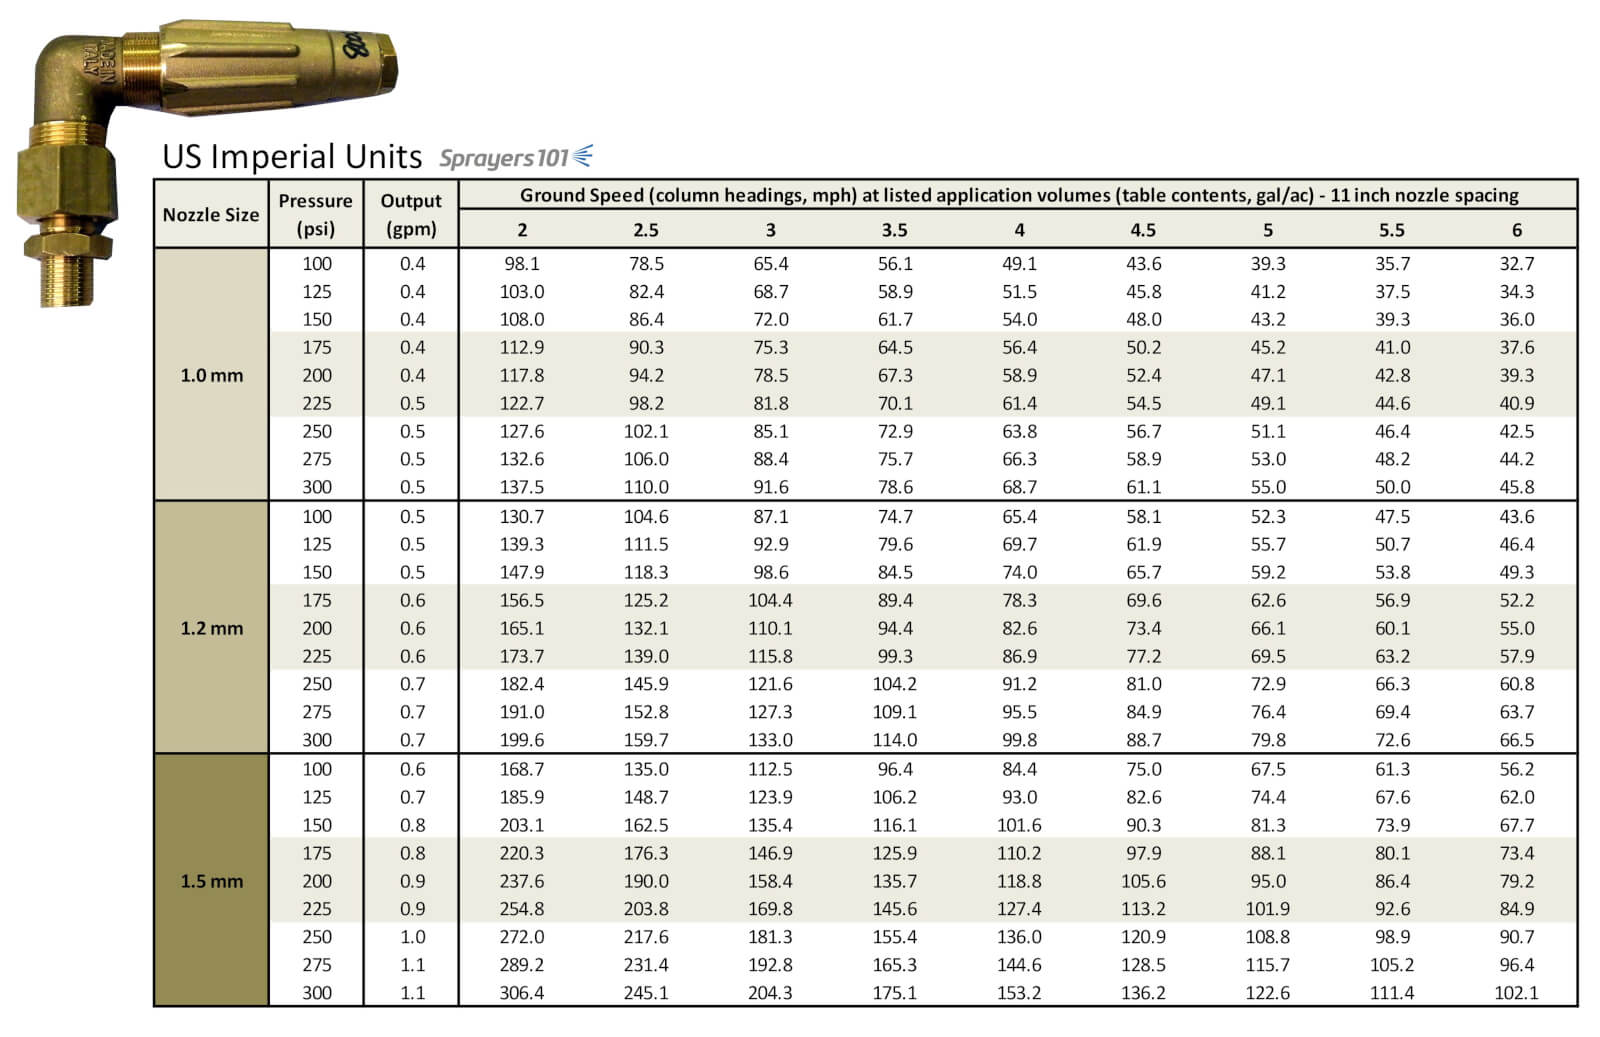
The older style Arag microjets with 1.5 mm diameter discs have highly variable outputs. We developed tables listing their rates with the mixing valve handle set in two positions. They can be found here. We have also developed tables for the newer Arag nozzles for the 1.0, 1.2 and 1.5 mm discs based on 28 cm (11”) spacing. They are listed in Metric and U.S. Imperial.
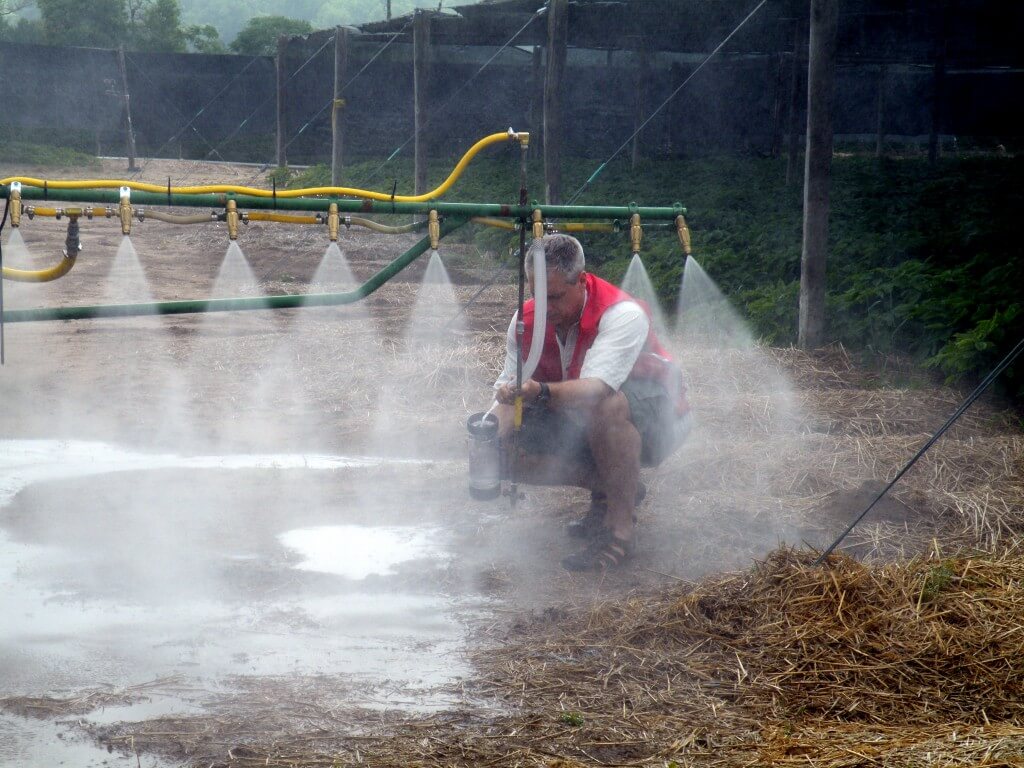
Park the clean sprayer and get the pressure up to the desired level. Using a calibration vessel, perform a timed output test to determine each nozzle rate. I prefer the SpotOn SC-4 and a length of 1” braided line to direct the spray into the vessel. You will get wet, so ensure the water is clean and/or wear appropriate PPE.
Timed output test. Prepare to get very wet. Unless sprayer is sparkling clean, like this one, PPE is a must.
At 200 psi, we took readings from each microjet and found that while they were more consistent than the older model, there was still a lot of variation from tip to tip. This required us to turn the valve on the nozzle to get a more consistent output, then take another reading, and repeat until we liked what we saw. It became tricky to adjust the rate without reducing the hollow cone pattern to a solid stream because only a slight turn of the nozzle was required. Once we had it, we tightened the lock nut and moved to the next nozzle. Table 3 is a record of the procedure.
While calibrating, we noticed some of the nozzles would suddenly appear plugged, or dense lines could be seen in the spray cone indicating something was wrong. We cleaned them to discover bits of plastic from the poly tank. I asked about strainers, but they are not available for the microjets. I asked about in-line filters, but they aren’t rated for 200 psi. Filling the tank with clean water is very important, but even more so with these nozzles.
Table 3 – Calibrating the new Arag microjets
Nozzle Position
Rates in gpm (bold represents final rate)
Nozzle Position
Rates in gpm (bold represents final rate)
1
0.97, 0.96, 0.93
14
0.77, 0.92
2
1.07, 1.07, 1.26, 0.9
15
0.76, 0.8, 0.95
3
1.1, 1.1, 1.1, 0.93
16
0.97, 0.95
4
0.73, 0.92
17
0.73, 1.0, 1.07, 1.0, 0.98
5
0.92, 0.92
18
0.83, 0.94
6
0.94
19
0.77, 1.0, 0.99, 1.1, 1.24, 10.8, 0.93
7
0.88
20
0.77, 0.88
8
0.92
21
0.71, 0.95
9
0.95
22
0.77, 1.07, 1.04, 1.1, 1.27, 1.0
10
0.90
23
1.06, 0.97
11
0.86
24
0.77, 0.97
12
0.76, 0.83, 1.0, 1.0, 1.2, 0.92
25
0.68, 0.95
13
0.77, 0.92
Average output: 0.93 gpm, standard deviation of 0.03 gpm.
Ground speed
Once the nozzles were adjusted, we filled the tank ½ full and measured out 25 m in the bed. We would normally do 50 m, but the row was too short. The sprayer operator drove the course and we measured the time it took to travel the 25 m distance. Pass one took 18.5 seconds and pass two took 18.3 seconds. That’s an average of 18.4, which we then double so it works in the formula = 36.8 s.
( 50 × 3.6 ) ÷ 36.8 s = 4.9 km/h
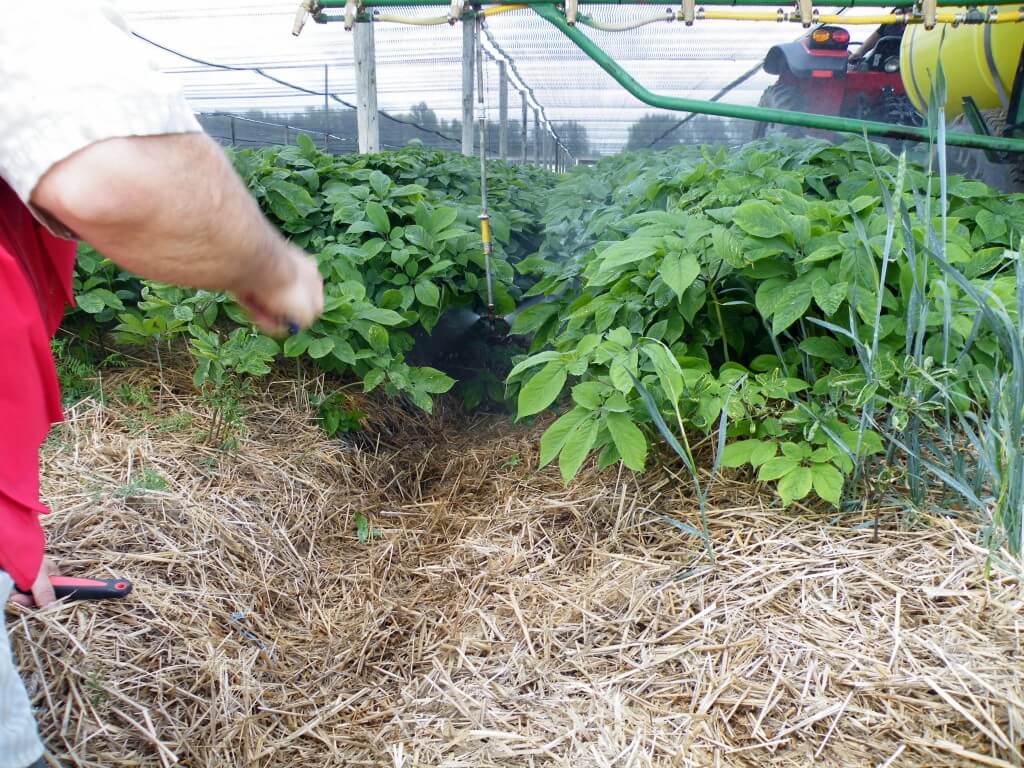
Adjusting the drop leg nozzles
This sprayer had drops behind the wheels and two more to hang in the adjacent alleys. This is excellent because research has shown considerably improved coverage with directed spray from drop arms. In my mind, these are not optional – they are mandatory!
Drop nozzles in the alleys.
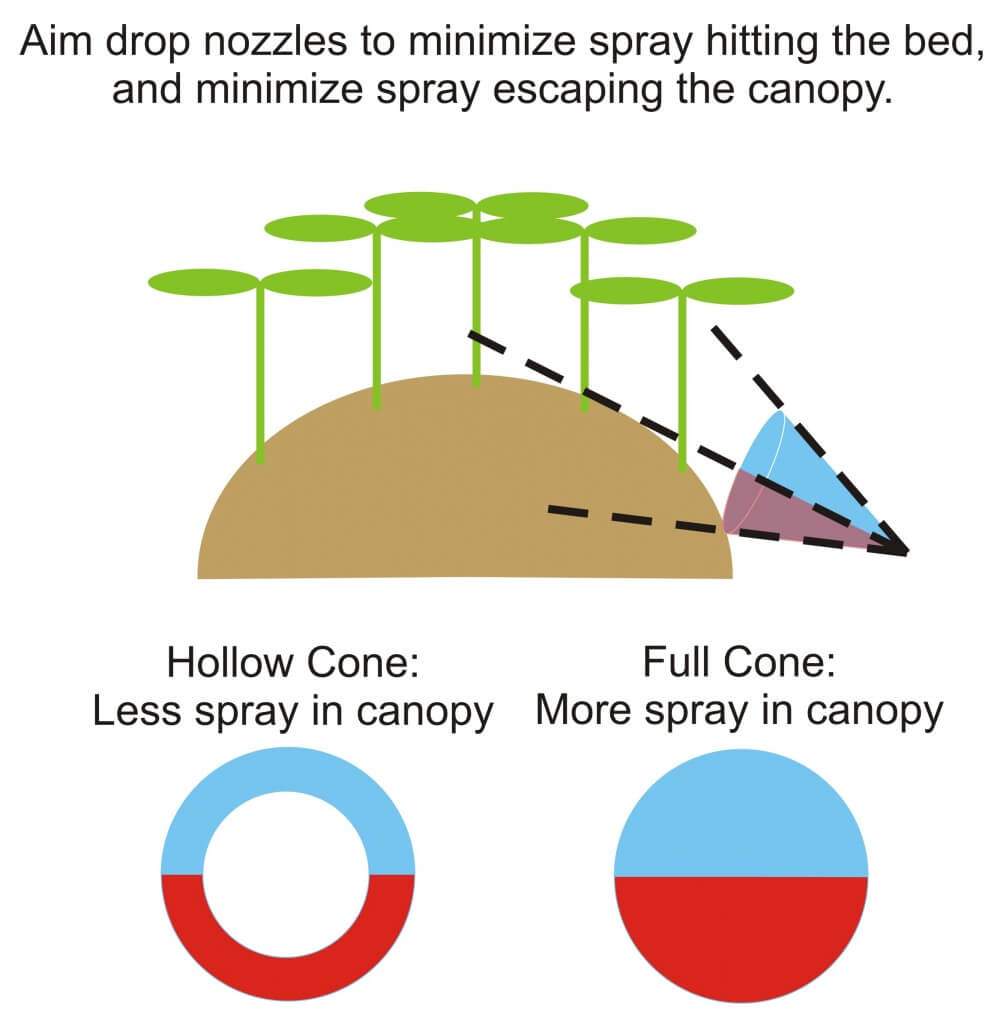
We swapped out the hollow cones we found in those positions for full cone disc and core (D5-DC35). Full cones increase the number of droplets that will clear the raised bed and enter the canopy. When adjusting them, be sure to minimize the portion intercepting the bed, while minimizing the spray escaping up through the canopy. It’s a fine line.
Aiming drop arms in a ginseng garden.
Calculating sprayer output
25 microjets at 200 psi = average of 0.93 gpm = 23.25 gpm 8 × D5-DC35 at 200 psi = 1.4 gpm × 8 = 11.2 gpm That’s ~34.5 gpm for the boom. Ground speed was 4.9 k/hr or ~ 3mph.
GPA = (GPM × 5,940) ÷ (mph ÷ nozzle spacing in inches) GPA = (34.5 gpm x 5,940) ÷ (3.0 mph × 11 inches) GPA = 204,940 ÷ 33 62.1 GPA or about 580 L/ha.
Diagnosing coverage
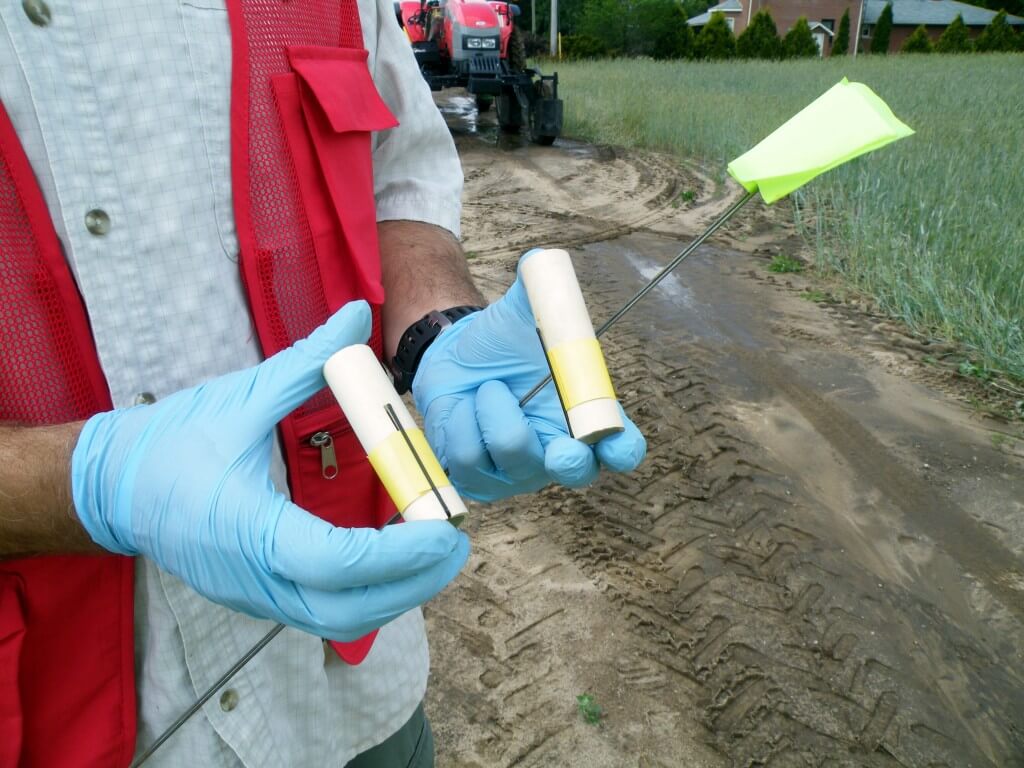
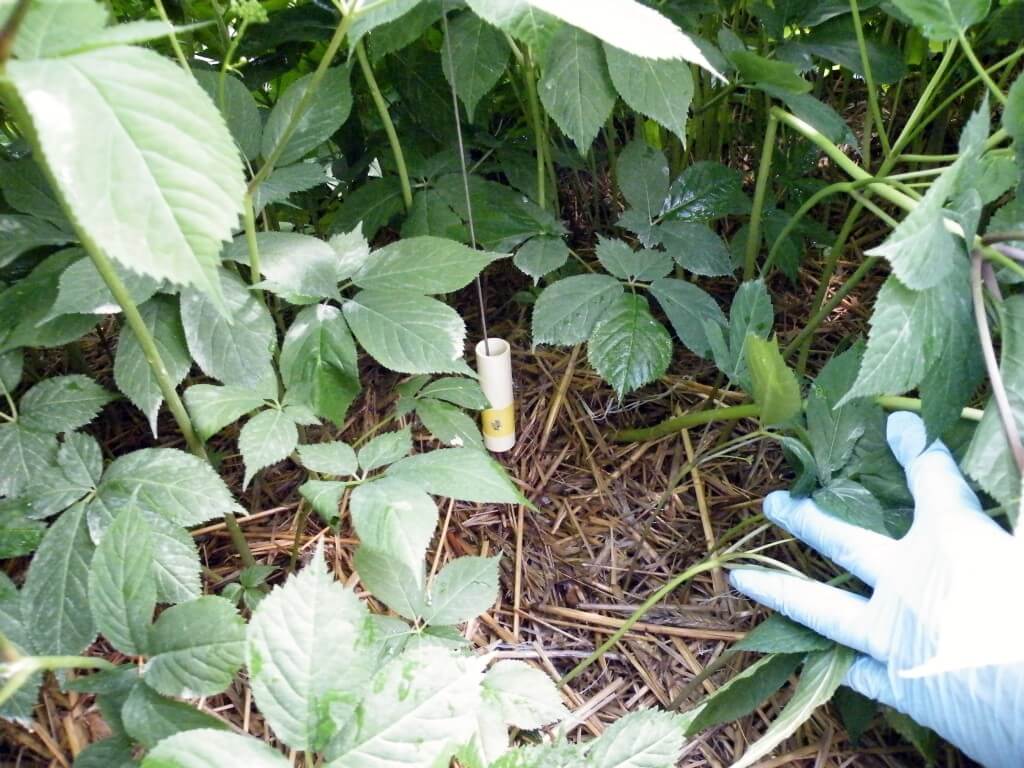
Water sensitive paper, which turns from yellow to blue when contacted by moisture, was placed in the ginseng canopy. Two sets of papers were set out, with four papers in each set. The canopy was still wet with rain, which made placement difficult as the papers would accidentally contact water on the leaves and change colour prematurely.
Water-sensitive paper wrapped around tubes for panoramic coverage.
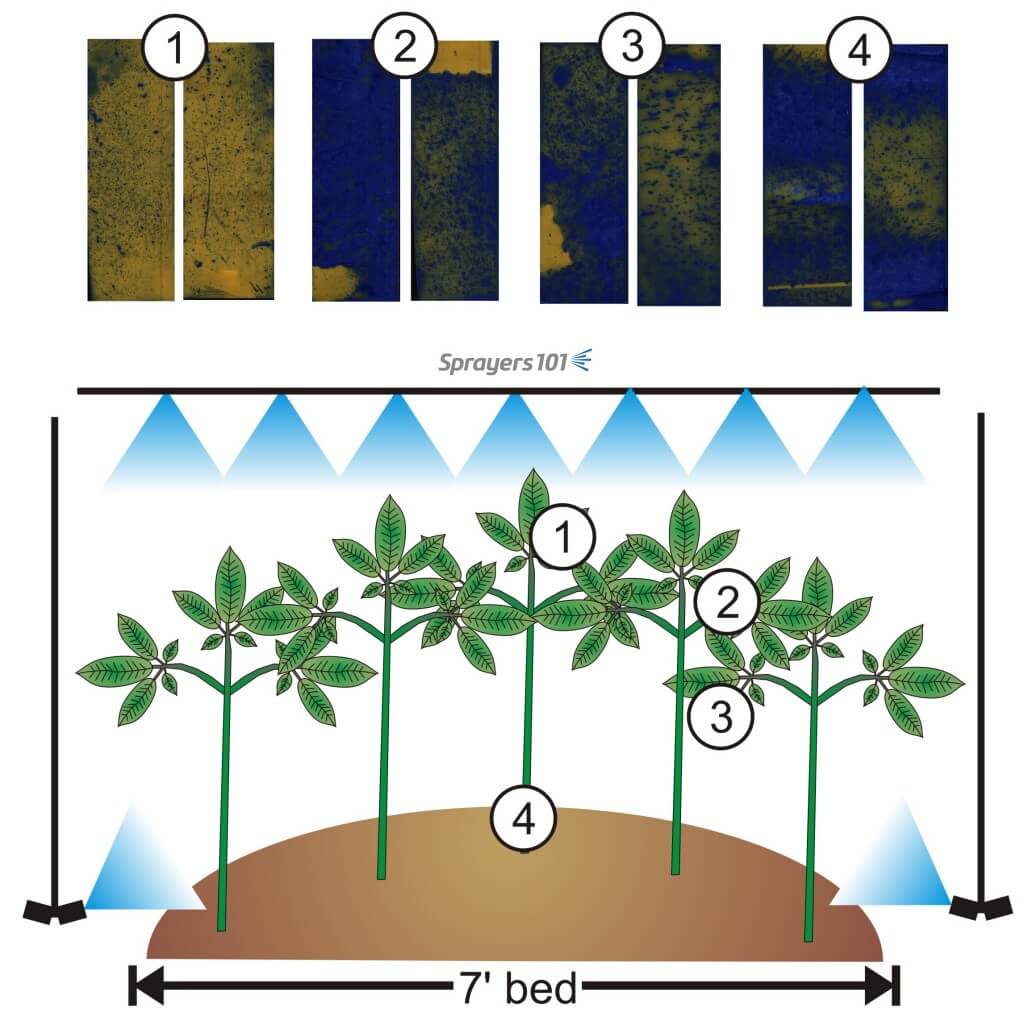
Position#1
Clipped face-down on the underside of leaves at the top of the canopy.
Position#2
Clipped face-up on the upper side of leaves in the middle of the canopy.
Position#3
Clipped face-down on the underside of leaves in the middle of the canopy.
Position#4
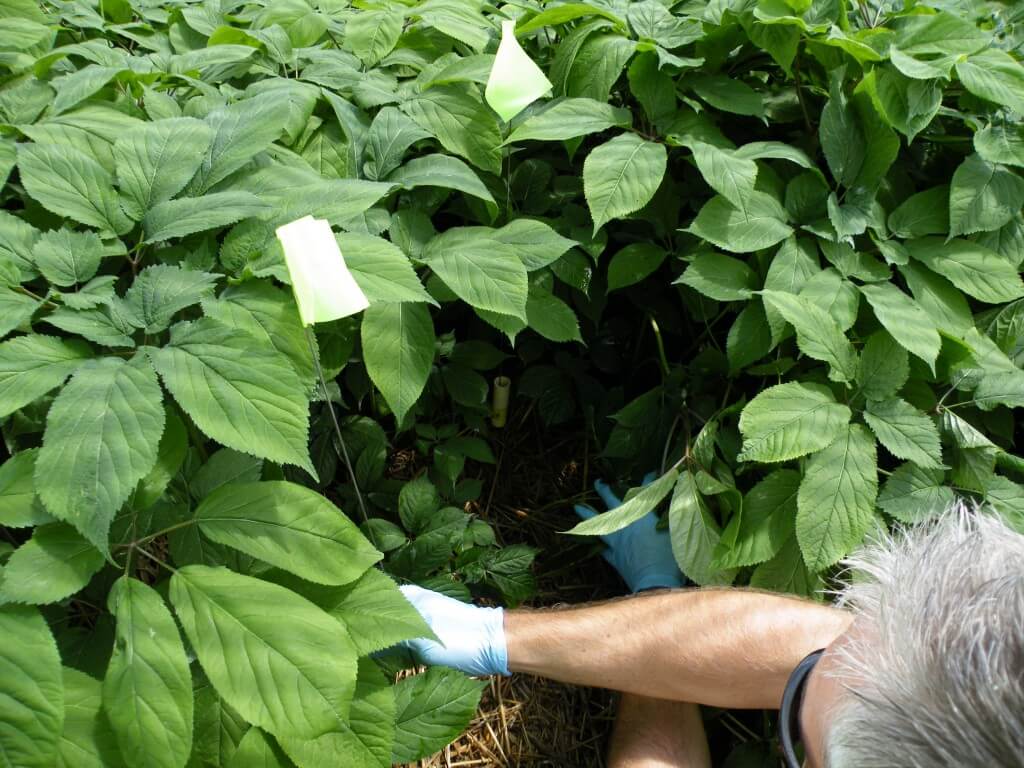
Wrapped around a plastic tube and threaded over a wire flag, located at the foot of the plant to give panoramic coverage at the root.
The sprayer passed over the canopy spraying water, and papers were carefully retrieved, allowed to dry and scanned.
Panoramic papers in situ.Flags mark the locations of papers.
Generally, there were no “misses” whatsoever. Position 1 showed excellent coverage, with no indication of run-off and a high droplet count with even distribution. This is ideal for foliar applications, and under-leaf coverage is notoriously difficult to achieve. Positions 2 through 4 showed excessive coverage, with the exception of one of the position 3 papers, which was still adequate.
Example of coverage and paper locations in canopy.
Next steps
Ideally, the operator would drop the pressure by 20 psi increments, reducing output until coverage failed. It is important to note that the operating pressure must never approach the lower end of the nozzle’s recommended pressure range, or the spray quality will be compromised and so will coverage.
Once the coverage is considered a failure, the operator would return to the lowest output that did a good job, and the sprayer is calibrated for that crop (at that stage of growth).
Note that the calibration must be performed for each significantly different crop. With the exception of an early-season drench intended to contact the entire root, an emerging one year old garden would need a very different prescription than a four year old garden with a fully-developed canopy. Plus, the weather conditions will affect coverage, so do not calibrate in conditions you would not normally spray in. Hot and dry and windy conditions produce very different coverage compared to cool, humid and still conditions.
Once the operator knows what each garden requires, they will be able to mix their tanks using the same concentration of carrier to formulated product as they normally use, but likely go further on the tank. It will take some practice before the operator knows how much spray mix is required to finish the job.


