Category: Coverage

All hort articles about achieving, confirming or correcting for spray coverage.

  • Crop-Adapted Spraying (CAS) and an Apple Orchard Case Study

    Crop-Adapted Spraying (CAS) and an Apple Orchard Case Study

    An orchard spraying scenario

    Here’s a common situation: An orchardist following IPM identifies a pest that poses an economic threat. It’s an annual pest and spraying is really a matter of when, not if. The operation is 150 acres and runs three airblast sprayers; two have a tower and one does not. Multiple varieties are planted in several blocks on different rootstocks and they are at different stages of maturity. The newer blocks are trellised high density trees and the older blocks are semi-dwarfs on different row spacing. Let’s also imagine the pruning team hasn’t finished yet, so some trees are not pruned.

    The orchardist turns to the pesticide label to decide how to spray such variable targets. It prescribes a range of doses per planted area (not canopy size), depending on the pest pressure. It advises the orchardist to use “enough water” to ensure “good coverage” without incurring “runoff”.

    The orchardist recognizes that the label is vague, and elects to rely on what has worked historically: A water-soluble pouch is dropped into each tank (dose is close enough), and each sprayer operator is instructed to drive at an efficient speed (get it done because rain is coming), spraying until the tank is empty. They say that if a tank is running low before the job is done, speed up and stretch it. If the spray is overshooting a younger planting, they suggest turning off the top nozzles and/or driving faster.

    Airblast operators face this situation regularly. The question is: “Is there a problem with spraying this way if it results in a respectable crop of quality fruit?” Agricultural engineers specializing in application technology in Spain, Australia, Great Britain and the United States say there is a problem, and on behalf of Canada, I completely agree with them.

    Canopy and Sprayer Variability

    The fundamental problem is inconsistent spray coverage and avoidable waste (of time, water and pesticide) due to variability. Our scenario notes multiple sprayer operators, different models of sprayer, and a range of varieties, orchard architectures and canopy management practices. The label does not allow for any of these factors, adhering to a rate based on planted area and remaining silent on water volume.

    International peer-reviewed journal articles stretching back to the sixties have conclusively demonstrated order-of-magnitude differences in the area-density of orchard canopies from one acre to the next. There can even be fold-differences in canopy area-density in the same planting as the season progresses. A label prescribing a fixed dose based on the area planted is not appropriate for any vine, bush, cane or tree crop, and the result is that more crops are over- or under-sprayed than receive appropriate coverage.

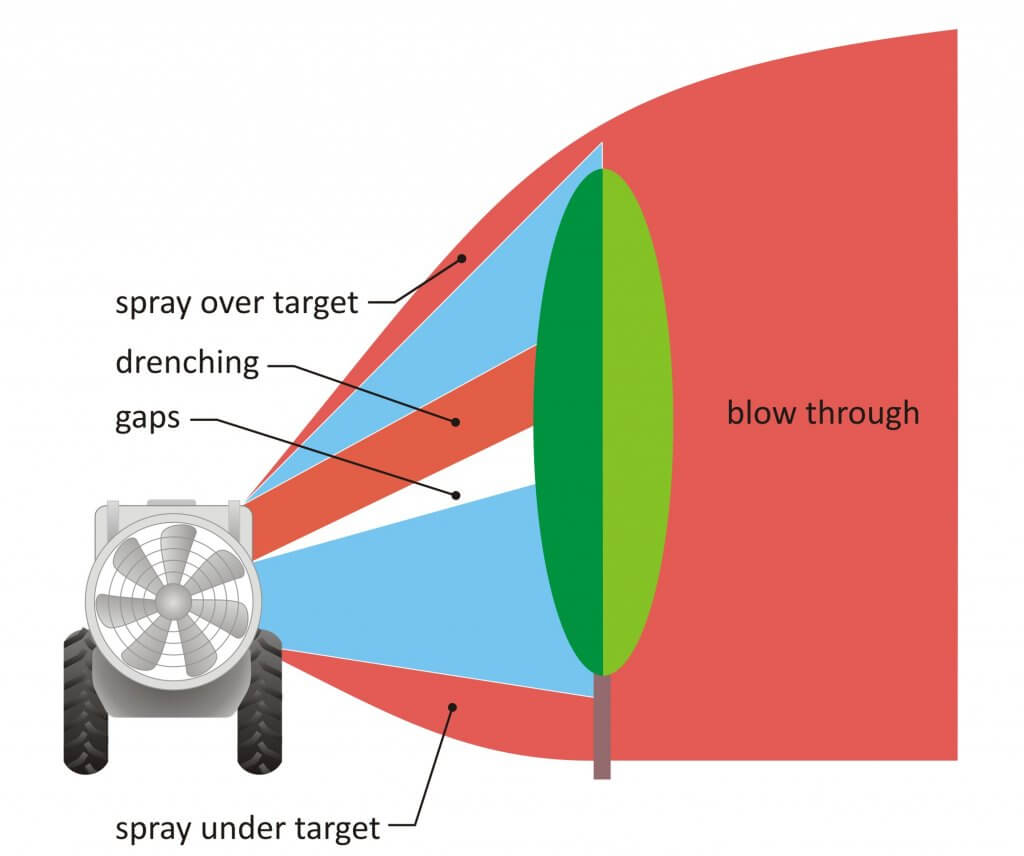
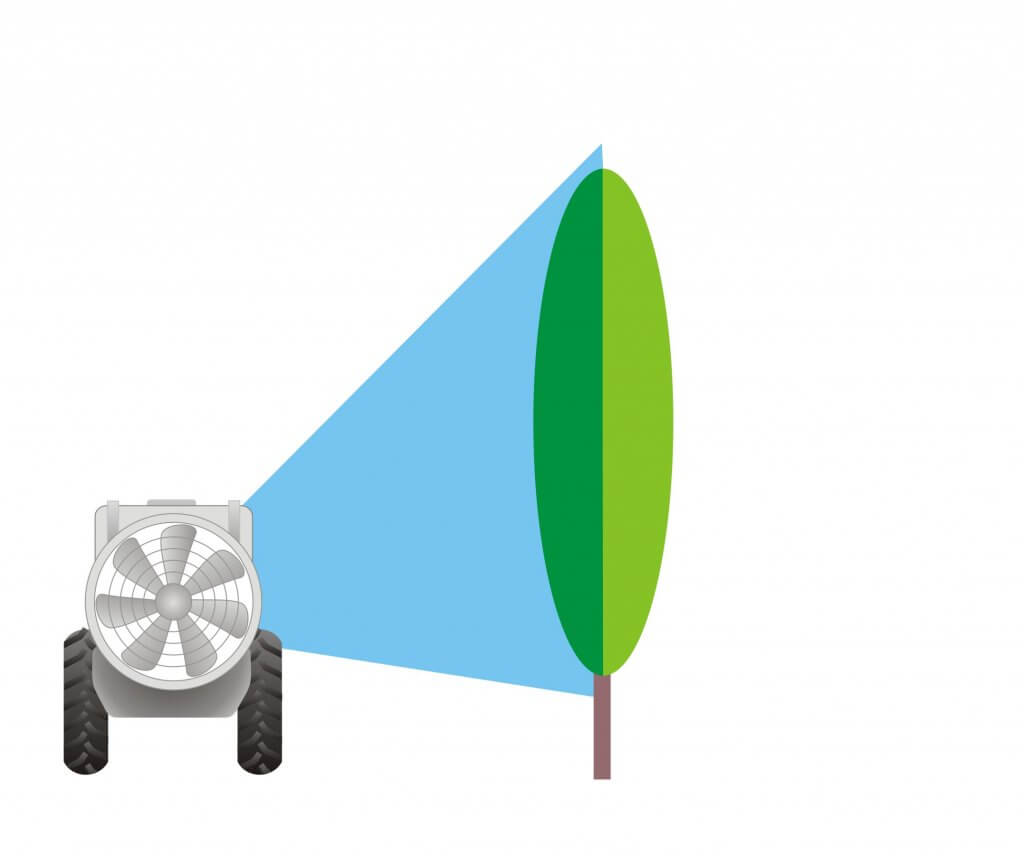
    Let us not forget the variability that comes from a poorly adjusted sprayer. I won’t to attempt to quantify the impact (although some researchers have suggested order-of-magnitude differences from sprayer to sprayer). Instead, let’s illustrate it as a conceptual “before and after”:

    Before: Potential spray loss and inconsistency before adjusting sprayer to match the canopy
    After: Coverage variability reduced and unnecessary waste mostly eliminated.

    Beyond the immediate impact on efficiency, variability makes it difficult to diagnose pesticide effectiveness. As an example, there was a scab outbreak in Ontario in 2009 that elicited questions about timing, weather, product choice and resistance. There was very little attention given to spray coverage, which to my mind should have been the first question if only to eliminate it as a potential culprit. This is because each operation interprets labels differently, and very few confirm coverage in any quantifiable way. This practice makes it more difficult to identify a cause when crop protection fails.

    Optimizing pesticide rates

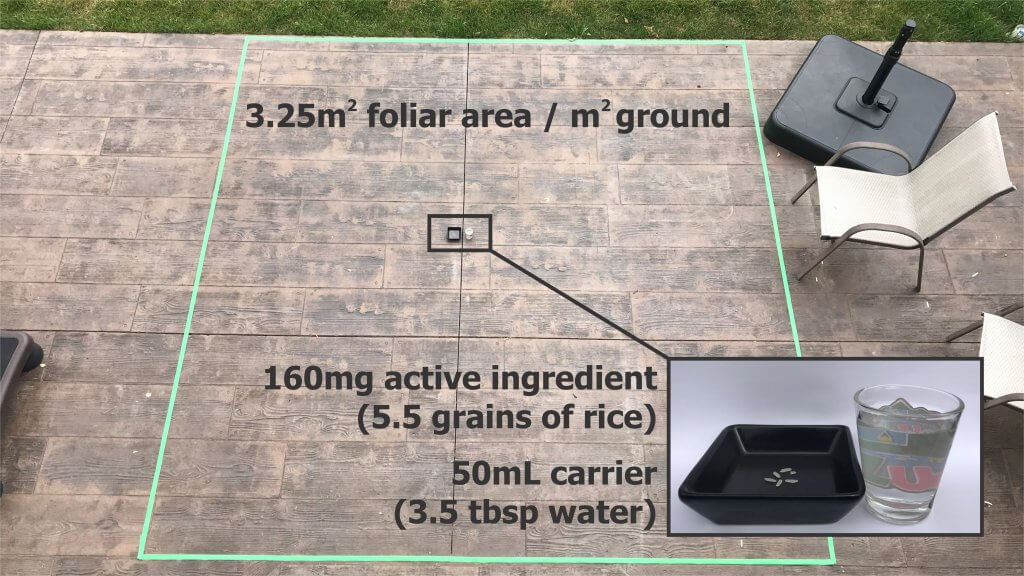
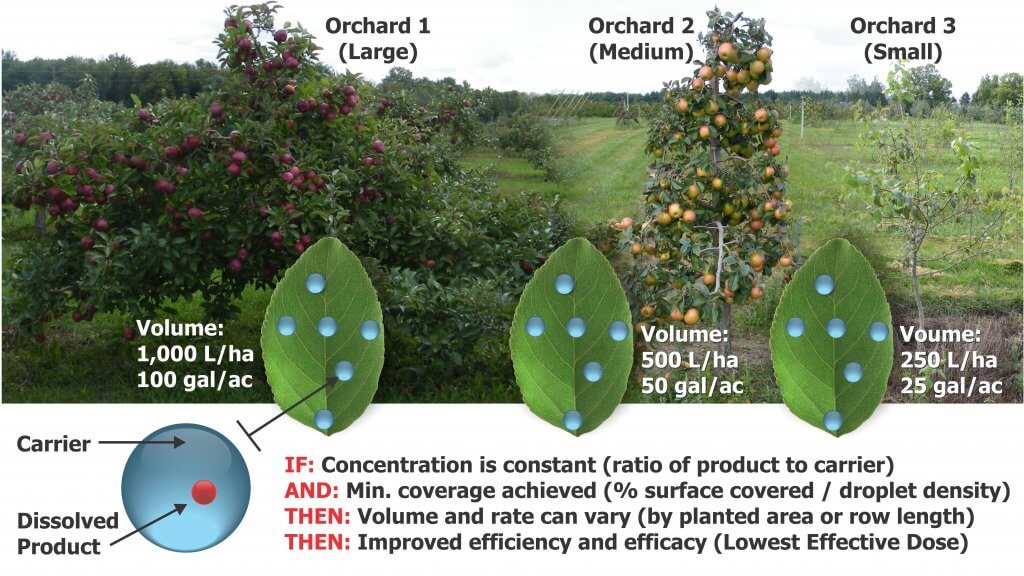
    That was a lot of preamble to describe an issue that many orchardists are already aware of. What is needed is a way to adjust the amount of pesticide per unit ground area (i.e. the label’s prescription) to achieve consistent foliar coverage for canopies of varying shape and density. The concept is visualized in the following figure. In addition, the method has to be simple, intuitive and effective.

    Many models have been proposed to tackle the dose expression issue, including Tree-Row Volume, Leaf Area Index, Leaf Wall Area, PACE+ and DOSAVIÑA. There are advantages and disadvantages to each method. Standing on the shoulders of giants, we combined aspects of each of these models, including incorporating coverage factor research from USDA ARS work in nurseries, to develop the Crop-Adapted Spraying (CAS) method. It is neither complicated nor sophisticated. It formalizes a series of qualitative calibration techniques and the objective is to achieve a target foliar coverage pattern. When achieved with sufficient accuracy, pesticide efficacy is maintained and waste is greatly reduced.

    Caveats

    Perhaps I shouldn’t point out flaws before I describe the model’s effectiveness, but it’s important to understand that CAS relies on a few critical assumptions.

    The first assumption is that the sprayer operator’s typical ratio of formulated product to carrier is appropriate. We need a starting point for adjusting the amount of pesticide per unit planted area, and unless the label specifies a concentration (i.e. a ratio of formulated product to water) or a minimum amount of product per planted area, this is a reasonable starting point. The appropriateness of this assumption is evidenced by a history of satisfactory pest control in the orchard.

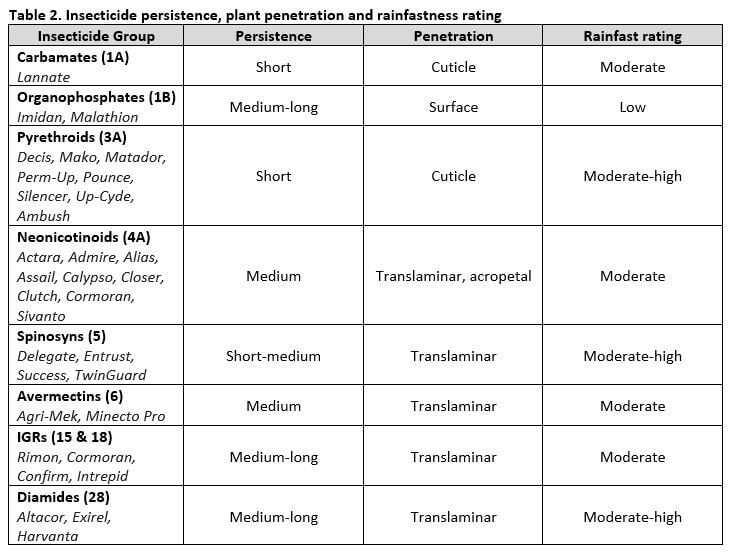
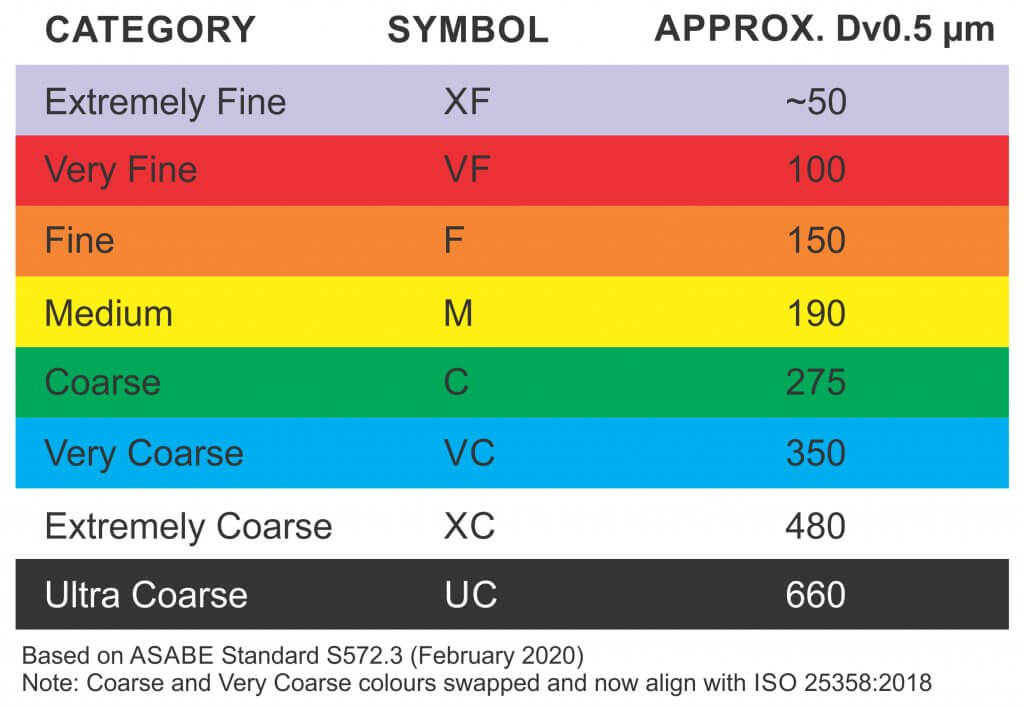
    The second assumption lies in defining a threshold for sufficient coverage, and this is a real challenge. Applications can be concentrate or dilute. Some products translocate in the leaf or redistribute on the leaf surface while others do not. Even the droplet size employed (e.g. A mist blower’s fines compared to Medium-Coarse droplets produced by an air induction nozzle) will affect dose, bioavailability and how long residues are active. So, how does one draw a universal line in the sand and say “this much is enough”?

    Our threshold for suitable foliar coverage has evolved through experience, literature review and independent experimentation in several countries and in multiple 3D cropping systems. We propose 10-15 % surface coverage and a minimum of 85 droplets per cm2on a minimum 80% of the canopy. This standard is intended to be practical, versatile and robust in order to safely represent sufficient coverage for most foliar insecticides and fungicides. It is not suitable for ultra-low volume sprayers (e.g. misters, foggers, air-shear), nor is it intended to be a rigorous, scientific absolute.

    For example, a drench application, such as streptomycin or dormant oils, will obviously require more coverage. Plant growth regulators like thinners, stop-drops and foliar nutrients have their own unique criteria. Products that work through vapour redistribution (e.g. some forms of sulfur) and bio-rational products have a minimal dose threshold that must be ensured per planted area, no matter the water volume used. In these cases, Crop-Adapted Spraying may not be appropriate.

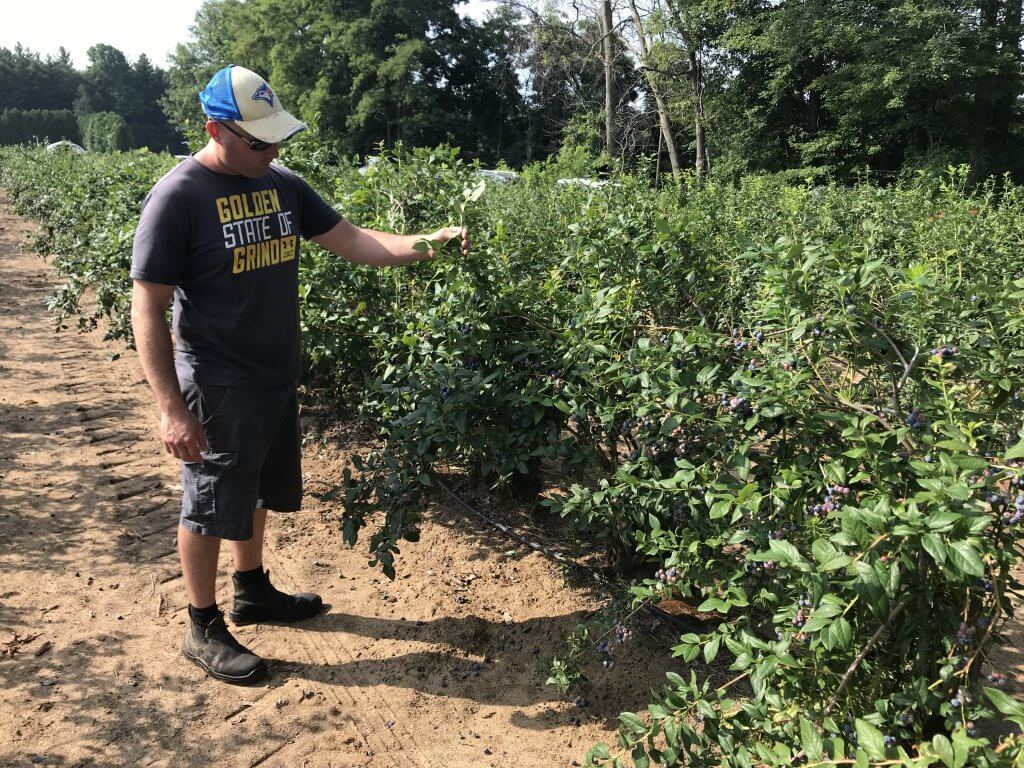
    So while it is the nature of models that they may not hold in every situation, this threshold has proved successful in multiple Ontario apple (later in this article) and highbush blueberry operations.

    The method

    The method is a simple and iterative approach that allows growers to adjust the product rate and sprayer output in relation to canopy and sprayer effects on deposits. Follow these steps to adjust the sprayer and optimize coverage. Only do so in conditions you would normally spray in.

    Step 1

    The sprayer should receive all seasonal maintenance prior to first use and undergo a visual inspection before each spray day.

    Step 2

    Park the sprayer in an alley between rows of trees and tie 25 cm (10 in) lengths of ribbon along the air outlet. That would be the deflectors on a low profile axial sprayer, the hubs of multifan systems or the ducted outlets on towers. Turn on the air and extrapolate where the air is aimed. Adjust the air to just overshoot the top of the canopy.

    Step 3

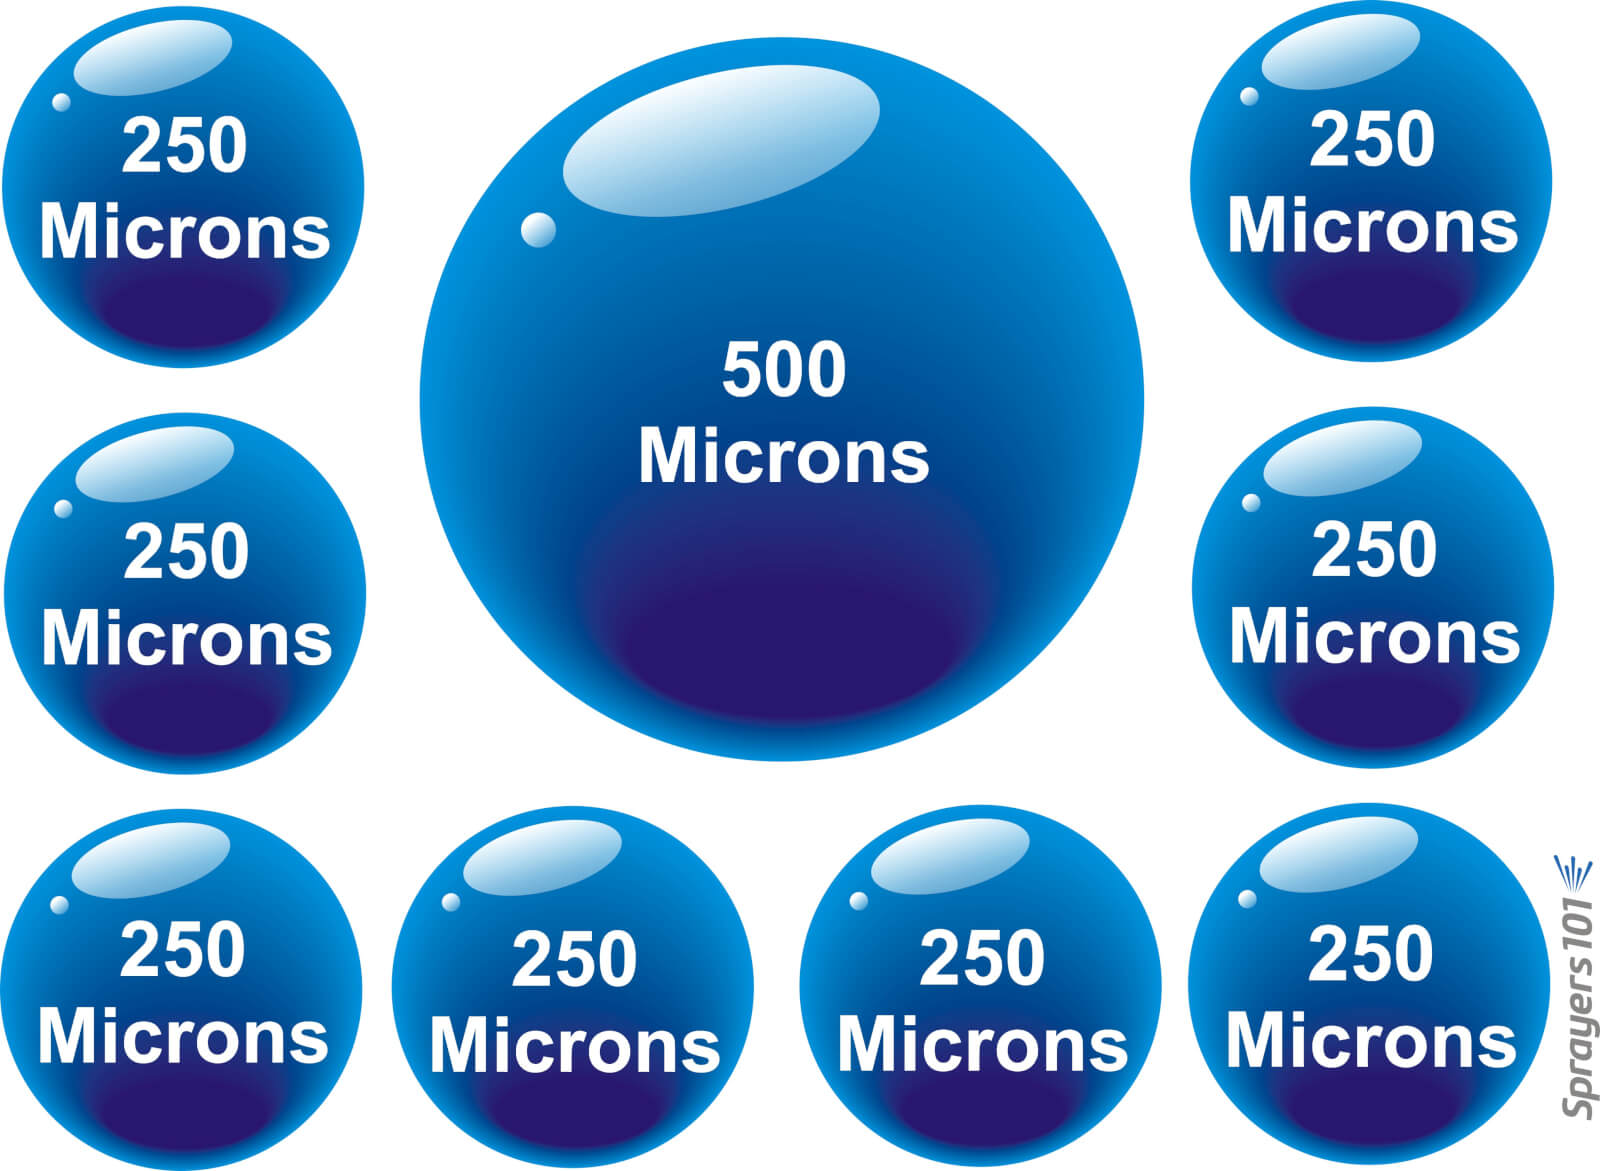
    It is important that the spray slightly overshoot the canopy height. It is less important to spray the lowest point of the canopy as secondary deposition tends to provide sufficient coverage. This may change if fruit weighs down the branches. Ensuring a full swath, turn off any nozzles that are not required. For small and medium canopy sizes, consider using air-induction hollow cones in the top positions of each boom to reduce drift. You may have to increase the rate in those positions to compensate for the fact that nozzles producing larger droplets produce fewer droplets.

    Step 4

    Affix 25 cm (10 in) ribbons to the upwind and far side of one or more trees. At minimum, affix them at the treetop and along the widest portion of the canopy. With the tank half-full of water, drive past in the spraying gear at the ideal RPMs with the air on. A partner in the next alley should see the highest ribbon move. Ideally the other ribbons will waft as well, but in large, dense canopies they may not. In this case, ensure leaves are moving beyond the trunk. No ribbons should strain straight-out.

    This will determine if more/less air is required from the airblast sprayer. The operator can change fan speed (e.g. fan gear), or adjust the sprayer’s travel speed. Lower speed causes air to go higher and deeper and vice versa. In some cases, operators can reduce fan speed by reducing the tractor PTO revolutions by gearing up and throttling down. When air is corrected, determine ground speed in the orchard using smartphone GPS app or a calibration formula.

    Step 5

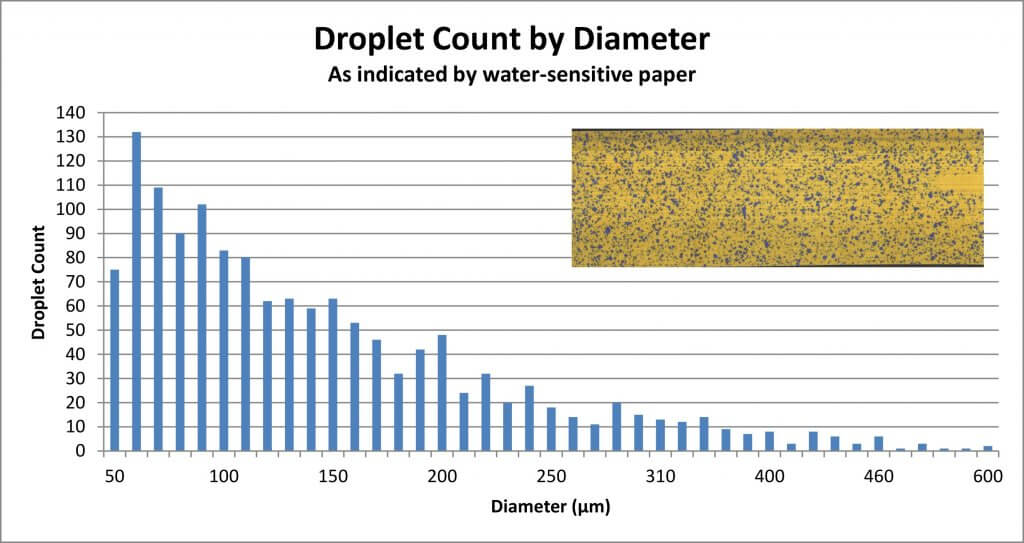
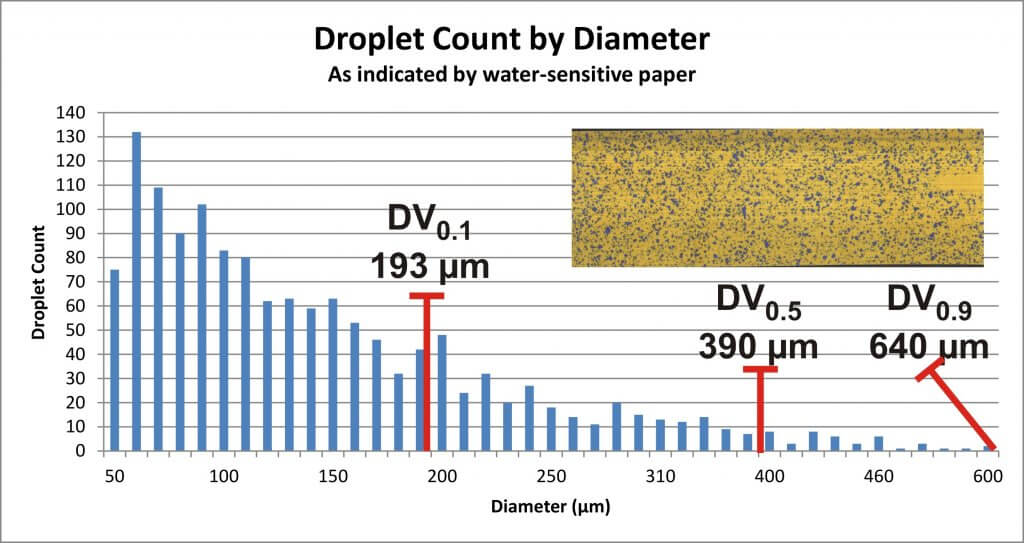
    Place and interpret water-sensitive papers per this article. If coverage is excessive, reduce output in corresponding nozzle positions (by replacing them with lower rate nozzles). If you see less than ideal coverage, increase the nozzle rates in those positions.

    Be aware that excessive coverage may be unavoidable in the outer edge of the canopy, given that spray must pass through to get to the centre. It is not unusual to see half the deposition mid-canopy when the outside is saturated. Also be aware that ambient wind speed and humidity have significant impacts on coverage. Therefore, only test coverage in conditions similar to your typical spraying conditions.

    Step 6

    When the canopy grows and fills in sufficiently (usually after petal fall), you may have to reassess coverage to reflect a larger, denser canopy with more surface area. Given the critical nature of early season fungicide applications, it may be preferable to have slightly excessive coverage early season and allowing it to self-correct as the season proceeds. If you are suspicious that the spray is being stretched too thin or you are unsatisfied with the coverage, increase the output.

    For high density trees, there may be no need to increase output mid-season. Early in the season, wind travels relatively unimpeded in a high-density orchard and will blow spray off course, reducing coverage and requiring higher water volumes or possibly more air to compensate. As the trees fill in, the average wind speed is reduced and more spray can impact on the target.

    Mixing and Work Rate

    When the correct sprayer settings and volumes have been determined, the operator will mix their spray tank as they would for their typical application. The sprayer will likely cover more orchard than it has in the past, and the operator will have to re-assess how many tanks are required pre and post petal-fall. If your sprayer is employs conventional hydraulic nozzles (that is, it is not a low-volume sprayer), it is not advisable to go below 400 L/ha (~40 gpa).

    This is where OrchardMAX (the free CAS calculator app) can help the operator ballpark the correct rates for each nozzle position and estimate work rate, tanks required, and any potential savings in product.

    Yes. There’s an app for that.

    Apple Orchard Case Study

    Three Ontario apple orchards (and one Nova Scotia orchard) agreed to test the model. A block of trees was randomly selected from each operation to serve as the treatment condition. These trees received spray according to the CAS model. The rest of the orchard was sprayed according to the grower’s traditional methods. The orchards included several varieties and represented both semi-dwarf and high density plantings.

    OrchardTypical spray volume (Control)CAS spray volume (Treatment)% SavingsVarieties (age)Orchard StructureYears in study
    Orchard 1486 L/ha373 L/ha23%Gala + g. Del (~10 yr old)High density3
    Orchard 2748 L/ha478 L/ha &

    608 L/ha = 543 L/ha

    28%Macs + Empires (~30 yr old)Semi-dwarf3+
    Orchard 3577 L/ha

    (660 L/ha)

    407 L/ha39%

    (38%)

    Gala + Fuji (~20 yr old)High density2
    Nova Scotia544 L/ha416 L/ha33%Jonogold (~10 yr old)High density1+

    According to the model, each grower sprayed anywhere from 20-35% less per hectare in the CAS block than in their traditionally-sprayed block. In many cases, the overall canopy coverage was improved in the CAS block compared to the traditional method simply by aiming formally wasted spray into the canopy, and reducing volume in those areas that were unnecessarily drenched.

    A scout was dispatched to monitor insect and disease activity each week for ~15 weeks. They observed a typical IPM scouting protocol and were not informed which block was the traditional control and which was CAS treatment. Data was transformed where appropriate for analysis of variance. In almost every case, there was no significant difference in counts between the CAS treatment and the grower’s traditionally-sprayed control (p=0.05). In those few cases where a pest had higher counts in the CAS block, the counts were so far below a spray threshold as to be insignificant.

    If we look more closely at the three (of 128) ANOVA comparisons of control to treatment, we see that economic thresholds are rarely an issue, and essentially, difference between control and treatment are moot.

    2015_TSSM_O1_Y2
    2015_ERM_O1_Y3
    2015_ERM_O1_Y2

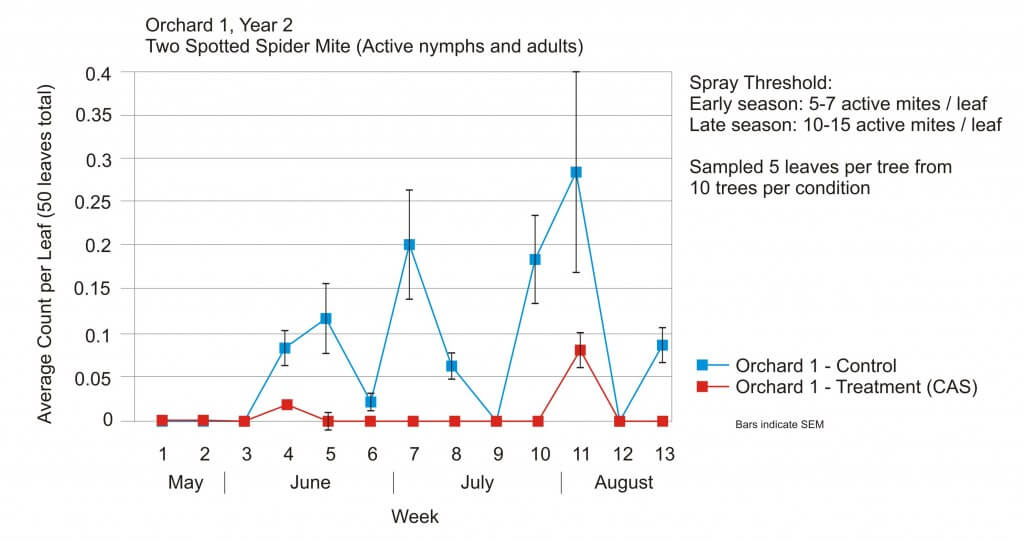
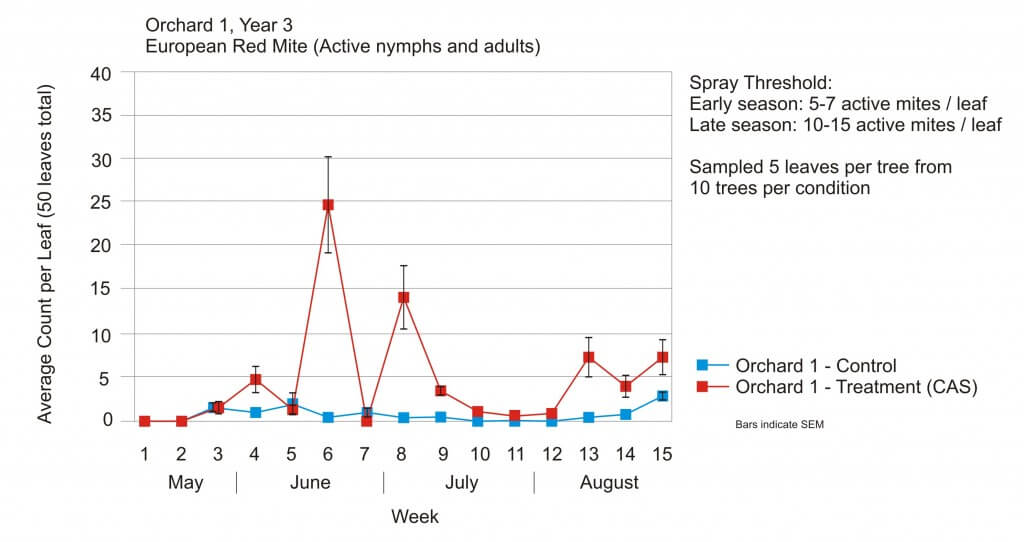
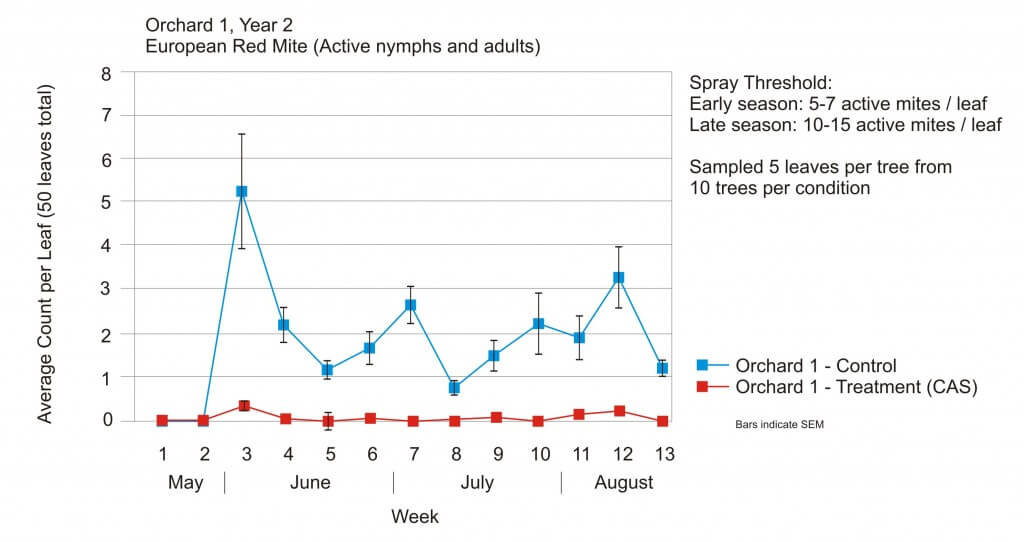
    This study was repeated over three years. Having examined the data to determine if three years of optimized doses had any effect on pest populations, results suggest no such effect.

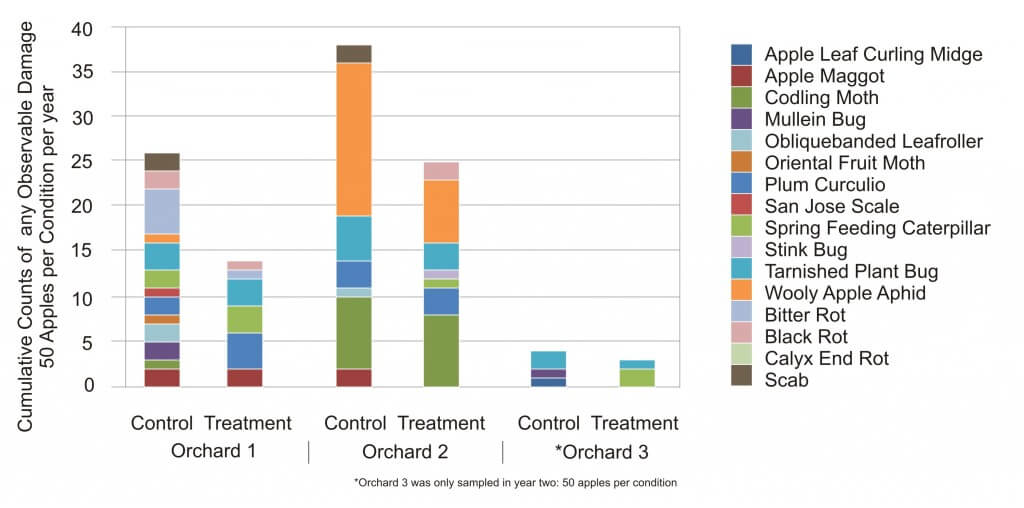
    Apples were randomly sampled for destructive analysis at harvest and the total counts of any and all damage are shown below. This is simply a tally, and no statistical significance is implied. Note that Orchard 3 was only involved in the study for two years, and unfortunately a killing frost destroyed their harvest in their second year, so we didn’t have much to harvest.

    Apple_data_3_years

    An important part of knowledge transfer is whether or not growers will choose to adopt a method once the instructor is gone. By year two the biggest challenge was ensuring the orchardists in the study continued to spray the control block at their traditional volumes! They were more than willing to adopt the method wholesale and all three did so starting in 2016. Further, colleagues in Nova Scotia performed their own CAS trial for two years, and reported no significant difference in pest activity or apple quality. They accomplished this simply by following a written protocol.

    The orchardist’s enthusiasm, the ability for the study to be replicated without my direct involvement, and the successful results speak to the viability of the method.

    We would like to thank the researchers that developed the methods CAS is based upon, statistician Behrouz Eshani, the orchards that cooperated in the study, my OMAFRA colleagues and the OMAFRA summer students that scouted those orchards for three years.

    More information

    This method of application is really no more sophisticated than the pro rata practice of turning off nozzles that are aiming at the ground or above the target. It will take time for operators to get comfortable with the new volumes (and potentially reduced dosage) and regular scouting is highly encouraged to confirm they are achieving control.

    The maintenance, calibration and operation of an airblast sprayer is an involved process. Collectively, the sprayer setup, weather and crop morphology all influence the coverage obtained from an application. A fundamental understanding of application technology is required before attempting to optimize dosage using the CAS method. We suggest grabbing a copy of the second edition of Airblast101 – Your Guide to Effective and Efficient Spraying. The digital version is a free download, but you can buy a hardcopy as well.

    Finally, take a few minutes to watch this video by AAMS-Salvarani. In many European countries such as Belgium , France and Germany, sprayers must be calibrated regularly. While there is no mention of air speed adjustments, many of the steps in this video correspond with the airblast adjustments relating to Crop-Adapted Spraying.

  • Perspective on Rates, Volumes and Coverage

    Perspective on Rates, Volumes and Coverage

    This short article is a thought exercise designed to give some perspective on chemical rates, carrier volumes and the foliar area we expect them to protect.

    Imagine we are spraying the fungicide Captan on highbush blueberry. In Canada, the label rate is to apply 2kg/ha (28.5oz/ac) of planted area. Captan is 80% active ingredient, so a quick unit conversion tells us our objective is to apply 160mg of active ingredient per m2 of planted area. Let us suppose we will use 500L of carrier per hectare (53.5 gal/ac), which converts to 50mL/m2.

    Now let’s say the blueberry patch is mature and well pruned. Each plant has a footprint of 1.2m by 1.2m (4ft by 4ft) and is 1.5m (5ft) high. The Leaf Area Index (LAI) is the one-sided green leaf area per unit ground surface area (LAI = leaf area / ground area) in broadleaf canopies. Assuming a conservative LAI of 2, that’s 2.88m2 (65ft2) of leaf surface area per plant. We double that figure since we want to spray both sides of the leaves, and then assuming the bushes are planted on 3m (10ft) alleys we arrive at a total foliar surface area per planted area of 3.25m2/m2 (3.25ft2/ft2).

    A grower with his mature, well-pruned blueberries. 4′ x 4′ on 10′ alleys.

    Let’s take these figures and convert them to something we can picture. An average grain of rice weighs 29mg and there are 15mL in a single tablespoon. What this means is that a sprayer operator’s goal is to dissolve active ingredient with a weight equivalent to 5.5 grains of rice in 3.5 tbsp of water and distribute it evenly over 3.25m2 (35ft2) of surface area!

    Now that’s perspective.

    This photo shows how much foliar surface area exists in a square meter of mature highbush blueberry. In the centre is the typical amount of active ingredient and water that must be distributed over that area. It’s amazing what we ask of an air-assist sprayer.
  • Rainfastness of Insecticides and Fungicides on Fruit

    Rainfastness of Insecticides and Fungicides on Fruit

    This article was co-authored by Kristy Grigg-McGuffin, OMAFA Horticulture IPM Specialist

    In view of the frequent heavy rains in many regions this season, understanding rainfastness, or the ability of a pesticide to withstand rainfall, is important to ensure proper efficacy. All pesticides require a certain amount of drying time between application and a rain event. Typically, residue loss by wash-off is greatest when rain occurs within 24 hours of spraying. After this point, the rainfastness of a product will depend on formulation, adjuvants and length of time since application.

    Rainfastness of Insecticides

    John Wise, Michigan State University has studied rainfastness of common tree fruit insecticide groups and his findings are summarized below. For the complete article, refer here. Note that some products listed in this article may not be registered for use in Canada. Check with your local supplier or in Ontario, refer to OMAFA Publication 360 for a complete list of registered products.

    According to Wise, the impact of rain on an insecticide’s performance can be influenced by the following:

    1- Penetration

    Penetration into plant tissue is generally expected to enhance rainfastness.

    • Organophosphates have limited penetrative
      potential, and thus considered primarily surface materials.
    • Carbamates and pyrethroids penetrate the cuticle,
      providing some resistance to wash-off.
    • Spinosyns, diamides, avermectins and some insect
      growth regulators (IGR) readily penetrate the cuticle and move translaminar (top
      to bottom) in the leaf tissue.
    • Neonicotinoids are considered systemic or
      locally systemic, moving translaminar as
      well as through the vascular system to the growing tips of leaves (acropetal
      movement).
    • For products that are systemic or translaminar,
      portions of the active ingredient move into and within the plant tissue, but
      there is always a portion remaining on the surface or bound to the waxy cuticle
      that is susceptible to wash-off.

    2- Environmental persistence and inherent toxicity

    Environmental persistence and inherent toxicity to the target pest can compensate for wash-off and delay the need for immediate re-application.

    • Organophosphates are highly susceptible to
      wash-off, but are highly toxic to most target pests, which means re-application
      can be delayed.
    • Carbamates and IGRs are moderately susceptible
      to wash-off, and vary widely in toxicity to target pests.
    • Neonicotinoids are moderately susceptible to
      wash-off, with residues that have moved systemically into tissue being highly
      rainfast, and surface residues less so.
    • Spinosyns, diamides, avermectins and pyrethroids
      are moderate to highly rainfast.

    3- Drying time

    Drying time can significantly influence rainfastness, especially when plant penetration is important. For instance, while 2 to 6 hours is sufficient drying time for many insecticides, neonicotinoids require up to 24 hours for optimal penetration prior to a rain event.

    4- Adjuvants

    Spray adjuvants that aid in the retention, penetration or spread will enhance the performance of an insecticide.

    The following tables can serve as a guide for general rainfastness to compliment a comprehensive pest management decision-making process. They are adapted from “Rainfast characteristics of insecticides on fruit” by John Wise, Michigan State University Extension.

    Based on simulated rainfall studies to combine rainfastness with residual performance after field-aging of various insecticides, including carbamates (Lannate), organophosphates (Imidan, Malathion), pyrethroids (Capture), neonicotinoids (Assail, Actara, Admire), IGRs (Rimon, Intrepid), spinosyns (Delegate) and diamides (Altacor), Wise recommends the following re-application decisions for apples. Additional work was done on grapes and blueberries; see Wise’s article for this information. Among the crops, variation in rainfastness of a specific insecticide occurs since the fruit and leaves of each crop have unique attributes that influence the binding affinity and penetrative potential.

    • ½ inch (1.25
      cm) rainfall:
      All products with 1-day old residues could withstand ½ inch
      of rain. However, if the residues have aged 7 days, immediate re-application
      would be needed for all products but Assail, Rimon, Delegate or Altacor on
      apples.
    • 1-inch (2.5
      cm) rainfall:
      In general, most products would need re-application following
      a 1-inch rainfall with 7-day old residues, whereas Delegate and Altacor could
      withstand this amount of rain on apples and would not need to be immediately
      re-applied. Some products such as Imidan on apples could withstand 1 inch of
      rain with 1-day old residues.
    • 2-inch (5
      cm) rainfall
      : For all products, 2 inches of rain will remove enough
      insecticide to make immediate re-application necessary.

    It is important to note, not all products registered for the selected pests were included in this study. Refer to Publication 360 for a complete list of management options.

    Rainfastness of Fungicides

    There is no comparable research on rainfastness of fungicides and few labels provide this kind of information. A general rule of thumb often used is that 1 inch (2.5 cm) of rain removes approximately 50% of protectant fungicide residue and over 2 inches (5 cm) of rain will remove most of the residue. However, many newer formulations or with the addition of spreader-stickers, some products may be more resistant to wash-off. Avoid putting on fungicides within several hours before a rainstorm as much can be lost to wash-off regardless of formulation. As well, there are exceptions to the general rule in regard to truly systemic fungicides such as Aliette and Phostrol.

    The effectiveness of sticker-spreaders with fungicides is variable and product/crop specific. Penetrating agents don’t help strobilurins; in fact, some fungicide/crop combinations have been associated with minor phytotoxicity due to excessive uptake. Captan, which is intended to stay on the surface, is notorious for causing injury when mixed with oils or some penetrating surfactants that cause them to penetrate the waxy cuticle.  Consult labels for minimum drying times for individual products and recommendations for using surfactants. 

    Annemiek Schilder, Michigan State University suggests the following to improve fungicide efficacy during wet weather:

    • During rainy periods, systemic fungicides tend
      to perform better than protectant (or contact) fungicides since they are less prone
      to wash-off.
    • Applying a higher labelled rate can extend the
      residual period.
    • Apply protectant fungicides such as captan
      (Supra Captan, Maestro), mancozeb (Manzate, Dithane, Penncozeb) and metiram
      (Polyram) during sunny, dry conditions to allow for quick drying on the leaves.
      These types of fungicides are better absorbed and become rainfast over several
      days after application.
    • Apply systemic fungicides such as sterol
      inhibitors (Nova, Fullback, Inspire Super), SDHI (Fontelis, Sercadis, Kenja, Aprovia
      Top, Luna Tranquility) and strobilurins (Flint, Sovran, Pristine) under humid,
      cloudy conditions. The leaf cuticle will be swollen, allowing quicker
      absorption. In dry, hot conditions, the cuticle can become flattened and less
      permeable, so product can breakdown in sunlight, heat or microbial activity or
      be washed off by rain.

    Click here to refer to the complete article.

  • What’s with dew? – Tips with Tom #9

    What’s with dew? – Tips with Tom #9

    When warm air is cooled, it loses some of its moisture-holding capabilities. This change often occurs at night, when plants (and other objects) cool. Once the temperature of the surface of the leaves, for example, drops below the dewpoint, it causes water to condense, forming the shiny dew that causes so many to question early morning spray applications.

    The question is often: will the spray run off the plant or will it get so diluted that it doesn’t work anymore?

    In a dew chamber, work has shown that large spray droplets are more likely to run off a plant saturated with dew than their smaller counterparts. However, similar work showed that spray efficacy was not altered by droplet size.

    Wolf discusses this work and the potential answer to the seemingly conflicting findings. Wolf also explains how grassy weeds compare to broadleaves, the role of surfactants, and what to consider when making the decision to spray through dew or not.

  • How Airblast Spray Droplets Behave (or Misbehave)

    How Airblast Spray Droplets Behave (or Misbehave)

    Listen to article here.

    Some pesticide labels require or prohibit certain droplet sizes to reduce the potential for drift. But, even when labels are silent about size restrictions, operators should be aware of the potential for droplet size to affect coverage. In the case of airblast, droplets should be:

    • large enough to survive evaporation between nozzle and target.
    • small enough to adhere without drifting off course.
    • plentiful enough to provide uniform coverage without compromising productivity (e.g. affecting refills and travel speed).

    Once spray leaves the nozzle, the operator has no more control over the application, so it’s important to plan for as many contributing factors as possible. Deciding which nozzles to use (and yes, you have alternatives beyond disc-core), requires an understanding spray quality symbols and basic droplet behaviour.

    Spray Quality

    Droplet diameter is measured in microns (µm). For a given pressure, a nozzle creates a range of droplet sizes which are described by the American Society of Agricultural and Biological Engineers (ASABE) standard S572.3 (Feb. 2020) In North America, these spray quality ratings range from “Extremely Fine – XF” to “Ultra Coarse – UC”. For interest, the scale is based on the British Crop Protection Council (BCPC) system, which is slightly different.

    To make sense of the spray quality rating, we must first understand that not every droplet produced by a hydraulic nozzle is the same size. We noted that a single nozzle produces a range of droplet sizes. Spray quality captures that span using a few key metrics. The first is the Volume Median Diameter (VMD) or DV0.5. Think of it this way: Let’s say you have a hollow cone nozzle that breaks a volume of liquid up into droplets. Let’s arrange them from finest to coarsest as in the following graph.

    The DV0.5 refers to the droplet size where half the spray volume is comprised droplets smaller than the DV0.5, and the other half is comprised of larger droplets. But we need more to understand the variation in the population. In other words, are they all the same size, or do they vary a great deal?

    That’s why we also assign a DV0.1 which tells us the droplet size where 10% of the spray volume is comprised of smaller droplets, and a DV0.9 which indicates that 10% of the spray volume is comprised of larger droplets. Let’s add them to the graph:

    With all three numbers, we can calculate the Relative Span (RS) by subtracting the DV0.1 from the DV0.9 and dividing by the DV0.5. The smaller the resulting number, the less variation there is in the spray quality. Two nozzles might produce a range of droplets with the same DV0.5, but the one with the larger RS is more variable, and is more likely to drift. Since we don’t typically have access to the RS of each nozzle, we rely on the spray quality symbols in nozzle catalogues to alert us to potential drift issues.

    Relative Droplet Size

    Did you notice in the graph that there are a lot of Fine droplets compared to Coarse?  Disc-core (or disc-whirl) nozzles do not have spray quality ratings, and moulded hollow cones may or may not. This is, in part, because the standard was developed for flat fan nozzles, but mostly it arises from the nature of airblast spraying. No matter the original droplet diameter, the air shear from the sprayer and the distance-to-target reduce the DV0.5 considerably by the time spray reaches the target. It is safe to assume that the final spray quality will be much finer than the nozzle’s rating.

    Incidentally, this is a big difference between boom sprayers and airblast: Where the boom sprayer operator should be aware of how pressure affects droplet size, it’s of little consequence to an airblast operator. On an airblast sprayer, pressure really only affects nozzle rate.

    So, while shear and evaporation raise drift potential, shear also increases droplet count. Imagine the volume a nozzle emits as a cake. No matter how many slices you cut the cake into, you still have the same amount of cake. The finer the slices, the more people can have a slice, albeit not very much. Similarly, a single Coarse droplet can contain the same volume as many finer droplets. Mathematically, a droplet with diameter X represents the same volume as eight droplets with diameters of 1/2X. See the illustration below:

    The one to eight rule: Every time the median diameter of spray is doubled, there are eight times fewer droplets. Conversely, every time the median diameter of spray is halved, there are eight times more.
    The eight to one rule: Every time the diameter of a droplet spray is doubled, there are eight times fewer droplets. Conversely, every time the diameter of a droplet is halved, there are eight times more.

    Droplet Behaviour

    The droplets that comprise the spray behave differently from one another. Finer droplets have a low settling velocity, which means they take a long time to fall out of the air. Conversely, coarser droplets fall out of the air more quickly. Think of how a ping pong ball (the finer droplet) has much less mass than a golf ball (the coarser droplet). When thrown into the wind, the golf ball follows a simple trajectory before falling. The ping-pong ball behaves erratically, like a soap bubble. Wind, thermals, humidity and many other factors will change where it goes because it is too light to resist them. It may even land behind the thrower, blown by the prevailing wind.

    It is because of the behaviour of finer droplets, and the airblast sprayer’s inclination to create them, that we must be so diligent when we adjust the air settings.

    We once explored this at a nursery workshop. The operator was spraying whips, which are young trees with very few lateral branches. He used a cannon sprayer to cover 30 rows (15 from each side) and felt he would incur less drift if he just used pressure, not air, to propel the spray. Water sensitive paper exposed the erratic coverage that resulted. Coverage uniformity was greatly improved when air was used, even when only spraying from one side of the 30 row block. Of course, this was only to demonstrate a principle; we don’t recommend alternate-row-middle-spraying.

    Air-induction nozzles can be used to increase the median droplet size on an airblast sprayer. When used in the top nozzles positions, the coarser droplets that miss the top of tall targets will ultimately fall (reducing drift). They can also be used in positions that correspond to restricted airflow. In this case the operator relies on pressure to propel the coarser droplets where there is limited air to carry finer droplets.

    Conclusion

    The net result of all this is that the sprayer operator must choose a nozzle, pressure, and travel speed while considering the effect of distance-to-target and the weather. The resultant range of droplets should be fine enough to increase droplet count and be carried by sprayer air to deposit uniformly throughout the canopy. However, droplets should also be coarse enough to reduce drift if they miss.

    Hey, if it was easy, anyone could do it!

    Move ahead to 29:40 to watch a video describing how droplets behave an misbehave. Ahhhh Covid-hair. It was a thing.