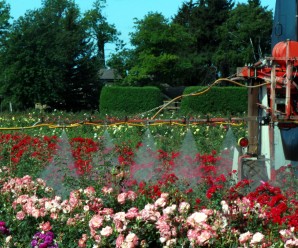
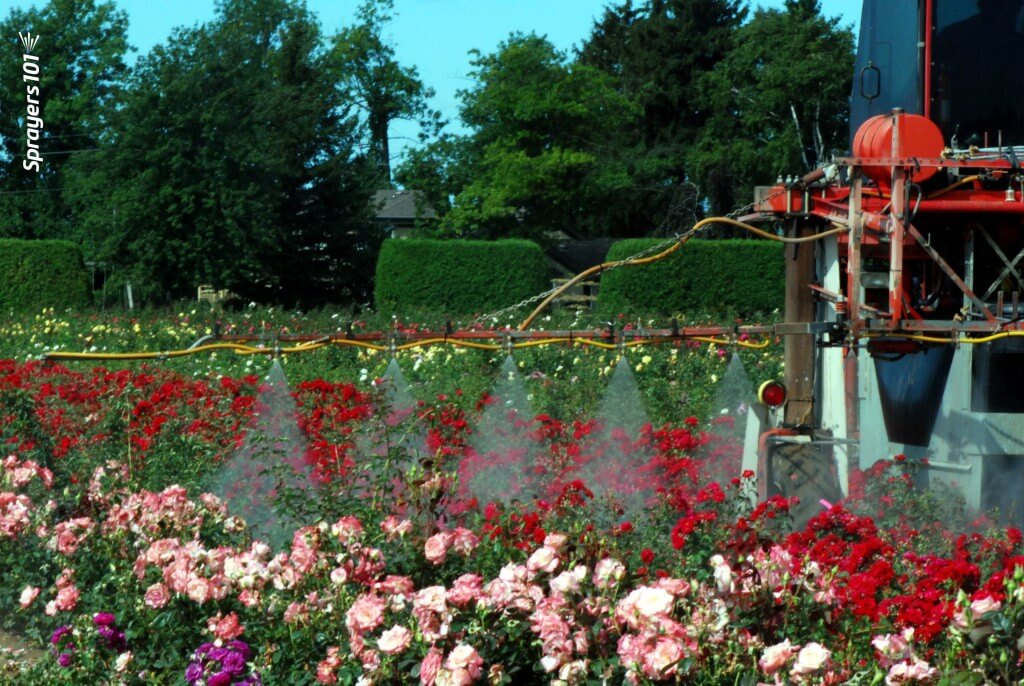
We always admire the photos of sprayers in tulips produced by the Netherlands. Rose protection in Ontario is equally beautiful.
Nursery growers apply pesticides to a diverse range of plant species. In a perfect world, sprayer operators would adjust their sprayer set-up to match each crop, but this is rarely done because of time constraints and a lack of guidance. Adjustments in product rate and spray distribution should reflect the plant size, row spacing and developmental stage of the crop and pest. Any such adjustments should be performed using a reference point for coverage and a strong history of efficacy.
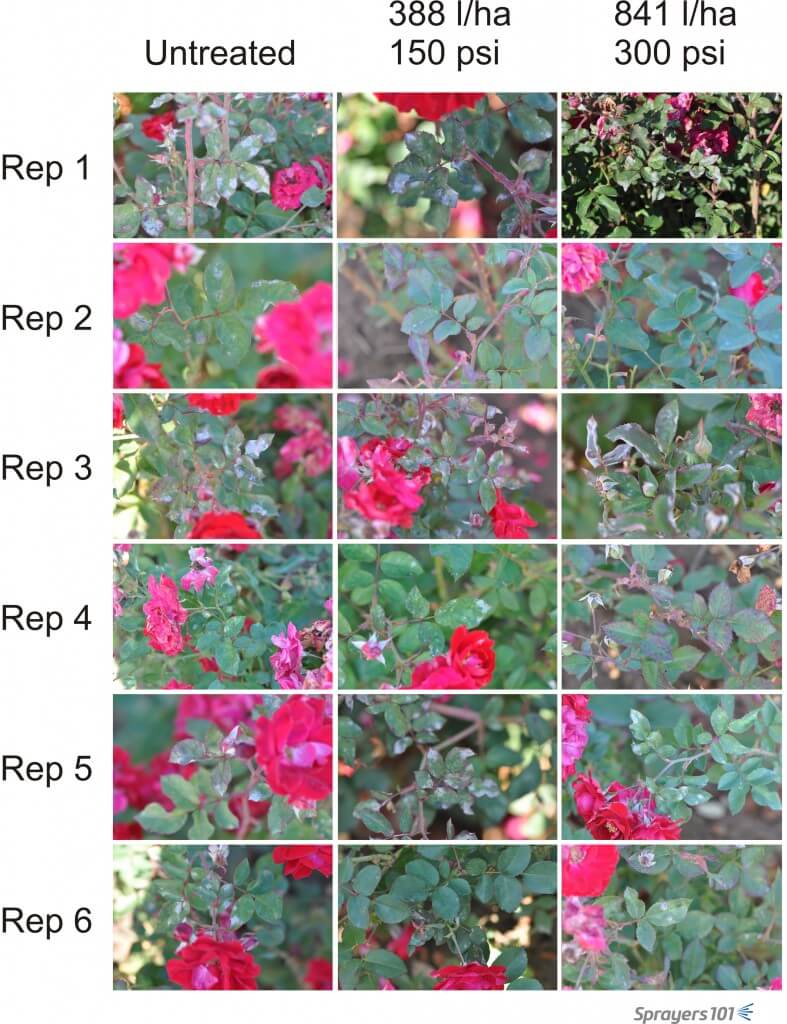
To demonstrate the value of sprayer optimization, we marked out three, 65m x 6.5m blocks in a field of roses. One block was an untreated control. One block was the grower’s traditional set up of hollow cones (D4D45) on 50 cm centres at 300 psi and 3.0 mph (841 L/ha). The third block was the experimental condition where we used an optimized set up of hollow cones (D3D45) on 50 cm centres at 150 psi and 3.0 mph (388 L/ha). We validated this condition using an iterative process to dial in the coverage indicated by water-sensitive paper.
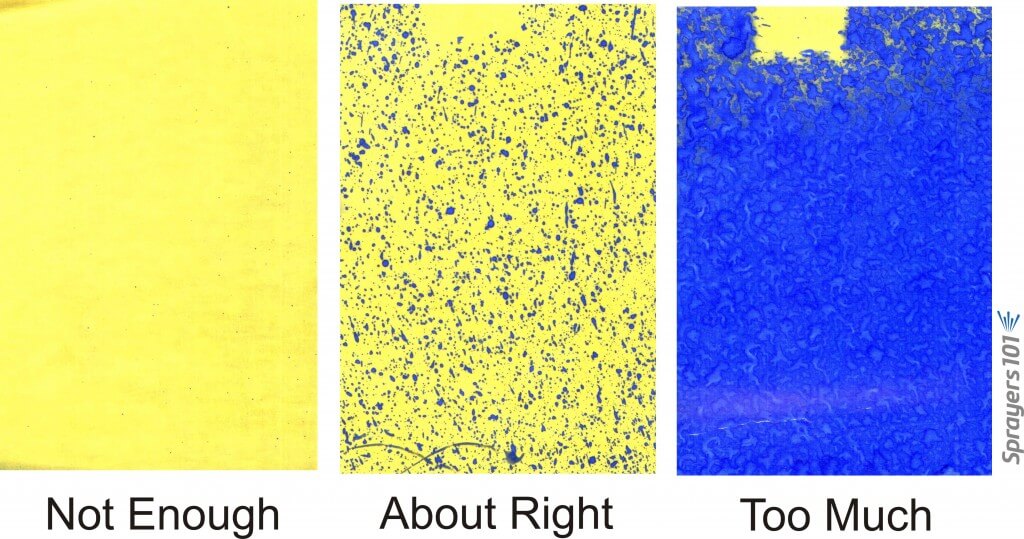
Setting up water-sensitive papers in the rose blocks.Rule-of-thumb fungicide coverage on water-sensitive paper.
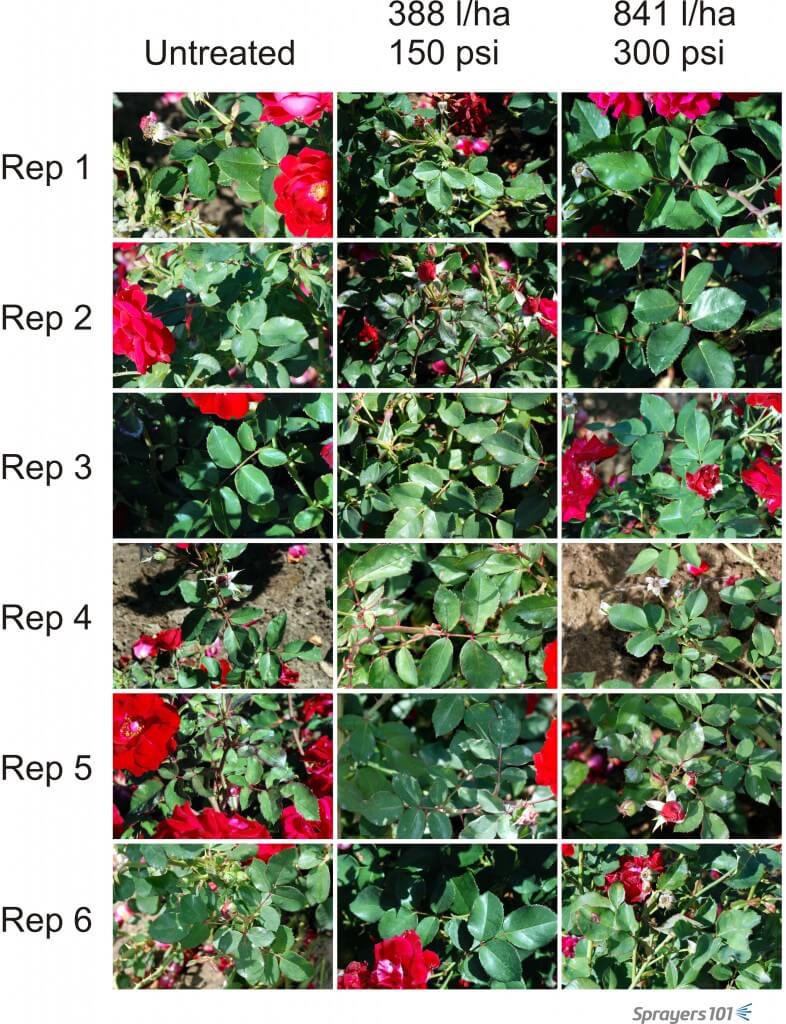
One application of Folpet + Nova was made on Sep 19, 2011. Roses were photographed before and after the treatment. The photographs were digitized and the amount of powdery mildew appearing on the upper surfaces was determined as a percent of the total visible leaf area. Six replications were randomly selected from each block.
Visual record of randomly selected roses prior to treatment (September 9).Visual record of randomly selected roses immediately following treatment (September 20).
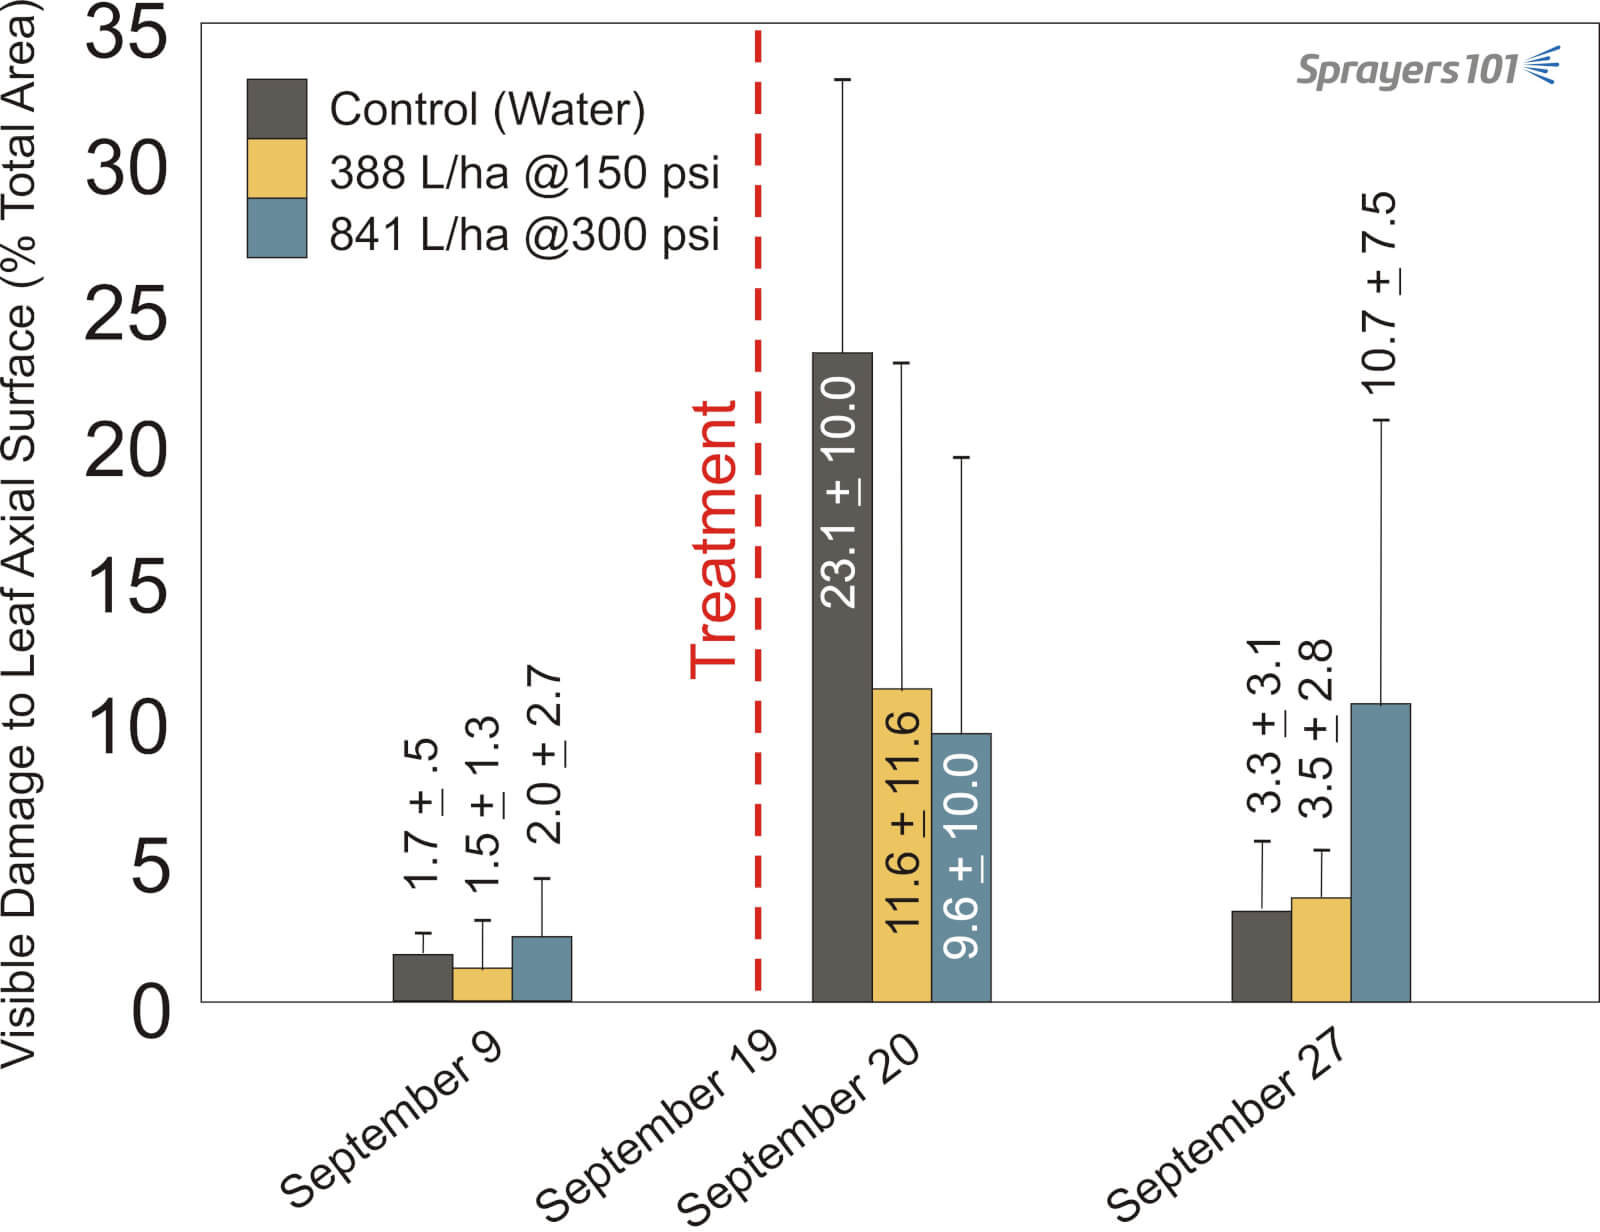
There was no significant difference in the amount of mildew presented in the two sprayed blocks one day after the application (September 20). Eight days after application (September 27), there appeared to be better control in the optimized sprayer set up condition versus the grower’s standard set up. The large standard error bars in the grower’s condition made this statistically insignificant. It is unclear why the untreated block presented with the least visual mildew at this point. This preliminary work demonstrates the value of customized application settings and their potential to conserve pesticide, water, and fuel without compromising pesticide efficacy.
Results of optimizing sprayer set up on the visual occurrence of powdery mildew on rose leaves. Bars represent standard error of the mean. Unclear why control block presented less mildew on Sept 27.
The Ontario Farm Innovation Program and the grower co-operator are gratefully acknowledged for making this research possible.
Establishing an airblast nozzling solution is an involved process. We must first define the working parameters and flush out any special circumstances. Then we use an iterative approach to identify suitable nozzle combinations that require minimal changes to the sprayer.
This article outlines my process step-by-step and then applies it to a hypothetical orchard scenario. If readers wish to delve deeper into the variables or the reasoning, several links to supporting articles are provided. Be aware that nozzling the sprayer is the penultimate step in establishing optimal sprayer settings. Operators should first adjust air settings, which includes identifying a suitable travel speed. The last step in setting up any sprayer is to verify you are achieving threshold spray coverage.
Step One: Establish sprayer parameters
Is there more than one sprayer available? In diverse plantings, it may be more efficient to assign a sprayer to blocks that require the same nozzling solution.
How many nozzle positions are there on one side of the sprayer? If the nozzle bodies are roll-over style the operator can alternate between two different nozzles in each position. Some designs have twice as many nozzle bodies as needed. The intent is to assign two unique nozzle solutions in an alternating A-B set-up. This additional capacity gives us some flexibility if needed.
Is this a tower or a low-profile axial sprayer? Generally, we distribute nozzle flow evenly over a tower boom but distribute ½ the flow in the top 1/3 of the boom on a low-profile axial sprayer (depending on canopy shape and density). Air-shear and one-sided sprayers are special cases that are not addressed in this article.
What is the average travel speed, and can the operator easily change it? This process assumes the selected speed achieves a reasonable work rate while optimizing the interaction between sprayer air and the canopy.
What is the average operating pressure, and can the operator easily change it? For sprayers with positive displacement pumps, pressure is easily changed via the regulator. Not so for sprayers with centrifugal pumps. Pressure-based rate controllersempower an operator to dial in their desired volume and are easiest of all .
Step Two: Establish target parameters
What is the row spacing (or spacings)? Some operations include a variety of canopy morphologies and planting architectures.
What is the target volume (or volumes)? Operators often use a range of volumes to reflect the product being applied and the canopy area-density. This process assumes the volume will provide threshold, uniform coverage without misses or excess.
Step Three: Are there any environmental, geographical or adjacency concerns?
Each operation is unique, including conditions that may influence nozzling. For example, open water, sensitive crops, or residential areas adjacent and downwind of the planting may warrant drift-reducing nozzles or require the operator to only spray inward from one side of the sprayer. In another example, dry and windy conditions may require nozzles that produce a coarser spray quality will improve their survivability. Rolling hills and uneven alleys may cause sway that prevents the upper-most nozzles from consistently reaching the target.
Step Four: Find out why the operator is re-nozzling
The answer may reveal the operator’s willingness and ability to make changes to sprayer settings. For example, if their objective is to improve the match between sprayer and canopy it implies a willingness to take a more active role in spraying. Conversely, a less experienced operator might be satisfied with a more robust (i.e., wasteful) set up that does not require many changes between blocks.
Step Five: Determine the highest and lowest boom flow requirements
The following formulae relate travel speed, row spacing, and the desired volume sprayed per planted area to the output from a single boom. I recommend downloading this Excel-based calculator to make the process easier.
US Imperial Formula Output from single boom (gpm) = [(Sprayer Output (gpa) × Travel Speed (mph)) ÷ 990] × Row Spacing (ft)
Metric Formula Output from single boom (L/min) = [(Sprayer Output (L/ha) × Travel Speed (km/h)) ÷ 1,220] × Row Spacing (m)
Using the formula with the appropriate units, enter the highest desired volume, the fastest travel speed and the longest row spacing. This will give the highest rate of flow the boom must satisfy.
Repeat this process using the lowest desired volume, the slowest travel speed and the shortest row spacing. This will give the lowest rate of flow the boom must satisfy.
The ultimate objective is to select a combination of nozzles that can produce these two flows, distributed sensibly along the boom, with no gaps or excessive flow relative to the target. Ideally, the operator should be able to alternate between these two flows with as few changes as possible.
Step Six: Satisfy the highest flow
This step requires a nozzle manufacturer’s catalogue and a calculator (or the downloaded Excel spreadsheet). We must assume the range of available nozzle positions are oriented to span the target canopy with no over- or under-spray.
Divide the highest flow requirement by the number of available nozzles. Hypothetically, a nozzle size that produces this flow would satisfy the highest flow requirement while providing an even distribution along the boom.
Using the nozzle manufacturer’s catalog, find the flow table for the nozzle you want. Generally, a molded hollow cone nozzle is the preferred choice (e.g., TeeJet’s TXR ConeJet or Albuz’s ATR). If drift is a concern, there are also air induction (AI) hollow cones available. AI nozzles are most effective in the top two or three nozzle positions where drift potential is highest. However, they may require higher flow than calculated to compensate for a reduced droplet count.
Find the operating pressure (it may be in either the column or row heading) and find a flow rate in the body of the table that is as close as possible to your calculated ideal. It’s almost never an exact match, so choose the option that is less than the target rate – not higher.
Imagine placing that nozzle in every available position. Add up all the rates to determine how close you are to the ideal flow. It will likely be less. To compensate, replace the top nozzle on the boom with a higher rate and re-calculate the total flow. Repeat this process, substituting for nozzles with a higher rate, moving top-down along the boom until the flows match.
You have now satisfied the demand for the highest flow.
It is important to note that this process assumes the flow distribution along the boom should be relatively even, perhaps skewed towards the top. However, it is sometimes appropriate to distribute the flow differently to reflect each nozzle’s distance-to-target and the density of the corresponding portion of canopy it needs to spray. This tends to be the case when pairing low-profile radial sprayers with large or trellised canopies, and you can read more about that process in this article.
Step Seven: Satisfy the lowest flow
This is the art-and-compromise part of the nozzling process.
Confirm that the range of available nozzle positions still corresponds to the target. Quite often, the lowest flow is intended for smaller canopies. If so, we may no longer have as many nozzle positions to work with.
Imagine the sprayer is still nozzled for the highest flow per the last step. Leaving the highest effective nozzle on, imagine turning off every second nozzle. Add up the flows and determine how close you are to the lowest rate of flow. It is often still too much. Do not turn off any more nozzles or you may create gaps in the swath.
Instead, return to the nozzle catalogue and re-calculate the flows for the same nozzles, but using a lower operating pressure. Can you make that work? If not, you may have to go back further in the calculation (Step five) and recalculate the lowest flow required using a faster travel speed. This will reduce the demand for flow.
If none of those options are viable you will have to consider re-nozzling. Perhaps that’s swapping a few nozzles to lower rates. Hopefully this only requires the operator to flip a roll-over position, but it may mean using a wrench to remove caps and swap nozzles.
Once you’ve satisfied the lowest flow, the hardest part of the process is complete.
Step Eight: Satisfy the other permutations
The last step is no different than what we’ve already done. Go back to Step Five and calculate the flow for each spraying situation. That is, each unique combination of row spacing, travel speed and target volume. Using the nozzles already on the sprayer, adjust the pattern of nozzles in use (and pressure and/or travel speed if required) until each unique flow requirement is satisfied.
Step Nine: Record the setups, nozzle the sprayer and test the coverage
Be sure to clearly record the sprayer settings required to achieve each flow. Purchase the nozzles and take the time to test each set up using water sensitive paper to ensure coverage is achieved.
A working example
Let’s apply this process in a hypothetical orchard. I’ve included a screenshot of the spreadsheet I use to record the final nozzling solution (below) but feel free to design your own. It includes the nozzling solution for this example.
Our orchard is a 50 acre operation with both 11 and 15 foot row spacings. They have one tower sprayer with 15 nozzle positions on one side and they are not roll-over bodies. The operator wants to apply a 40 gpa volume (concentrated) and a 100 gpa volume (dilute). Their preferred travel speed is 4.5 mph and preferred operating pressure is 140 psi, but they are willing to change them if required.
We use the Excel calculator to work out the ideal highest and lowest demands for flow:
I usually shut off the lowest nozzle position because it almost never aims at the target. Let’s divide the high flow of 6.8 gpm by 14 available positions to give us an average output of 0.48 gpm per nozzle. This operator wants to use TeeJet TXRs, so using their table (below) we see that at 140 psi the Orange ’02 is too low and the Red ‘028 is too large. If we drop the operating pressure to 120 psi, the Red ‘028 is much closer at 0.465 gpm, so let’s do that.
A quick check gives us our current boom flow: 14 positions × 0.465 gpm per nozzle is 6.51 gpm of boom flow. We wanted 6.8 gpm, so let’s go up to the Grey ’03 in the top three positions. Now it’s 4 × 0.517 gpm + 10 × 0.465 gpm = 6.72 gpm. That’s close to our ideal 6.8 gpm, so let’s lock that down. If you want to see what this is in gpa, you can plug the value into the Excel calculator to discover it’s 99.6 gpa. Pretty darn close to our target 100 gpa.
Now using that nozzling arrangement, let’s see if we can satisfy the lowest flow requirement by shutting off every second nozzle position, leaving the highest position on. Doing so reduces us to two Greys and five Reds, totaling 3.36 gpm. That boom flow is much too high compared to the 2.0 gpm we need. However, in our hypothetical orchard, this block has shorter trees so we don’t need the highest nozzle. That drops us to only one Grey and a new total of 2.84 gpm. Good try, but it’s still too much.
Let’s reduce the operating pressure from 120 psi to 100 psi, which is as low as I like to go. According to TeeJet’s table, the Grey produces 0.473 gpm and the Red produces 0.426 gpm at this pressure. This gives us a new total of 2.60 gpm. Still too high! Well, let’s raise our travel speed from 4.5 mph to 5.0 mph and recalculate the lowest flow for Situation D:
This still won’t do it, and driving that fast (even if it’s possible) would change our air settings too drastically. Having exhausted all the easy options we have no choice but to re-nozzle the sprayer for the original lowest flow requirement.
Returning to the TeeJet table we see the best fit is to spray at 100 psi using one Red TXR80028 and five Orange TXR8002s. It’s a lucky break that our 1.98 gpm has come so close to the 2.0 gpm of flow we wanted.
Now let’s work out the best arrangement for the other permutations, Situation B and C. We need 5.0 gpm and 2.7 gpm, respectively. For Situation B, let’s use the nozzling solution from Situation A. We see that shutting off four nozzles gets us very close at 4.81 gpm or 97.3 gpa where we wanted 100 gpa. As for Situation C, let’s work from the nozzling for situation D. By adding a few more nozzles from that set, we can manage 2.71 gpm or 40.2 gpa.
Finally, we record all the settings (refer back to the spreadsheet image). We will need four Grey TXR8003s, ten Red TXR80028s and six Orange TX8002s per side, so 40 nozzles in total (plus a few spares for each rate). We will need to spray at 120 psi for Situation A and be prepared to shut off a few nozzles for Situation B. Situation C will require 100 psi and an entirely different nozzling and we will have to shut a few of them off for Situation D. Not only have we determined a nozzling solution, but we have revealed an efficient order for spraying the blocks that will require as little manual change to the sprayer as possible.
Summary
There is no one right answer to the question “which nozzles do I need” but there are certainly wrong answers. Bear this in mind when you buy a sprayer and the dealer offers you a factory-standard nozzle setup. Apply this process to your operation and be sure to use water sensitive paper to confirm the coverage and to make informed changes where required.
In this installment, Dr. Tom Wolf, intrepid reporter, braves the unforgiving wilds of Saskatoon as he investigates claims of mysterious devices popping up all over the city. Colloquially referred to as “nozzles” these items are imprinted with obscure codes that scientists are struggling to decipher. Be the first to learn how to read a nozzle and nozzle table in our newest installment.
When we consult a nozzle catalogue we are interested in the flow and droplet sizes produced at a given pressure. Perhaps we should also consider the effect of pressure on spray angle. We have several articles discussing the collective impact of spray overlap, nozzle spacing and boom height on coverage uniformity (Check here and here for example). However, we don’t really address the fact that fan angle is not a constant. This may be more relevant with the growing adoption of spot sprayers.
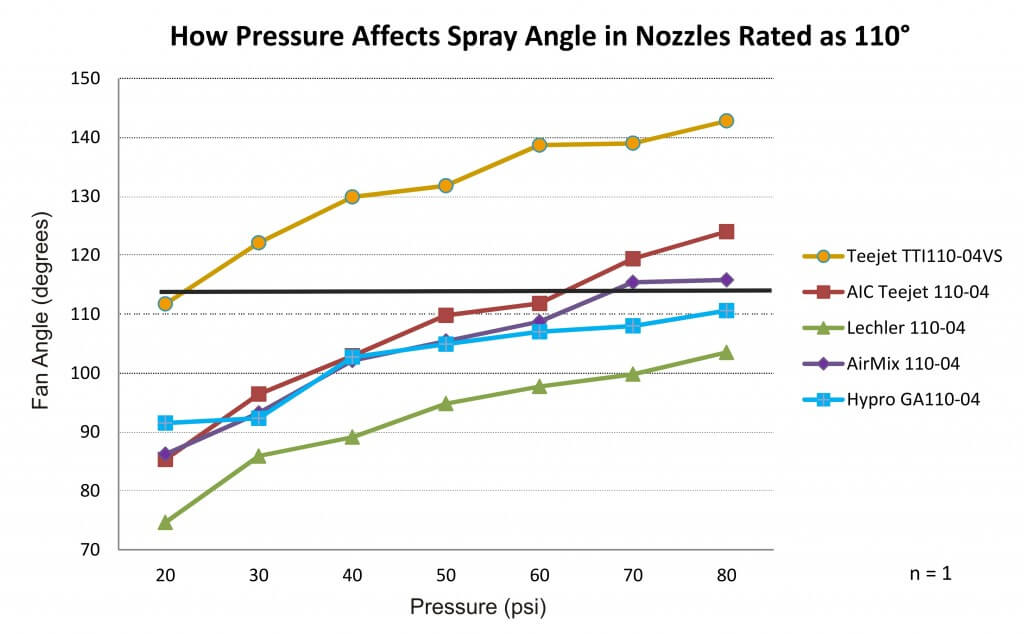
To illustrate the potential for fan angle variation, we assembled a collection of red, flat fan nozzles (‘04s) from several manufacturers. We plugged each nozzle into a spray pattern table, set the regulator at a given pressure, and photographed the spray angle and flow distribution. This process was repeated for each nozzle at seven different pressures within the manufacturer’s approved range of 20-80 psi. After digitizing the photos, we measured the spray angle using a digital protractor.
We anticipated a concomitant increase in spray angle as the pressure increased. This is not news. Anyone who has operated a sprayer has seen the spray pattern open up as the boom fills and pressurizes. Bear in mind this was only performed once (i.e. n=1), so while it illustrates trends it shouldn’t be mistaken for a rigorous scientific comparison. Further, this demonstrates a static situation and not a dynamic one where travel speed, wind conditions and the vortices from the sprayer it self will influence matters.
We saw similar trends with nozzles other than 110˚ fans, but let’s focus on 110˚s due to their current popularity.
Fan angles for five common 110 degree AI flat fans over their manufacturer-recommended pressure range
The spray angle for 110˚ nozzles ranged from 75˚ at 20 psi to approximately 143˚ at 80 psi. One nozzle failed to reach 110˚ at any pressure. Conversely, there was another that was over 110˚ at nearly all pressures. Ideally, spray nozzles should be operated around the middle of their manufacturer-recommended operating range. Three of the nozzles tested came close to 110˚ at that median pressure, but only the TeeJet AIC110-04 measured 110˚ at the middle of its recommended range (~50 psi).
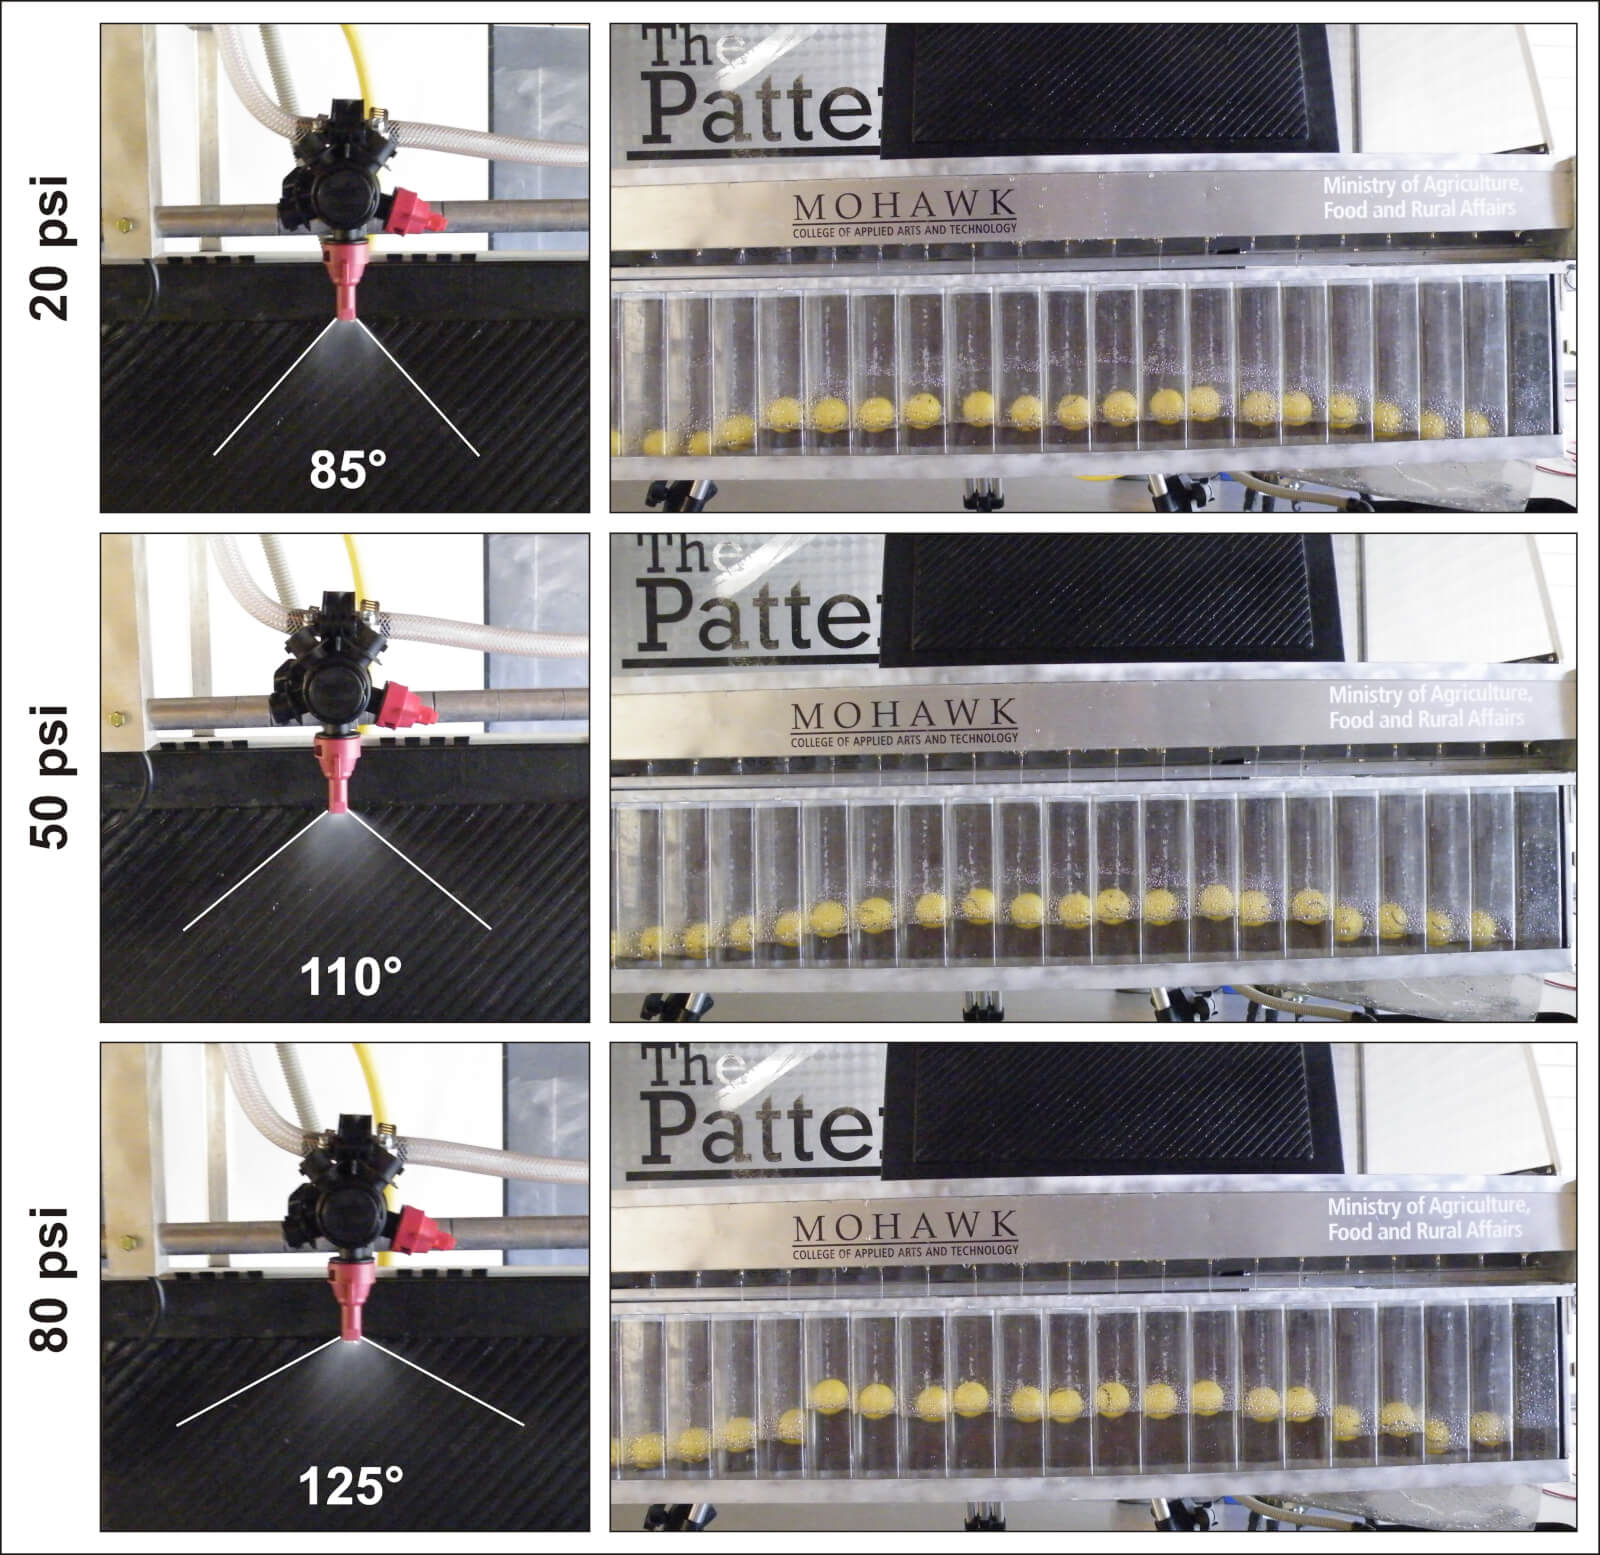
Using that nozzle as an example, let’s look at the pressure, spray angle and subsequent distribution of flow along the swath at three different pressures. At 20 psi, the spray angle was 85˚. The yellow balls are floats that reflect flow as a series of cross sections of the swath. We see that aside from the tapered edges (which illustrate the need for 100% overlap between neighbouring nozzles) the distribution was fairly even. One of the priorities in nozzle design is to ensure a low coefficient of variability over the operating pressure range. In other words, the length of the swath may change, but the spray quality and uniformity in that swath is still within spec. At 50 psi the nozzle produced the expected 110˚ fan, and the spray distribution remained even. At 80 psi, the angle spread out to 125˚, spanning a greater distance, but it started to produce a less-even distribution.
Photographs of spray angle and distribution for the TeeJet AIC110-04 at the extreme low, middle and highest pressures of its recommended pressure range.
When fan angle changes with pressure, it can have significant implications. Nozzle spacing on a boom varies from sprayer to sprayer. Generally 50 cm (20 inch) centres are the standard in North America, but we’ve seen 15″ and even 10″. Nozzle spacing and boom height collectively determine the degree of spray overlap. Excessive overlap isn’t a problem, although additional nozzles do mean added expense, cleaning time and potential for plugging. Conversely, gaps in the pattern could lead to sub-lethal applications or flat-out misses. For example, in this soybean demo plot (below) we sprayed a contact herbicide at low pressure to collapse the spray pattern. You can see the alternating stripes of hits and misses that resulted from an incomplete overlap of spray.
Soybean demo plot sprayed with a contact herbicide using 110˚ air induction flat fans at 20 psi. The collapsed spray pattern did not overlap sufficiently to burn the entire crop down, leaving a striped pattern and demonstrating the poor coverage.
Nozzle manufacturers generally recommend a 100% spray overlap for flat fans. This creates sufficient overlap when the boom sways low to the ground. It also increases the degree of droplet size homogeneity under the boom as coarser and fewer droplets are generally found at the “horns” or edges of the pattern compared to the centre. In order to ensure this degree of overlap, sprayer operators should observe and consider changes in fan angle over their typical pressure range. Otherwise, the cost of poor deposit uniformity under the boom could be high.
Operate nozzles around the middle of the manufacturer-recommended pressure range. However, just because a nozzle is rated over a range of pressures does not mean the angle is constant.
Lower pressures are a greater concern than higher pressures. 30 psi is the absolute lowest pressure for operating a 110˚ air induction flat fan; the ideal operating range for these nozzles is 50-70 psi.
If nozzles are not maintaining the recommended 100% overlap at your preferred pressure range, then consider switching nozzle rates, and adjusting pressure and boom height.
This work was performed with Victoria Radaukas, 2015 OMAFRA application technology summer student.