This short article is a thought exercise designed to give some perspective on chemical rates, carrier volumes and the foliar area we expect them to protect.
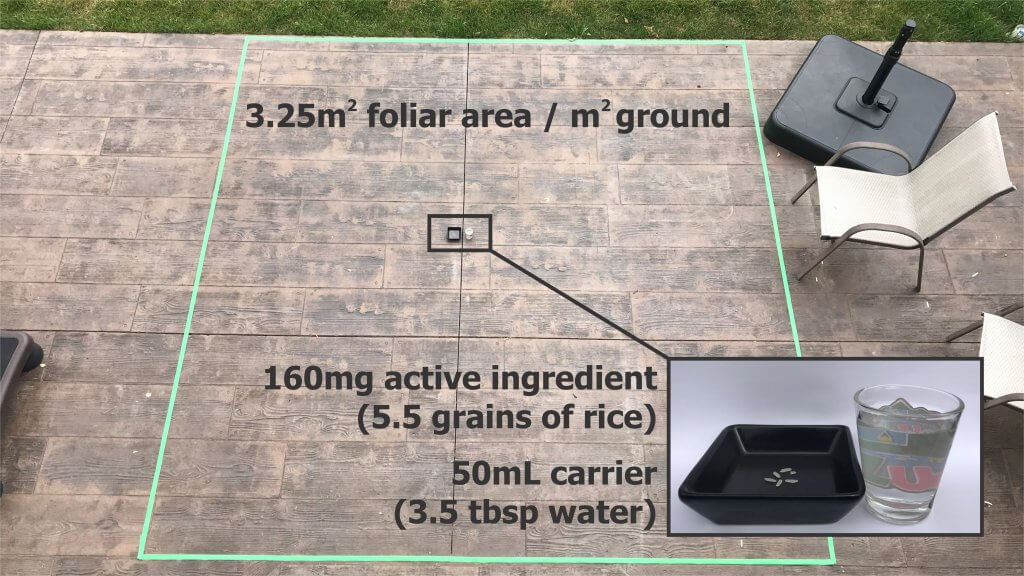
Imagine we are spraying the fungicide Captan on highbush blueberry. In Canada, the label rate is to apply 2kg/ha (28.5oz/ac) of planted area. Captan is 80% active ingredient, so a quick unit conversion tells us our objective is to apply 160mg of active ingredient per m2 of planted area. Let us suppose we will use 500L of carrier per hectare (53.5 gal/ac), which converts to 50mL/m2.
Now let’s say the blueberry patch is mature and well pruned. Each plant has a footprint of 1.2m by 1.2m (4ft by 4ft) and is 1.5m (5ft) high. The Leaf Area Index (LAI) is the one-sided green leaf area per unit ground surface area (LAI = leaf area / ground area) in broadleaf canopies. Assuming a conservative LAI of 2, that’s 2.88m2 (65ft2) of leaf surface area per plant. We double that figure since we want to spray both sides of the leaves, and then assuming the bushes are planted on 3m (10ft) alleys we arrive at a total foliar surface area per planted area of 3.25m2/m2 (3.25ft2/ft2).
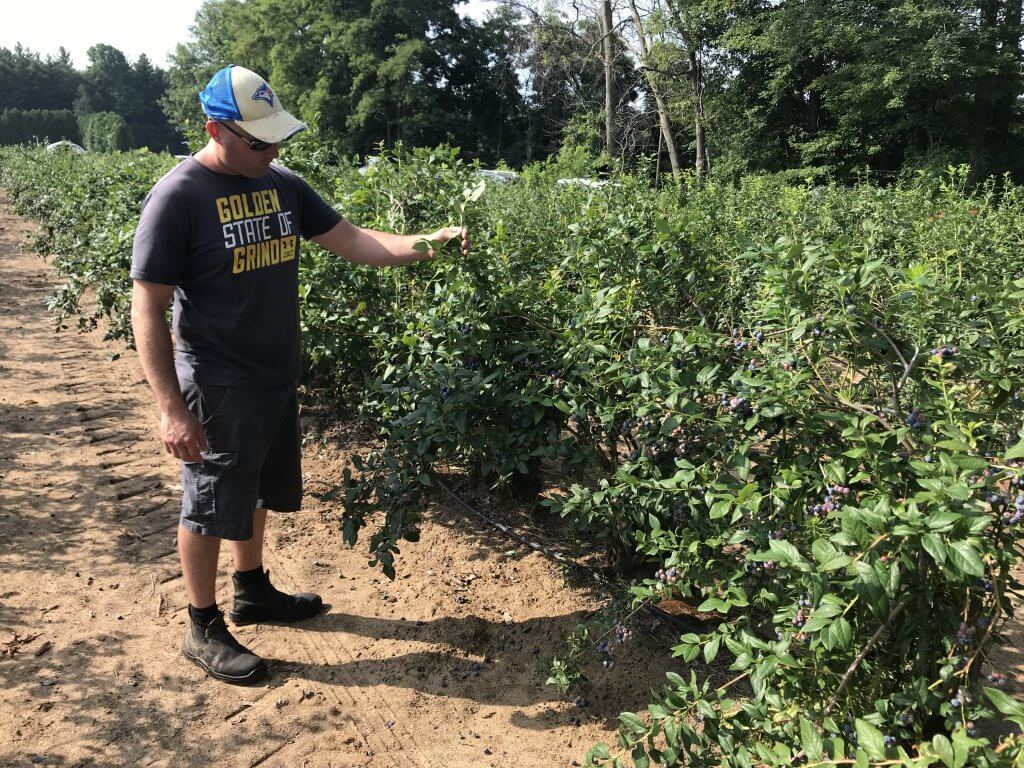
A grower with his mature, well-pruned blueberries. 4′ x 4′ on 10′ alleys.
Let’s take these figures and convert them to something we can picture. An average grain of rice weighs 29mg and there are 15mL in a single tablespoon. What this means is that a sprayer operator’s goal is to dissolve active ingredient with a weight equivalent to 5.5 grains of rice in 3.5 tbsp of water and distribute it evenly over 3.25m2 (35ft2) of surface area!
Now that’s perspective.
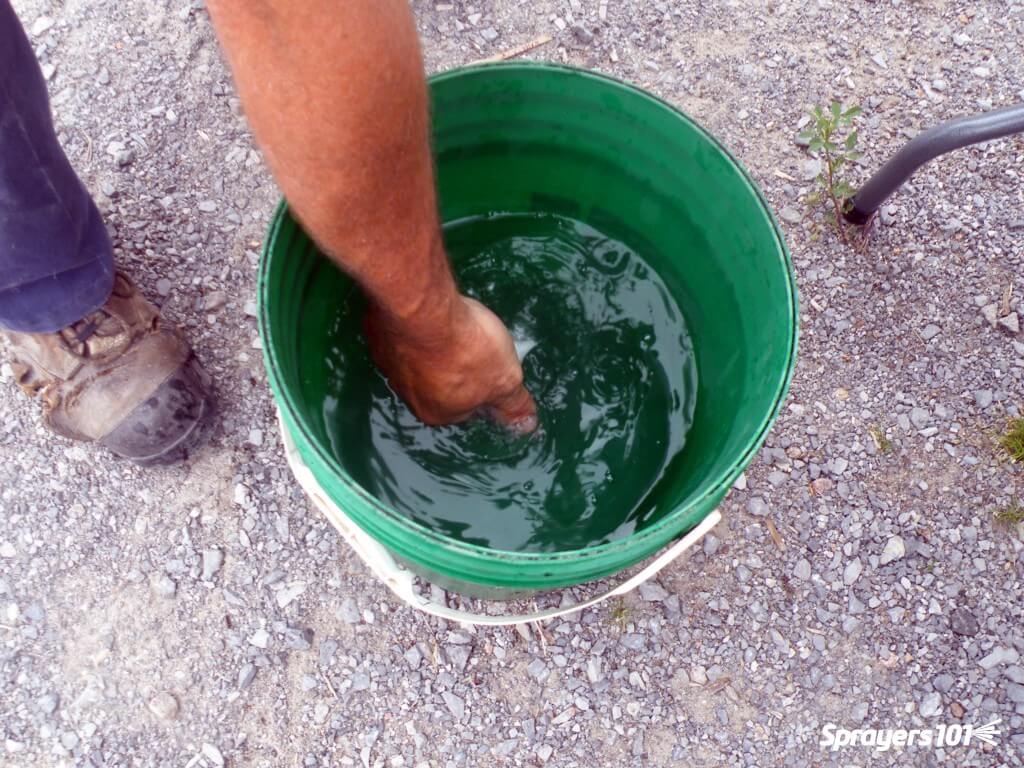
This photo shows how much foliar surface area exists in a square meter of mature highbush blueberry. In the centre is the typical amount of active ingredient and water that must be distributed over that area. It’s amazing what we ask of an air-assist sprayer.
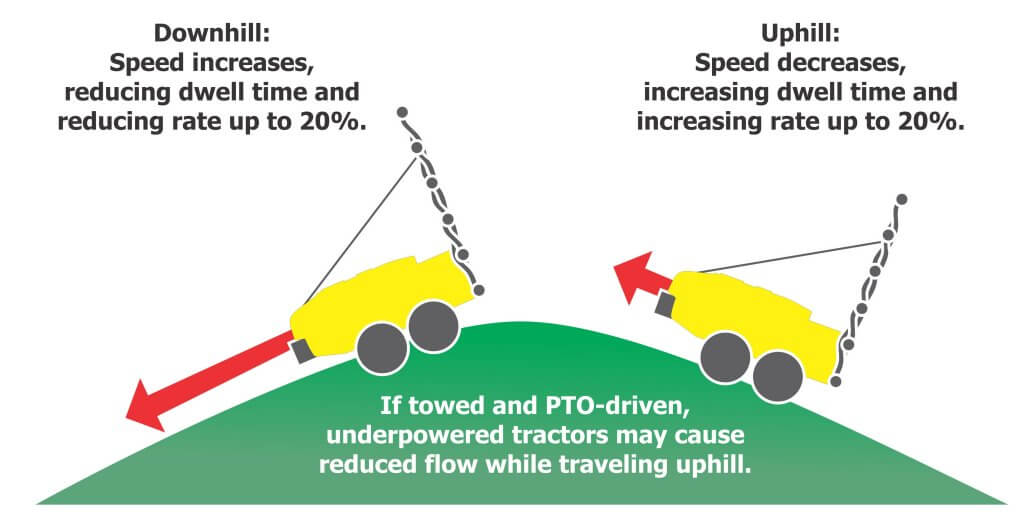
There are many advantages to using rate controllers, but their primary role is to maintain a constant application rate. All sprayers change speed on hills, at row-ends, or in response to surface conditions. Since flow from an uncontrolled sprayer is constant, the application rate varies significantly (up to 40% in hilly conditions). Rate controllers compensate for changing speed by adjusting flow.
Hilly operations create highly variable application rates. Changes in travel speed can translate to 40% variability in rate applied. Rate controllers adjust flow to compensate.
Pesticide is not saved directly (since increased uphill rates already cancel out reduced downhill rates), but consider the pesticide label. Labels that list a range of rates are contingent on pest pressure and crop size, but also compensate for poor coverage from low-performing equipment. When coverage uniformity is improved, experience has shown that operators can safely spray at minimal rates.
Experience has also demonstrated that when coverage uniformity is improved, pack-out benefits follow. Even a modest improvement represents a quick return on investment. Equally important, a more consistent application reduces the risk of higher residue levels on the uphill and improves crop protection on the downhill.
Now, if you are wondering if a rate controller is right for your operation, or if you should just stop reading now, consult this handy decision support matrix:
This decision support matrix will help you decide if a rate controller is right for your operation. Spoiler alert: It probably is.
Rate controller categories
The following table categorizes controllers based on how they control flow. The categories are successively more expensive and complicated, but there’s commensurate value. For example, while not specified here, high-end rate controllers offer value-added features such as as-applied mapping (a powerful management tool).
Description
Pros
Cons
Good: Monitors and adjusts pressure. Uses math to assume flow.
System monitors pressure, but does not register flow. For example, if nozzle flow is restricted, back pressure increases. The controller will compensate to correct pressure, implicitly reducing flow, but the operator is not alerted to the actual problem.
Better: Monitors and adjusts flow, not pressure.
Alerts operator to changes in flow. Operator usually sets the percent error threshold a little high to ignore transient changes.
System will not register pressure deviations. At threshold speed, pressure may drop too low. This can cause inconsistent check valve operation and spray pattern collapse. With tall booms, the top nozzles may close completely.
Best: Monitors flow and pressure and adjusts flow.
-Best likelihood of a consistent application. -Alarms or automatic compensation of flow and pressure (user sets hard stops). -Provides a low tank level warning. -Stores preset calibrations to quickly switch between blocks.
-Highest cost. -Steepest learning curve. -More “wire-wiggling”. -Operators often choose to over-apply at low speeds as a tradeoff for uniform output and consistent atomizer performance.
Rate controller adoption and components
As we write this, less than 10% of air-assist sprayers have rate controllers. In the dark old days of the 1980’s, air-assist operators were ill-advised to install high flow, low pressure field sprayer controllers. That history of mismatched components and subsequent bad experiences continues to hinder widespread adoption.
Today’s components, however, are specific to air-assist sprayers and have made installations easier and more successful. Do your homework and speak with the manufacturer (not necessarily the local dealer) to ensure the controller, and all its components, meet your needs. Let’s describe the components so you’re prepared to have the conversation:
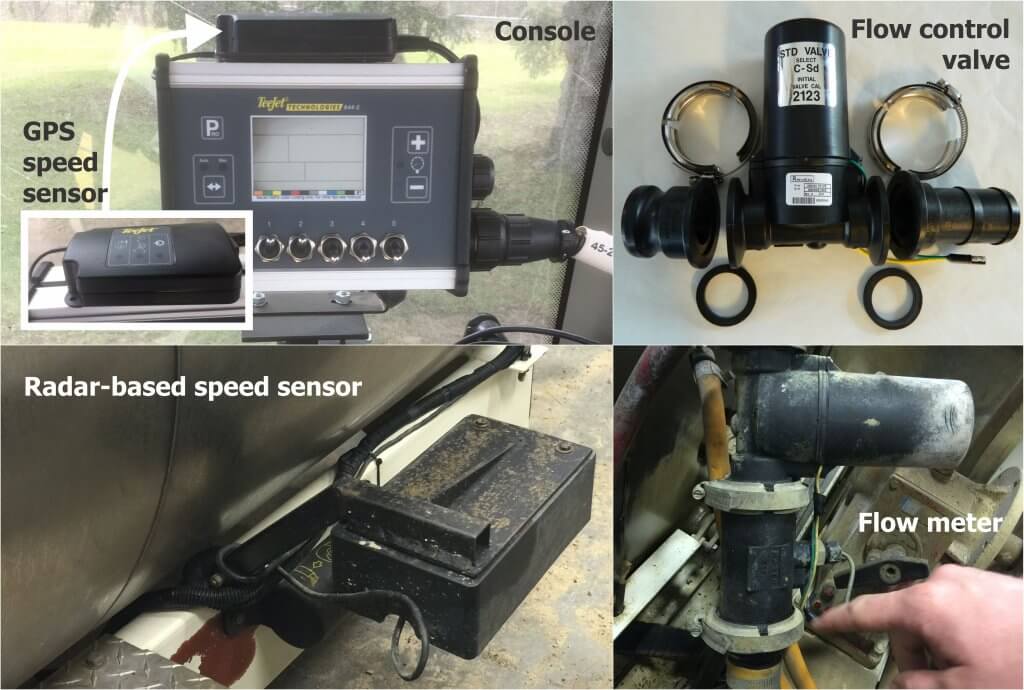
Console
Flow meter(s)
Flow control valve (including electric boom shut-offs)
Speed sensor
Wire harness
Examples of rate controller components.
Console
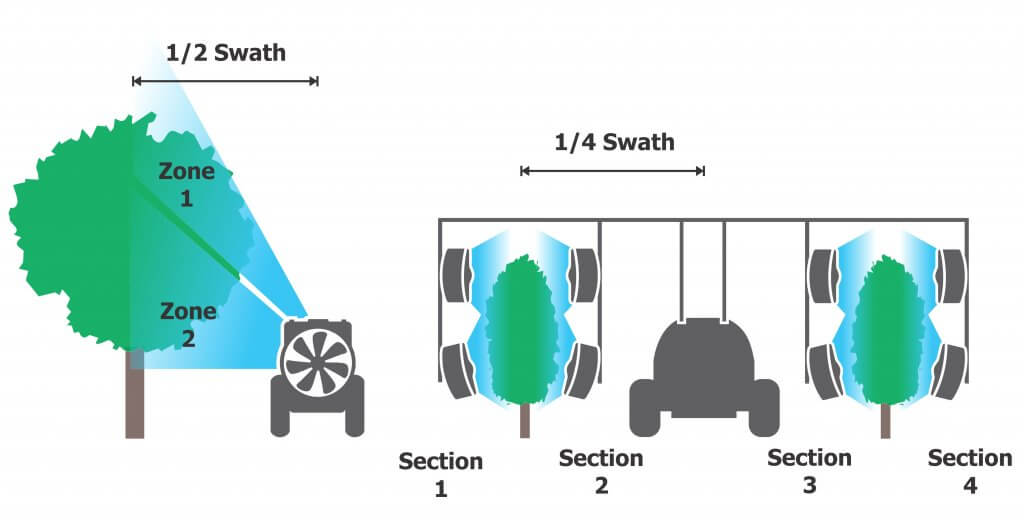
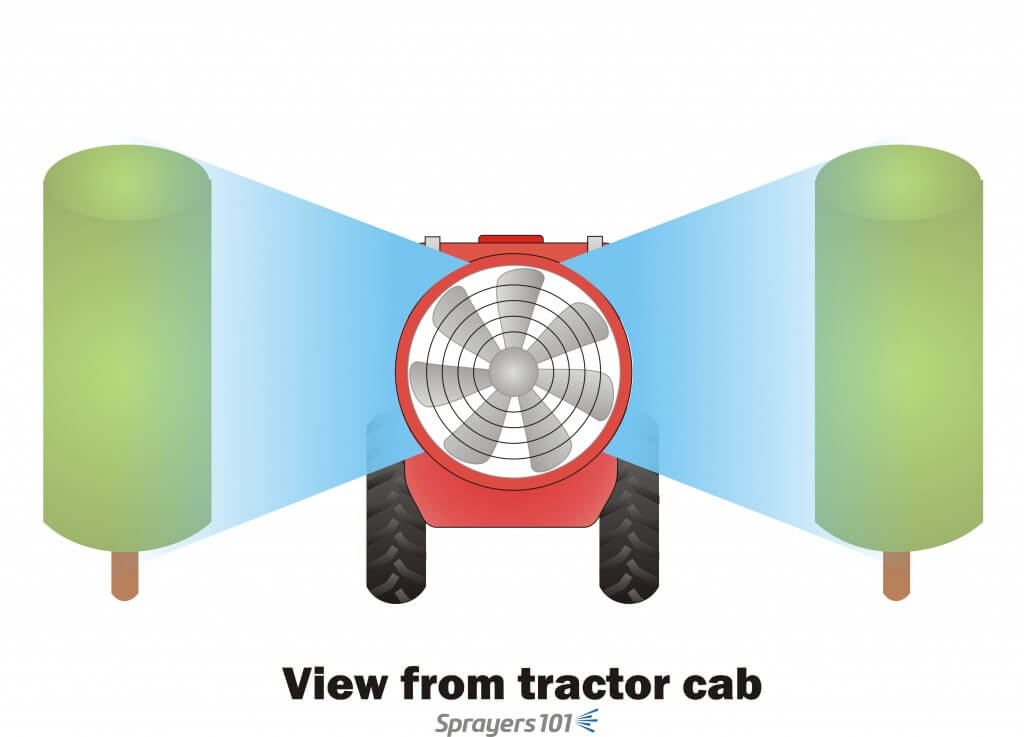
The console is the interface. The user enters criteria about the sprayer, the planting, and calibration data and receives information about sprayer performance. Select a console designed for air-assist sprayers and not field sprayers. Controllers intended for horizontal booms perceive swath in two dimensions, but air-assist controllers account for multiple vertical booms or boom sections in the swath (see the following figure).
Field sprayer rate controllers used in vertical crops must be “tricked” when programming swath. Leading air-assist rate controllers can assign flow to zones on a single vertical section (left) and adjust swath (sometimes called width) for multiple booms (right).
Flow meter
With rate controllers, flow is detected by one or more flow meters positioned pre-manifold. The relief valve becomes more of a safety device, defining the high pressure limit and bypassing flow if required. Most rate controllers use a flowmeter with no ability to monitor pressure. While still effective, adding a pressure sensor ensures nozzles are operating in the desired pressure range.
Turbine or paddle meters are inexpensive and acceptably accurate. They require periodic cleaning because some chemistry can accumulate and interfere with their moving parts. Filtration helps to minimize this issue. Magnetic or ultrasonic meters have no moving parts, higher resolution, wider metering ranges and aren’t affected by the viscosity of the spraying solution or entrained foam. However, they are considerably more expensive than mechanical meters.
Flow control valve
Unlike boom control valves that are open or closed, flow control valves are capable of a range of adjustments. Valve actuation is controlled by 12 volt servomotors. The level of precision depends on the style of valve.
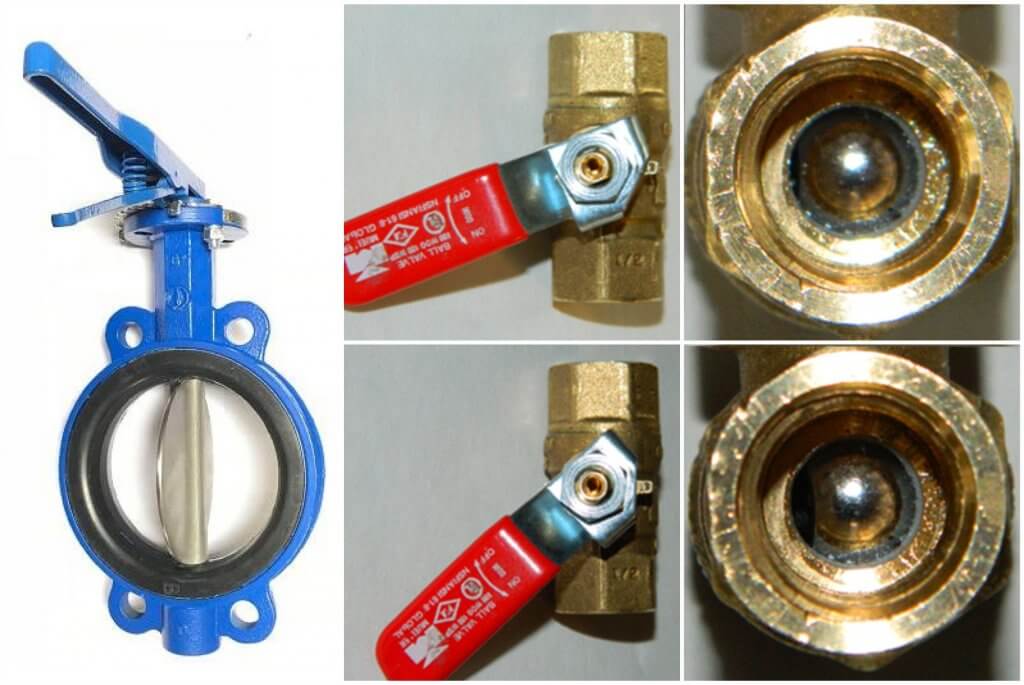
Butterfly valves: Simple, inexpensive, and typically for pressures <10bar (150psi). Some have minor leak-by when closed. Control is less precise as the valve opens because the orifice gets geometrically larger. This gives a narrow metering range.
Calibrated ball valves: Versions available for all pressures. May be simple flow through balls with similar metering limits to a butterfly. A better ball design is also available that offers a linear flow rate through the entire adjustment range, offering more stable rate control over the entire flow range. Several manufacturers offer these. All ball valves offer zero flow when closed.
Left- A butterfly valve. Right- A ball valve. Notice how a small change in the opening angle translates into a large change in the orifice size; this is difficult to control manually. Servomotors not pictured.
Compared to field sprayers, air-assist sprayers travel slower and use lower flow rates. It is a mistake to employ valves intended for high-flow, high-speed sprayers.
Speed: Valves are rated by connection size (½”, ¾”, etc.) and opening time (e.g. 1-14 seconds are common). Many rate controllers can be programmed to optimize adjustments for the speed and size of the valve.
Precision: As control valves open over their 90° range, the ability to control flow is less precise. Slower valves give less precision, but greater stability.
Size: Valve size should accommodate maximum flow and no more. If the valve is too large, it can only meter flow over the first few degrees of opening. For example, let’s say a valve capable of 200 L/min (50 gpm) and rated 1 second is used. Your sprayer meters 0-20 L/min (0-5 gpm). This means the whole metering range happens in the first tenth of a second. Even lightning-fast consoles will give unstable readings (aka hunting) as the computer overshoots the target in an effort to comply.
Control valves are “service parts”. Seals, moving parts and abrasive liquids mean they will require regular care and eventual replacement. It’s a wise precaution to make them accessible and easily removable. We suggest installing them with quick-connects (see top-right of the previous collage of rate controller components above) to make field-maintenance fast and easy.
Speed sensor
Speed can be based on GPS, engine tachometer readings, radar, or wheel rotations. Newer rate controllers may even take the speed directly from the tractor’s data feed. Price, reliability and crop conditions are all factors you should consider in the choice.
GPS: Easiest to deploy, very accurate (especially RTK-GPS) and reasonably priced. However, overhead canopy can block satellite signals. Some controllers compensate for the GPS losses with sophisticated internal kinematic devices that measure the inertia of the sprayer and calculate speed when the GPS is not reliable.
Wheel rotation speed sensors: An entry-level sensor, it’s typically a reed switch or Hall effect sensor that detects either the lug nuts or magnets installed on the rotating wheel. More magnets improve accuracy. Its exposure makes it prone to physical damage, and readings change with tire radius (which changes as the tank empties, on soft ground and with temperature). This is why wheel sensors are calibrated in the alley, with the tank half full and both tires at the same pressure.
Radar speed sensors: Employing the Doppler effect to measure speed, radar is the most accurate sensor. They are unaffected by terrain, slope or tank volume. They can be mounted anywhere in sight of the ground. They are, however, the most expensive and are typically not repairable if they fail.
Tachometer speed sensors: Largely obsolete, they measure the tractor’s tachometer speed and convert it to travel speed. Difficult to install and prone to the same inaccuracy as wheel sensors.
Interface sensors: Relatively new, some rate controllers interface with tractor electronics to receive speed data. ISOBUS, the standard interface language that agricultural electronics are increasingly adopting, makes this data exchange more common.
Wire harness
It may seem we’re drilling deep to mention wires, but standards are changing. Many controllers employ traditional analog wiring, but they are being made obsolete by the newer ISOBUS option.
Traditional Analog: Simple wires with automotive or custom plugs designed to match components. Relatively inexpensive and sometimes field repairable, analog wiring carries signal voltage (and power) to and from the controller to drive valves and receive analog sensor data. Communication is one-way: Sensor to controller, controller to valves.
Modern ISOBUS: Bus systems are more like a computer network, where digital signals travel back and forth between the controller and each component. Components that require power are wired directly to a battery. This results in a greatly simplified harness. The controller’s single ISOBUS wire “daisy chains” all components to relay commands and receive status, which makes system monitoring and diagnosis easier and more effective.
Conclusion
Rate controllers are a worthy consideration for your existing or future air-assist sprayer. Assess your needs and work with a knowledgeable dealer or manufacturer that can assemble and install a system appropriate for your operation.
Airblast operators should know how to read a nozzle table. They are found on dealer and manufacturer websites as well as in their catalogs. Table layout varies with brand, but they all relate a nozzle’s flow rate to operating pressure. The better tables also provide the spray angle and the median droplet size (i.e. spray quality).
Operators need this information to complete calibration calculations (aka sprayer math) and when deciding how to distribute nozzle rates, angles and spray quality along a boom relative to the target canopy.
This article focusses on hollow and full cone nozzles, which are commonly found on airblast sprayers. For more information on flat fan nozzle tables (e.g. for banded under-canopy or, vertical booms or broadcast applications from horizontal booms), refer to this article.
Reading the table
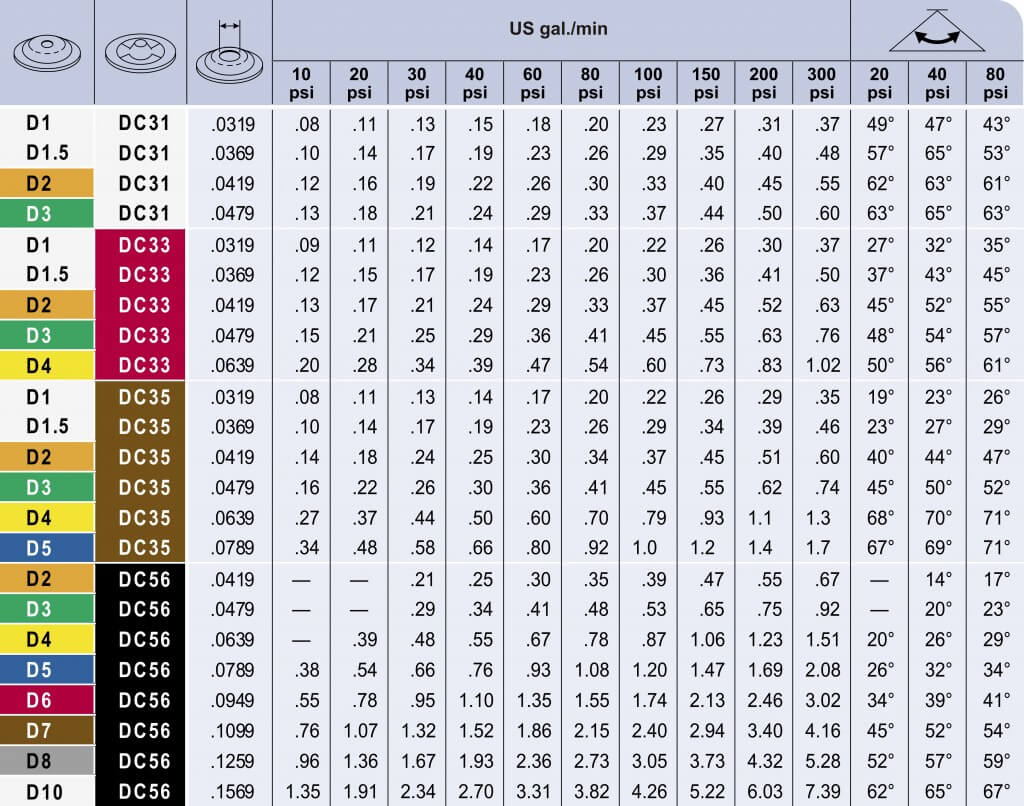
Let’s use the table below to determine a nozzle’s flow rate for a given pressure. First, find the nozzle colour in the top row. Second, find the operating pressure in the left-most column. Finally, the flow rate is indicated in the cell at the intersection between the row and column. For example, a red ATR hollow cone nozzle operated at 9 bar will emit a flow rate of 1.83 L/min.
Perhaps you want to determine which nozzle will give a specific flow rate. Find the rate in the body of the table and trace the column and row to determine which nozzle/pressure combination will achieve it. For example, if we want a flow rate of ~1.00 L/min, we can use a Yellow at 10 bar or an Orange at 5 bar. Yellow is the better choice since the Orange would have to be operated at the bottom of its pressure range (more on that later).
This Albuz nozzle table for 60 and 80 degree molded hollow cones gives flow rates in litres per minute.
Note: Do not to confuse TeeJet’s ISO-standardized TXA or TXB nozzles with TXVK or ConeJet nozzles. They may be the same colour, but their outputs are very different.
Higher flow rates or full cone patterns can be achieved using combination disc and core (or disc and whirl) nozzles. Depending on the manufacturer, the disc plate is defined by it’s diameter in 64th’s of an inch. The core or whirl plate might be described by the number of holes (e.g. 2-hole, 3-hole, etc.), or some other manufacturer-specific nomenclature (e.g. 45’s, 25’s etc.).
Using the table below, we see that a D2 disc and a DC35 core will emit 0.34 gpm at 80 psi. By continuing along the row, we see that the spray angle for this combination will be 47 degrees at that pressure.
This TeeJet nozzle table gives the flow rate for a disc (D#) and core (DC#) full cone combination nozzles in US gallons per minute.
Pressure problems
Do not choose a nozzle at the extreme of their flow or pressure range. A trailed PTO sprayer will experience pressure changes from driving on hills, or rate controllers will create pressure changes in response to changes in travel speed. In either situation, coverage will be compromised if the nozzle is pushed outside its optimal range.
Note: Use pressure to achieve small changes in flow, but for more extreme changes, switch nozzles. Remember, it takes 4x the pressure to get 2x the flow. Stated differently, it takes 1/4 the pressure to get 1/2 the flow.
You may not find a nozzle/pressure combination that emits the rate you are looking for. When your desired rate or pressure falls between the figures listed in the table, you can take the average. When nozzling an entire boom with different nozzle rates, get each position as close as you can to achieve the overall boom rate for a given pressure. It’s always a compromise – don’t stress over it.
Looking up nozzle rates during a spring calibration. The operator was running at 190 psi, but the catalogue only listed 180 psi and 200 psi. When the increment is only 20 psi, it’s reasonable to approximate the output. When the span is 50 psi increments, it is more difficult to determine the rate without testing the output (it’s not a linear relationship). This issue usually occurs at pressures above 200 psi, and that’s far too high for cane, bush, vine and high-density orchards. In these situations, consider using a lower operating pressure.
Different nozzles, same rate
Different disc core combinations, or molded nozzles at different pressures, can produce similar flow rates. However, their spray quality and spray cone angles can be very different (see last three columns in the TeeJet table above).
The angle of the spray cone can have a big impact on spray coverage. When the target is far away from the corresponding nozzle (e.g. the tops of nut trees), or the canopy is very, very dense (e.g. citrus canopies), consider tight-angled full cones under high pressure. This is inefficient and can give variable coverage, but it is sometimes the only option in extreme situations.
Oops! Two hollow cone nozzles on top and five full cone nozzles below is the exact opposite of how things should be. Note the lack of spray overlap with the full cones for the first few meters. Spray from the top two positions will likely not reach the intended target.
When the target is very close to the sprayer, full cones do not overlap and create undesirable striping or banded coverage. Creating a full, overlapping spray swath that spans the entire canopy is a function of nozzle spacing, distance-to-target, and sprayer air-settings. It can also be affected by humidity, wind speed and wind direction at the time of spraying.
Confirm your settings by parking the sprayer in the alley between crops. With the air on, spray clean water while a partner stands a safe distance behind the sprayer to look for gaps in the swath. The partner will see things the operator’s shoulder check will not reveal.
Here’s what the operator sees. But, shoulder checks may not show you what’s really happening. Have someone stand a safe distance behind the sprayer while spraying clean water to see the nozzle spray overlaps sufficiently to span the entire canopy.Here’s what the partner standing behind the sprayer sees. Take a picture with a smartphone to show the operator.
Nozzle tables can be wrong
Sometimes nozzles do not perform per the nozzle table. We have discovered errors in published tables, worldwide. Here are the big three:
Conversion errors. Manufacturers publish catalogs in Metric and in US Imperial, but we have found many errors in the conversions.
Spray angle errors. When nozzles are operated at the extremes of their pressure ranges, spray angles deviate from those listed in the tables.
Flow rate errors. When tables are not updated to reflect changes in nozzle design, or the manufacturing process, actual flow rates deviate from those listed in the tables.
Perhaps it’s not the table, but the nozzle itself. Most nozzle manufacturers accept a flow variability up to +/- 2.5% for new nozzles, but we have seen higher. It depends how they are made (machined, stamped, printed) and the material they are made of.
Validate flow rate and pattern
When errors are discovered and reported, the manufacturers can be slow to issue corrections and the errors will persist in old tables. Yes, even apps (which are often based on tables) can be wrong. So, predicted flow rates can prove unreliable. This is why it is important to double check by observing nozzle overlap and validating flow rate when you replace nozzles – even when they are brand new.
Thanks to Dr. David Manktelow (Applied Research and Technologies, Ltd., NZ) for input into this article.
This is the first of a series of short, educational and irreverent videos made with Real Agriculture to bring a little levity to sprayer education. Let’s face it – ironically, nozzles can be pretty dry.
This first video discusses what a rate controller can be expected to do, and what it cannot do. Plus, we got to blow up a sprayer in the intro… so there’s that.
Biopesticides are a rapidly growing segment in horticultural pest control. While they are often billed as green “miracle cures”, applicators should be aware that they require unique considerations. Issues with lifespan, target specificity, and application technology can all impact their efficacy. However, like any pesticide application, careful planning can minimize wasted time and money.
Typically defined as pesticides derived from “natural” sources, biopesticides contain active ingredients extracted from plants, microorganisms, animals, and/or certain minerals. Given their origin, and the fact that many biopesticides are living organisms (as is the case with most of the microbial-based pesticides), they are often photo-sensitive and quickly break down. This generally means that they need to be re-applied often.
Mixing and handling
Pre-suspending nematodes before inoculating the spray tank.
Consideration should also be given to the lifespan of these products during the application. Many have an optimum pH for both the carrier water and the soil, and a limited temperature range outside of which they may not be active. As already mentioned, direct sunlight can quickly degrade many biopesticides, which means they should be applied either early or late in the day. Timeliness is also a factor: efficacy can be greatly reduced if the product is not used quickly – many biopesticide organisms begin to break down as soon as they are tank mixed. Also, be aware that it can be difficult (or impossible) to find suitable tank-mix partners. For example, a fungal biopesticide obviously shouldn’t be mixed with a fungicide. That also leads the applicator to consider their spray program carefully and clean their sprayers thoroughly between applications.
Efficacy
Applicators should understand how each biopesticide is supposed to control (or more likely, supress) pests. Many biopesticides have to be ingested or physically contact the pest. As such, they often need high application volumes to ensure sufficient coverage of all target surfaces. Many are slow to control the pest, so the applicator may mistakenly think the product is not working, and reapply unnecessarily.
Application equipment
Cleaning a strainer – image courtesy of M. Lanthier.
Applicators may need to reconsider their current equipment when using biopesticides. If the product has to contact the pest, high droplet density is preferred. This can be accomplished with high volumes, but also with higher droplet counts, and that means smaller droplets. Drift issues aside, many biopesticides are actually living organisms (e.g. nematodes) which might be negatively affected by the small nozzle orifice.
The “Spray Guy”, Dr. Jason Deveau, (Application Technology Specialist with the Ontario Ministry of Agriculture, Food and Rural Affairs) suggests using a nozzle with a larger exit orifice and no pre-orifice to minimize clogging or any potential damage to the microorganisms. Clogging can be further reduced by using a minimum of three levels of filtration on a sprayer. With proper agitation, a tank basket, suction filter at the pump and slotted strainers behind each tip should catch any “chunks”. In-line filters at the boom are also potentially helpful. Each filter, from tank to nozzle, should be filter smaller particles than the last. Cleaning screens diligently and inspecting the effectiveness of the agitation system, should be part of every spray day.
Applicators can account for many of these issues by understanding what the biopesticide is and how it is intended to work. Consider these questions:
When is the pest active/vulnerable?
Under what conditions does the product need to be used to be most effective?
Are there special handling or mixing considerations?
What do I need to have in place to minimize the time between mixing and applying the product?
Ultimately, an effective application of biopesticides relies on integrated pest management (IPM). Biopesticides can work as advertised when used thoughtfully and appropriately. Understanding the products benefits and limitations will ensure applicators reap the full benefits of these new and evolving methods of control.