Category: Spray Basics

  • Measuring Pressure Drop

    Measuring Pressure Drop

    All sprayers experience a drop in pressure as the solution moves further away from the pump.  Here’s why that’s important, and how to measure it.

    Optimal nozzle operation in terms of spray quality and fan angle is closely tied to spray pressure.  As we try to maximize travel speed range with a modern sprayer, we often push spray pressure to its limits on the low and high side. For many air-induced nozzles, spray quality and fan angle become critical at about 30 psi.  We need to be sure about the exact nozzle spray pressure to prevent problems.

    Pressure drop is caused by the friction that the spray solution experiences as it moves from the pump to the spray nozzles.  It’s caused by a number of factors, including length of tubing, elbows, valves, screens, and other flow obstructions.

    Plumbing components add friction to liquid flow. If the pressure gauge is installed before these components, the nozzle pressure is unknown but will be lower than the gauge reading.

    The pressure transducer that reports pressure to the cab is usually located between the pump and the manifold that divides the spray into the various boom sections.  At this point, the spray liquid hasn’t experienced any significant flow restrictions.  The transducer basically reports pump pressure.

    Once the spray mixture starts moving through boom sections towards the nozzles, it encounters those restrictions, and pressure at the nozzle will therefore be lower than the cab reading indicates.  The higher the liquid flow, the greater the friction, and therefore, pressure loss.

    Even older sprayers with only two boom sections (left and right) and few elbows and reducers, will see pressure losses due to the narrow and long boom pipe that feeds up to 60′ on each side.

    The nozzle pressure can be measured with a gauge placed on a nozzle body.  Simply purchase a quality gauge and a threaded nozzle cap, combine the two and install in place of a nozzle.

    A pressure gauge threaded into a nozzle cap can measure boom pressure.

    Operate the sprayer at your expected spray pressure (say, 60 psi) with all boom sections on.  Install the portable pressure gauge on an open turret position and turn into place, noting its reading.  If both gauges are accurate, the boom pressure will likely be below 60 psi.

    The difference between the cab gauge pressure and the boom gauge pressure two is the pressure drop.  Repeat the measurement for each boom section.  Also repeat at your lowest, as well as your highest expected flow rates.  Higher flow rates cause greater pressure drops.

    Now, use this information to adjust your interpretation of the cab pressure reading.  For example, if you want to spray at 60 psi and your pressure drop is 10 psi, then the cab pressure should read 70 psi.

    If your boom pressure is higher than your cab pressure, and you’ve checked the accuracy of your new boom gauge, then don’t be too mystified.  Your pressure transducer is malfunctioning.

    This exercise is important if you’re trying to compare your nozzle flow to the expected nominal flow of the nozzle – perhaps you’re trying to determine nozzle wear.  The nominal flow of agricultural nozzles is determined at 40 psi, so it will be important to measure the flow at exactly that pressure.

    By measuring pressure drop on all your boom sections, you also get a good sense of the variability in pressure across your boom.  Your measurements might reveal an obstruction or a hose kink somewhere along the line.

    To see how low pressures can affect coverage, watch this video.

    Note that the pulse-width modulated systems offered by Capstan, Case, and Raven use a solenoid at each valve.  This solenoid adds a known, and significant, pressure drop to the spray system as can be seen here.

    Pulse-Width-Modulation (PWM) solenoids typically have internal flow restrictions that can contribute to pressure drop.

    Here’s a fun video filmed by the Ontario Pest Education Program during a break at Ontario’s Southwest Crop Diagnostic Days:

  • Debunking Sprayer Myths

    Debunking Sprayer Myths

    Reproduced from an article written by Angela Lovell for Grainews, 2014

    “The fundamental challenge of spraying is that it’s a compromise game,” said Tom Wolf of Agrimetrix Research and Training. “As operators and advisors we need to always balance the opposite needs of coverage, efficacy and drift.”

    Wolf, in a presentation at the recent Manitoba Agronomists Conference in Winnipeg, sees a trend towards more fungicide use on farms across western Canada and technology that purports to make application more efficient. These trends include wider booms, faster speed capability, complex monitors, auto boom heights and bigger tanks.

    As much as technology is a great thing, it’s still the operator that is the single most important part of any spray operation, so it’s important to make sure that he or she isn’t going out to the field with any conventional beliefs that simply aren’t correct.

    The challenge with spraying is to control pests without harming you neighbour’s crops or the environment and over the years Tom Wolf has developed some pretty good ideas about how to do that and has had to dispel more than one popular myth about spraying.

    Myth # 1: More pressure forces the spray into the canopy.

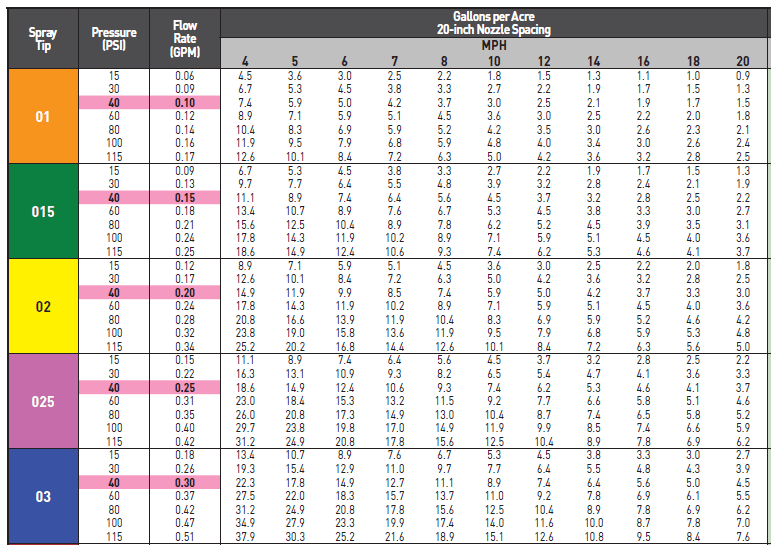
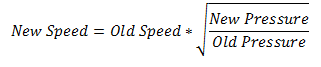
    “There’s an element of truth to this but it’s forcing spray downward is the least thing that pressure does,” says Wolf. Spray pressure is primarily used to change spray flow rate. If you increase the pressure you will need to travel faster to allow the carrier volume to stay constant, and faster travel speed actually works against canopy penetration. Another important change is that spray quality will become finer with higher pressure. Finally, droplet velocity will initially increase, but even at higher pressure, small droplets still move slowly by the time they reach the canopy. “If you want to force a fine spray into the canopy, the best way to do that is to lower your boom, slow down, and increase the carrier volume,” says Wolf.

    Myth # 2: Higher water volumes lead to run off.

    There are two things that govern run off; droplet size and surface morphology of the leaf surface. “Anyone who says that anything more than 3 gallons/acre runs off the leaf surface is not telling you the whole picture,” says Wolf. “We’ve been unable to induce runoff from up to 200 US gpa in our tests, even using hard-to-wet grasses like green foxtail. Don’t be afraid of water. It’s a very good way of covering the canopies. Water gives you flexibility to use coarser sprays and that allows you to spray when it’s windier.”

    Myth # 3: Spray drift is no issue for fungicides and insecticides

    Aquatic organisms are extremely sensitive to most fungicides and insecticides. We might not see this effect, but it has a definite impact on our environment. It’s important to observe the buffer zones shown on product labels, which can vary depending on the product, the application method and the specific environment.

    Myth # 4: Faster travel speeds save time and boost productivity

    Wolf suggests evaluating this on a field by field basis. At faster speeds you lose control of the spray cloud and the finest droplets will go wherever the wind goes. Other problems with higher speeds are canopy penetration, pattern uniformity and pressure management. If you have an 800 gallon tank with an 80 ft boom and you are going 12 mph at 10 gallons/ac and your fill rate is 50 gallons per minute you are going to do about 84 acres/hour not including turns. If you go faster – 18 mph – you can do 110 acres/hour. But if you increase your fill speed, thereby decreasing the time spent filling you can increase productivity just as much. If you also increase your boom width you also increase productivity. “All I am asking is you don’t just look at travel speed to improve your productivity,” says Wolf.

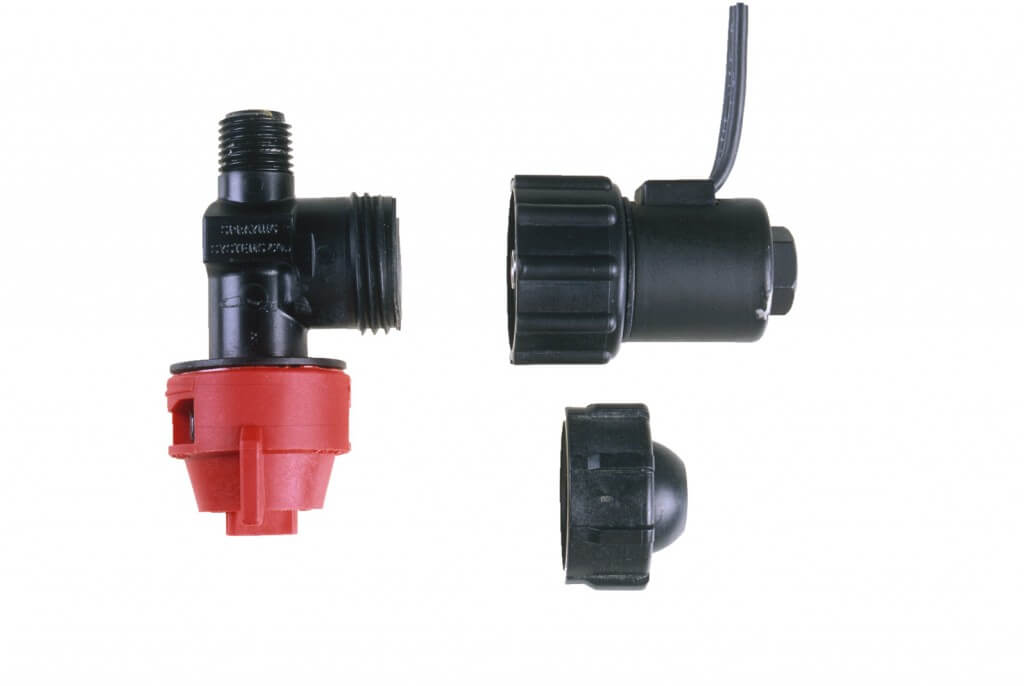
    Myth # 5: Double nozzles produce more droplets and improve coverage

    “It’s the droplet size and water volume that drives the droplet numbers produced. It doesn’t matter how many nozzles produce this size,” says Wolf. Although some double nozzles produce finer droplets and therefore improve coverage, others actually produce coarse sprays which may decrease coverage. Pay attention to droplet size first – nozzle manufacturers publish spray qualities from their products. You can increase coverage from a single nozzle simply by increasing the spray pressure so yo produce a finer spray.

    Myth # 6: Calm early mornings have the lowest drift risk

    This is one of the biggest myths out there, says Wolf, and it’s all because of a condition called an inversion, which usually occur during clear nights, and which linger into the early morning hours. Under normal sunny daytime conditions, air currents rise, fall and disperse spray clouds rapidly but under inversion conditions they don’t. This can lead to severe drift issues, even significant distances away from the treated field.

    Under sunny daytime conditions, air temperature cools with height and that allows for thermal turbulence to disperse the spray cloud. On clear nights, the temperature increases with height (the opposite temperature profile, therefore called an “inversion”), and this prevents air from mixing. As a result, the spray cloud will not disperse.

    Assume that the atmosphere is inverted on clear summer nights, extending into a few hours after sunrise. Producers should never spray when an inversion is present, and a good indication might be if fog or smoke hangs in the air and not dispersing.

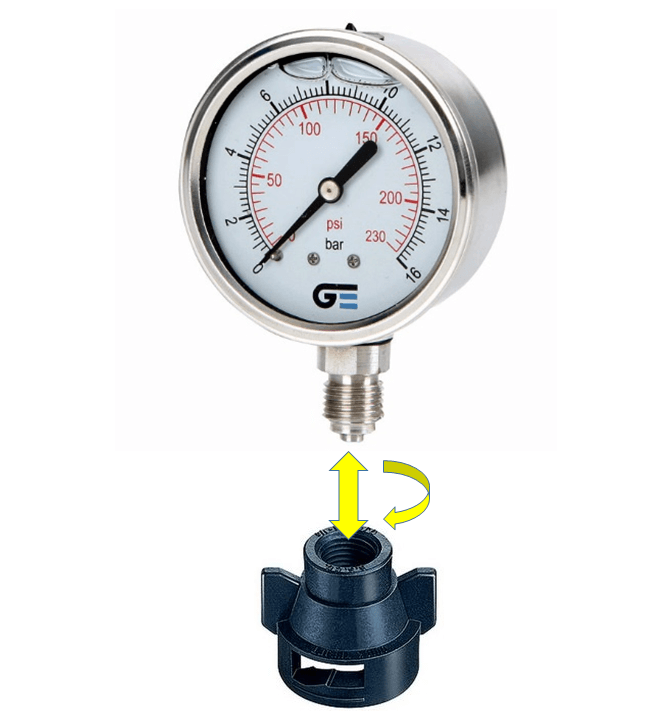
    Myth # 7: A rate controller calibrates the sprayer

    “Even with a $400,000 sprayer, the rate controller still relies on a single flow meter that sits at the back of the sprayer and measures the total flow to the boom. The operator has no idea where that total flow is going,” says Wolf. As a result, there is still no substitute for individual nozzle calibration. There are various new tools on the market to assist with that but they still need to be done individually.

    Myth # 8: If I mess up agronomic decisions, I can correct that with a good spray application

    A spray application has to be on time to be truly effective, says Wolf. In efficacy studies where yeield was measured, spraying herbicides “on time” (=early) produced a yield advantage over spraying just one week later, even with a spray quality that was so coarse that it resulted in relatively poor weed control. “If it’s breezy, use a low drift nozzle. This allows you the opportunity to spray on time,” he adds.

    Myth # 9: Ammonia is a good general purpose tank cleaner

    Ammonia raises pH and some chemicals like sulfonylurea products dissolve better at a higher pH. But if you have an oily emulsifiable concentrate (EC) formulation, either as a product or adjuvant, a soapy cleanout product will be needed. “Liberty exposes poor tank cleanout because the adjuvant in Liberty is such an excellent cleaner,” says Wolf. After use of an oily product, the use of a wetting agent such as AgSurf will assist in removing oily residue and many soap-based commercial cleaners are available.

    Myth # 10: There is an optimal nozzle that does it all

    “Right now a sprayer costs approximately 100,000 times more than the nozzle and the nozzle is still the part that makes you happy or sad,” says Wolf. “If we inverted the investment trend and said ‘let’s build a better atomizer’ there would be an optimal nozzle right now. But although we’ve made progress with low-drift nozzles recently, the industry still looks for inexpensive, simple ways to atmozie sprays.”

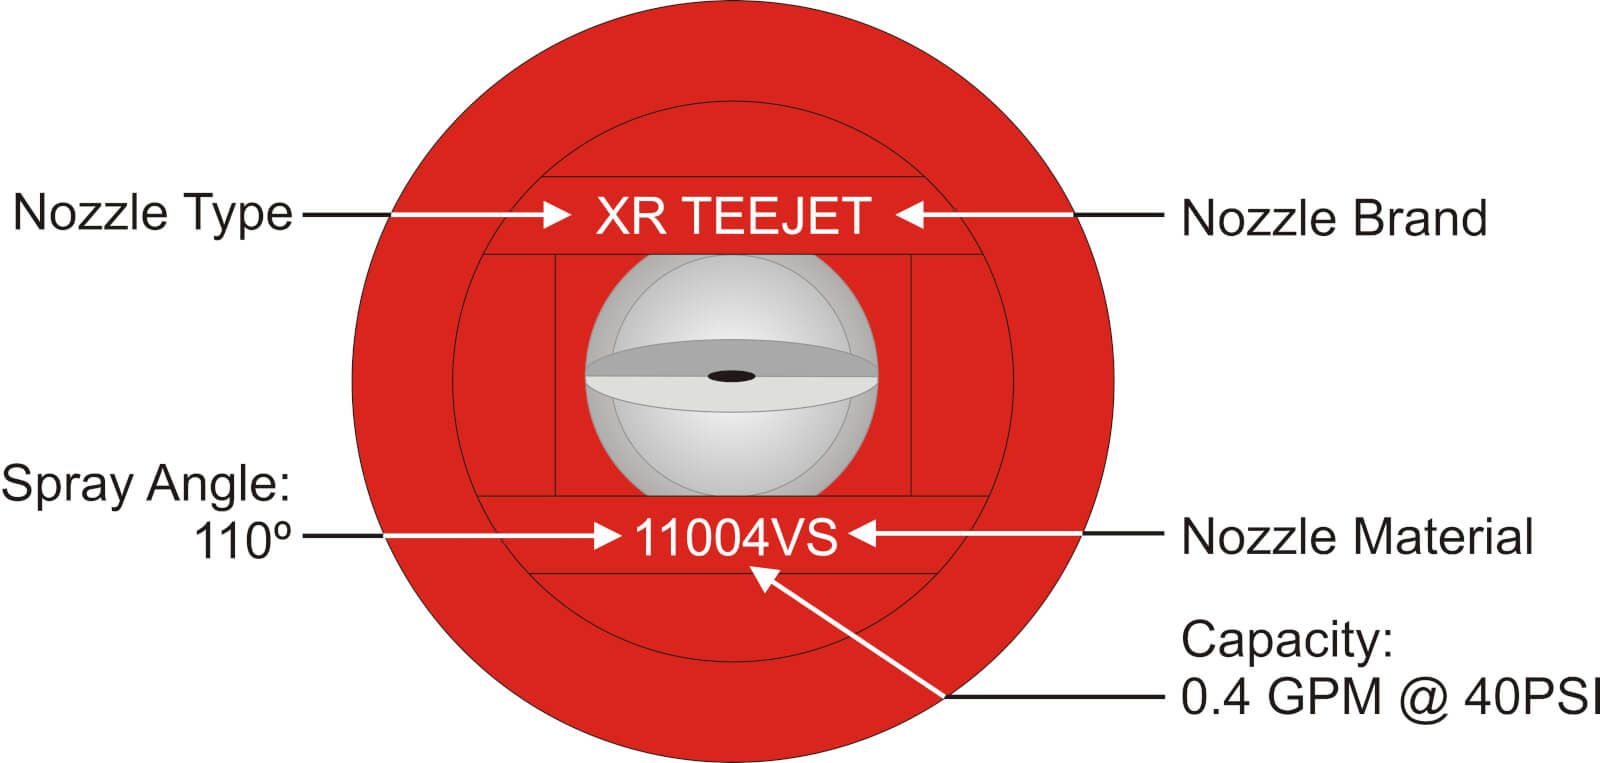
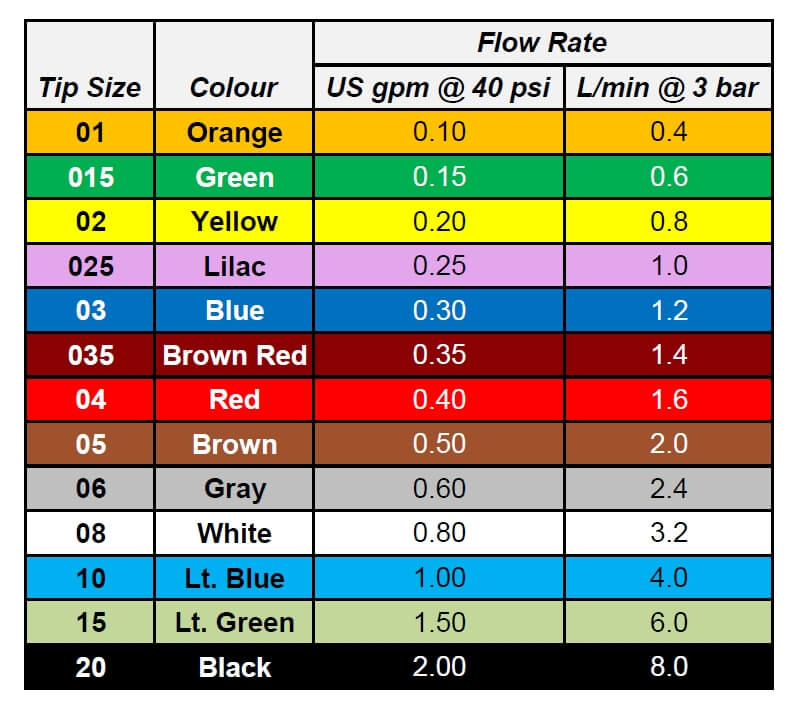
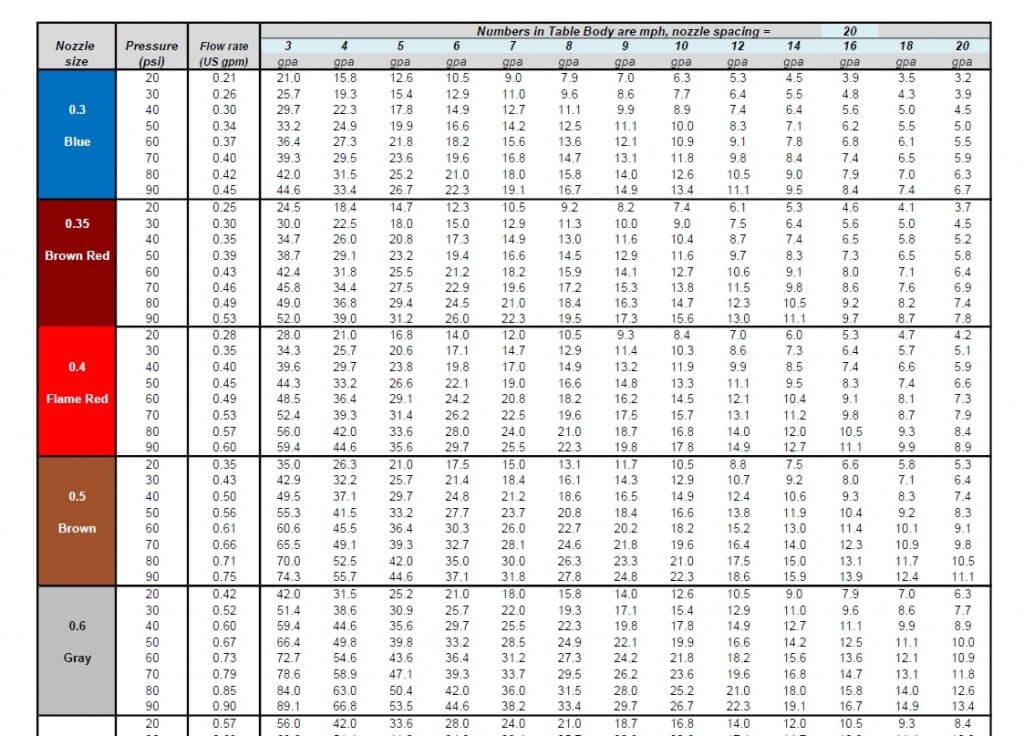
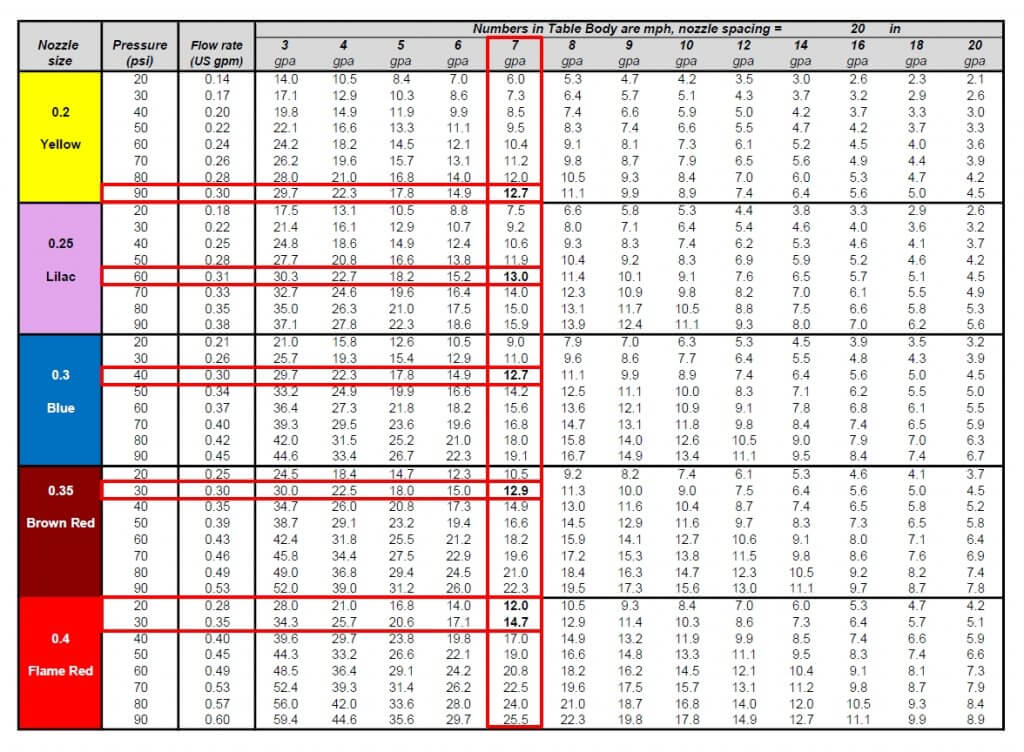
    Spray quality is the language that is used when selecting nozzles. All manufacturers publish spray quality charts for their nozzles that also give recommended pressures to produce different spray qualities using a particular nozzle type. Spray qualities are colour coded and generally speaking the hotter (redder) the colour code the more drift-prone (finer) the spray. There are many nozzle choices and designs and typically grassy targets and contact products require nozzles that will produce Medium to Coarse spray quality. For broadleaf targets and systemic products a Coarse to Very Coarse spray quality can be used successfully. Selecting the right nozzle to produce the quality of spray required is important, says Wolf who recommends Coarse as a general purpose spray quality.

  • Fungicide Application Basics

    Fungicide Application Basics

    Fungicide use appears to be the fastest growing segment of North American crop protection.  Here is some advice on how to get the best bang for the buck.

    • Timing is the most important part of fungicide application. Diseases can develop and spread quickly.  Most fungicides cannot cure a disease infection, they can only protect against it.  If an application misses the window, yield is lost.  Remember your priorities – become familiar with disease symptoms, the susceptibility of your crop and key growth stages.  Make sure your sprayer is ready – your nozzles are installed, calibrated, and you can achieve the necessary boom height.  Hire an agronomist to help scout and make recommendations. Make the right decision about whether to spray or not.
    • Water volume is the most important application parameter for fungicide application. In years of study, increasing water volume had a greater effect on fungicide performance than changes in droplet size or spray pressure.  More water is needed for fungicides than herbicides because of the greater amount of plant material present.  Getting coverage on leaf areas deeper into the canopy requires more water.  Although finer sprays can also help with coverage, this practice is riskier due to drift potential and higher evaporation rates.
    • Double nozzles, in particular the asymmetric types, are becoming more popular with fungicides. Double nozzles are proven effective and recommended primarily for fusarium head blight, or any other disease where an exposed vertical part of the plant canopy is the primary spray target.  Double nozzles are also useful for preventing the spray quality from getting too coarse as higher flow-rate nozzles (which tend to have larger droplets) are used.
    • Travel speed is important with fungicides. Canopy penetration sometimes improves with slower travel speeds, and this can be used as an advantage by eliminating the need for a special fungicide nozzle.  For example, assume a nozzle was used to apply 8 gpa of herbicide at 15 mph at 70 psi (this pressure assumes air-induced tips).  For fungicides, this same nozzle and pressure will deliver 12 gpa simply by slowing down to 10 mph.

    Boom height and spray quality are both important for single angled sprays or double nozzles. The angle at which a spray leaves a nozzle diminishes quickly as air resistance and gravity exert their influence.  If the boom is too high, the initial forward  angle will be lost and the spray droplets will actually deposit with gravity and wind.  But if the spray is a bit coarser and the boom is low enough, the angle of attack is retained for long enough to make a difference in spray deposition.

    Despite these suggestions for making the spray more effective, there is no substitute for an informed decision regarding fungicide use.  It’s possible that spraying is unnecessary for a number of reasons, and it’s best to have professional advice help make that call.  If you decide to go ahead, ensure that your sprayer is set up to deliver the fungicide to the part of the canopy that needs protection.

  • Water Quality and Spray Application

    Water Quality and Spray Application

    Water is one of the main inputs into a spray operation. The amount of water applied per acre is closely related to spray coverage and pesticide performance. But water quality – a term encompassing its cleanliness and chemical composition – is also critical to the performance of pesticides. Ensuring good performance means testing water and understanding the results.

    There are four main water quality indicators related to pesticide performance:

    1. Water Hardness. Water hardness is caused by positively charged minerals, primarily calcium and magnesium, but also sodium and iron. These cations can bind to some herbicides (glyphosate is the best-known example, also 2,4-D amine), reducing its performance. Hardness is usually named “Total Hardness (calculated)”, based on the concentration of calcium and magnesium in the sample, and is expressed in ppm or mg/L of CaCO3 equivalent. Some tests refer to the older unit “Grains”, which is ppm divided by 17.  Bayer suggests that total water hardness should be below 350 ppm (20 grains) for the low rate (1/2 L/acre equivalent) of glyphosate, and below 700 ppm for the higher rates.
    2. Bicarbonate.  Sometimes referred to as alkalinity, the bicarbonate ion can inhibit herbicide activity, and also make some herbicides more difficult to mix. The most commonly affected herbicides are members of the Group 1 modes of action, products like clethodim, sethoxydim, and others, as well as MCPA amine and 2,4-D amine. Definite guidelines are hard to find because the antagonistic effect of the bicarbonate ion depends on the presence of other ions such as sodium and calcium.
    3. pH. This is a complex parameter because it is related to pesticide solubility, hard water antagonism, and pesticide degradation. In most cases, pH values between 4 and 7 are considered acceptable. But some herbicides, notably those in the Group 2 modes of action, have specific pH needs to dissolve properly. For example, the sulfonylureas (FMC products such as Refine, Express), triazolopyrimidines (Corteval products such as Frontline, Simplicity), Triazolones (Bayer products such as Varro, Velocity M3) and Sulfonylaminocarbonyltriazolinone (UPL products such as Everest) dissolve better at higher pH, whereas the imidazolinones (Odyssey, Pursuit, Ares) tend to require lower pH. Some Group 14 products such as saflufenacil (BASF products Heat, Eragon) also prefer higher pH values for solubility. Label directions are important, sometimes calling for specific adjuvants to adjust the pH prior to adding the pesticide. Some pesticides, particularly insecticides, can break down rapidly in higher pH water. The rate of breakdown is usually not of importance on a spray day but may matter if a mixed tank needs to be stored for many hours or days.
    4. Cleanliness / turbidity. Water may contain suspended solids such as clay. Glyphosate and diquat (Reglone) are sensitive to this, as these chemicals are readily adsorbed to soil particles, and turbid water can reduce their effectiveness. This is also why dust generated by the sprayer can reduce these herbicides’ performance.

    Ensuring good performance

    Select clean water sources and conduct a water test to identify possible problems. Well water is more likely to be hard than surface water. If a laboratory water test is not available, then some quick home testing can provide the necessary guidance. First, use a conductivity meter to test the electrical conductivity (EC) of the spray water. Although this test does not identify the ions present, it shows if a potential problem exists. EC values less than 500 µS/cm are considered safe. For values above 500, a hardness test is necessary to confirm the presence of antagonizing cations. Paper test strips compared to a colour scale are a quick way to determine hardness.

    If you have done a water test and want to know what all the numbers mean, have a look here.

    If the water is hard, a generally accepted solution is to add ammonium sulphate (AMS) fertilizer at rates between 1 – 3% w/v of 21-0-0-24 to the spray tank, preferably before adding the herbicide. Spray grade liquid concentrate AMS product is available from Bayer CropScience, Winfield United, and some other suppliers.  The sulphate anions tie up the hard water cations, preventing them from antagonizing the herbicide. Liquid urea-ammonium nitrate (UAN, 28-0-0) has also been shown to improve herbicide activity for some products, but because it does not contain the sulphate ion, it is not as effective as AMS.

    Certain weak organic acids can also function as water conditioners. For example, citric acid can chelate hard water ions so long as the pH is not too low, that is, the necessary dissociable groups are ionic. If the pH is very low, these groups will be protonated and the chelating action is suppressed.

    Be careful when lowering pH. It does affect the solubility of many herbicides and possibly the function of some formulations. The outcome may be an unusable tank mix.

    Caution is also advised when adding foliar fertilizer specialty products. Adding a blend of fertilizer salts, combined with associated changes in pH, can result in unpredictable interactions with pesticides and water, resulting in sticky precipitates that may be very difficult to clean out of tanks and plumbing. Ask for compatibility data, and always conduct a jar test to be sure that the planned mixture mixes as expected. A recent study shows the effects of adding herbicides to UAN and ammonium thio-sulphate (ATS) plus nitrate stabilizers, where mixing order is critical.

    Turbidity is a problem with surface waters, especially in areas of clay soils and after surface runoff. If spray water is taken from a pond, its turbidity can be reduced by adding aluminum sulphate at rates between 10 to 60 mg/L of pond water. Thorough agitation is required, and 80 to 95% removal of turbidity is achieved within 24 to 48 h (technical information here).

    Pesticide manufacturers are usually aware of potential problems when their products are used in poor quality water. Consult with your local rep to learn of know issues and solutions before spraying.

    Check out this 2022 Real Agriculture interview with Tom and Greg Dahl of Winfield United. Pan ahead to the 16 minute mark for a discussion on water quality.

  • How to Use a Nozzle Flow Chart, With a Surprising Twist

    How to Use a Nozzle Flow Chart, With a Surprising Twist

    Undoubtedly, the number one question we get from operators is: “Which nozzle should I get”? Luckily there’s no simple answer, or we wouldn’t have jobs! The reason it’s not simple is because selecting the “right” nozzle for a sprayer is a process. It can be broken down into two steps:

    • identifying the right flow rate (aka nozzle size)
    • choosing a specific nozzle model (i.e. brand, spray pattern type, spray quality, etc.)

    It’s a big question, so let’s tackle just the first bullet: identifying the right flow rate.

    All sprayer nozzles come in standardized (ISO) sizes, and these sizes are usually identified by numbers stamped on the nozzle as well as the colour of the nozzle itself. The nozzle’s key characteristics (i.e. the fan angle and nominal flow rate), are identified in a format that looks like some version of this (Fig. 1):

    2013_Nozzle_Nomenclature
    Fig. 1: Typical information printed on modern nozzles.

    The 110 refers to the fan angle (110°) and the 04 refers to the flow rate. 04 means 0.4 US gallons of water per minute (gpm) at 40 psi. Each nozzle brand has a slightly different convention, but no matter how the information is presented it ought to be on the nozzle somewhere.

    Nozzle colour has an ISO standard across fan-style nozzles, and we have this table to match the nozzle colour to the flow rate:

    Fig 3: ISO nozzle colours and flow rates

    You’ll note that the nozzle we pictured earlier was “flame red”, matching the 0.4 gpm on the table. So how do we use the table to pick the right size nozzle?

    Application rate (i.e. gallons per acre or L/ha) is a function of travel speed, nozzle spacing along the boom, and nozzle flow rate. Traditionally, this has been expressed as the following formula in US units:

    US Calibration Formula

    This formula is famously represented in nozzle charts found in all sprayer catalogues (Fig 4). Along the left side are nozzle sizes and pressures. Along the top is sprayer speed. The body of the table contains application volume. Pick your speed, and look for your application volume in the columns. If you want to apply five gpa, you need to look for the number 5 (or as close as you can get to it), among these numbers.

    Hypro Calibration Chart
    Fig 4: Typical nozzle flow rate chart, with speed at top and volumes in body. Ugh.

    The format of the chart can be confusing because it doesn’t follow a modern sprayer operator’s priorities. Usually, an operator decides on an application volume first, and this decision is not very flexible. Travel speed, decided second, has more flexibility.

    We’ve therefore re-worked the table to make more sense (Fig. 5). Along the top are common water volumes. The body of the table are travel speeds. Pick a water volume at the top and follow the column underneath this value to find a speed range you’re comfortable with. To the left, the nozzle size and corresponding operating pressures are now visible.

    Fig. 5: Nozzle flow rate chart with volumes at top makes it user friendly.

    Try to operate at a spray pressure that’s in the middle of the nozzle’s operating range. For an air-induced nozzle, the range is usually from 30 to 90 psi, so the middle is 60 to 70 psi. That should be the target pressure. Look for a nozzle size that delivers this pressure at your expected travel speed.

    These columns can be used to work out a nozzle’s travel speed range. If a nozzle can be operated between 30 and 90 psi, for example, the corresponding speeds are listed in the same rows in the volume column.

    For example, say you want to apply seven gpa and think that 13 mph would be a good average travel speed.

    Fig 6: Five solutions for the question, “which nozzle to apply 7 gpa at 13 mph?”

    Move down the seven gpa column, and you’ll encounter a value close to 13 mph five times – the yellow nozzle at 90 psi, the lilac nozzle at 60 psi, the blue nozzle at 40 psi, the dark red at 30 psi, and the red at about 25 psi. Now use the columns to see which of these three best matches your expected travel speed range.

    The yellow nozzle would allow between seven and 12.5 mph from 30 and 90 psi, the lilac nozzle nine to 16 mph, the blue nozzle 11 to 19 mph, the dark red 13 to 22 mph, and the red 15 to 26 mph.

    The best choice for a typical air-induced tip would be the lilac 025 size, since it would meet the target speed of 13 mph at a perfect 60 psi, about right for nozzles of that size, and allowing some travel speed flex on the slower side.

    Some operators try to extend that range, but dropping below 30 psi will likely result in too narrow a pattern, or too coarse a spray quality, so it’s not advised.

    Note that the three-fold change in pressure from 30 to 90 psi translates to only a 1.73-fold change in travel speed. That’s due to the square-root nature of the relationship, as illustrated by this formula:

    Pressure Formula

    This exercise applies to sprayers with rate controllers that adjust pressure to regulate flow rates. However, if you use pulse-width modulation (e.g. Case AIM Command, Capstan Sharpshooter, Raven Hawkeye, or TeeJet DynaJet) check out this article describing these systems.

    There are a number of apps and websites, usually developed by nozzle manufacturers, which provide similar answers. These are also very useful, and all of them rely on the same formulas used in our new, simplified table. You can go here to download a high resolution version, suitable for framing, in both US and metric units.