Category: Tables & Apps

Calculators, tables and applications

  • OrchardMAX

    OrchardMAX

    2016_Orchard_Max_Logo

    OrchardMAX won the 2016 Canadian Agri-Marketing Association’s “Certificate of Merit” in the Mobile Apps Category.

    2022 Update

    OrchardMAX was developed in 2016. iOS and Android have moved on since then, so the links to the app no longer function. Maintaining this app for new operating systems requires a capitol expense which, presently, we have not explored. If you have some interest in exploring the model, reach out to jason@sprayers101.com and we’ll send you a copy that will work on Excel.

    What is OrchardMAX?

    OrchardMAX is a free app developed by the Ontario Ministry of Agriculture, Food and Rural Affairs to improve sprayer efficiency and effectiveness in apple orchards. The app is based on the Crop-Adapted Spraying (CAS) model, which was tested in semi-dwarf and high-density apple orchards in Ontario and Nova Scotia from 2013 to present day. The primary goal of the app is to help the sprayer operator achieve consistent coverage, no matter the architecture of the orchard block, throughout the season. Research has demonstrated that following the process improves coverage while reducing wasted spray by an average of 20% over the season.

    OrchardMAX will:

    • Accept Metric or US Imperial units
    • Create an inventory of your orchard airblast sprayers
    • Create an inventory of your orchard blocks
    • Determine optimal sprayer settings based on the average size, shape and density of the trees in the block
    • Propose a pesticide dose for each block, including ideal nozzle rates, water volume and product(s) per tank
    • Develop a permanent spray record that can be emailed to the user for archival
    • Calculate work rates and estimate productivity

    OrchardMAX won’t:

    • Exceed label rates
    • Calibrate your sprayer
    • Confirm spray coverage
    • Account for environmental conditions such as wind, humidity or temperature
    • Advise a volume below 400 L/ha (about 42.5 US g/ac)
    • Advise a dose that is less than 1/2 the label rate (that may seem low, but consider a first-year planting)

    Recognizing that this app can only approximate ideal sprayer settings based on data entered by the user, sprayer adjustments are still required on the part of the sprayer operator. Specifically, the sprayer operator must still calibrate and adjust the sprayer air to match the tree and the environmental conditions and confirm coverage using water-sensitive paper.

    Why you should try it

    Financial savings: The app will help you match your sprayer settings to the crop you’re trying to protect. That means you will find out if you are over- or under-spraying the tree canopy and by how much. This information, combined with feedback from water-sensitive paper, will improve canopy coverage and very probably improve the quality of the apple crop. Additionally, the app may lead to reduced pesticide volumes, which reduces environmental contamination and saves money.

    Explore different spraying scenarios: Perhaps you’re considering a new planting and you would like to know how many tanks it would take to spray an orchard block for a given speed, or row spacing. Perhaps you are considering a sprayer with a larger tank to reduce the number of refills, or a smaller tank to prevent rutting and you want to see how that affects your spray efficiency. Maybe you’re considering decreasing your fill time by using a tender or nurse truck. Enter the parameters and see how it affects your spray day BEFORE you invest.

    Create permanent spray records: The app will create a library of spray records that are emailed directly to you.

    How it works
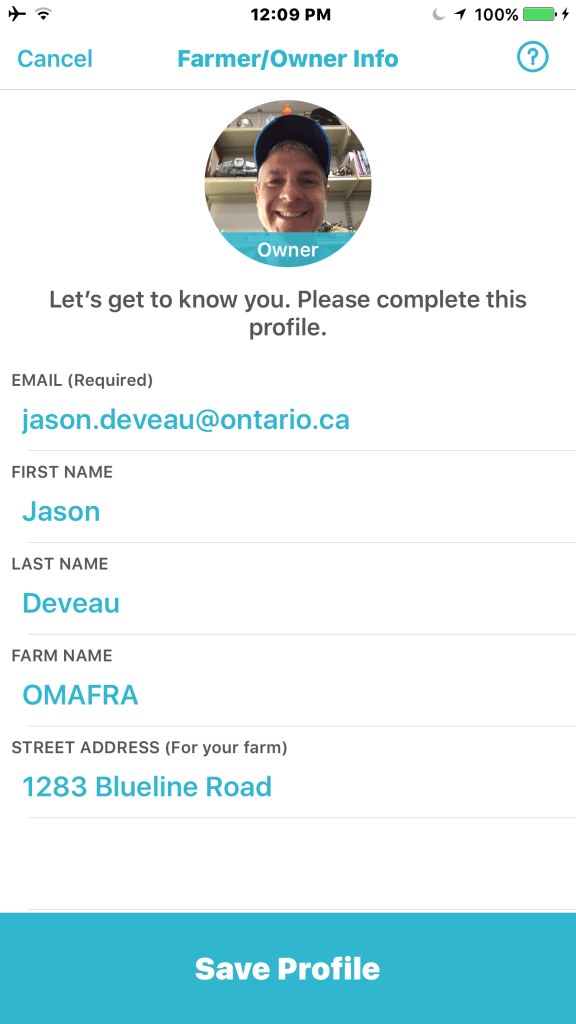
    Enter Farmer/Owner information
    Enter Farmer/Owner information

    Like any new practice, you have to put in a little time and effort to realize the full benefit of the app. Try it on a few blocks in the first year, make the changes to your spray program and review the results. As you get used to this new method for spraying, and see the improvement, you can continue to expand its use to the entire operation.

    First you have to enter information about your operation. This only has to be done once.

    1. Enter your profile information
    2. Complete the Inventory
    3. Information for each sprayer in your operation
    4. Information about each sprayer operator
    5. Information about each physiologically different orchard block (e.g. Trellised Gala on 10′ rows is quite different from mature semi-dwarf Empires)

    Now you are ready to calculate rates for a spray day.

    1. Choose the Sprayer, Operator and Block from your Inventory
    2. Decide if you want to use label-rate, or an optimized rate based on tree size
    3. Determine if you will spray every row, or alternate rows (You cannot choose to optimize your rate AND spray alternate rows)
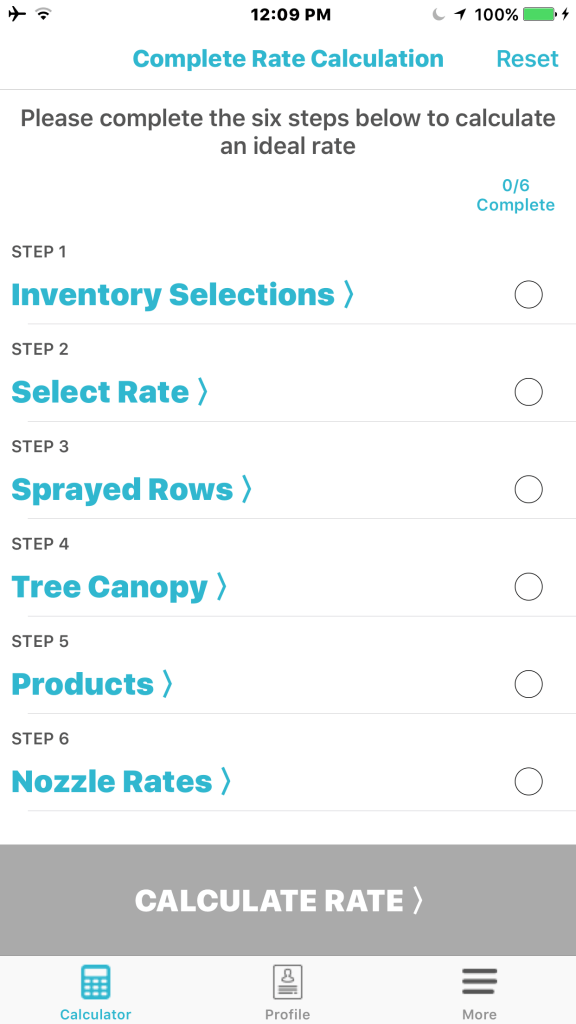
    Select sprayer, operator and block from inventory, then enter spray-day data to calculate rate and sprayer settings.
    Select sprayer, operator and block from inventory, then enter spray-day data to calculate rate and sprayer settings.

    Enter information about the tree shape and density (This accounts for pruning and time-of-season). This is mostly visual, where the user chooses from a series of pictures

    • Enter label rate and preferred rate for each pesticide in the spray mix

    The software then lets you know how much carrier and/or pesticide can be saved if you nozzle your sprayer according to it’s prescription.

    • From a nozzle catalog, enter the nozzle rates for each position within 5% of OrchardMax’s prescription

    The software then assembles a simple spray record, including all the rate adjustments and sprayer settings, which is emailed to you for your permanent records.

    Where can I get it?

    Select your operating system (images below) and you will be taken to the respective store and begin downloading. Please rate the app so we know it’s being used and can work to improve it. Please opt in to provide us with usage information so we can see how it’s being used – this is entirely private, and we will not contact you.

    NOTE: These links may no longer function. Contact jason@sprayers101.com if you’d like to learn more about the model or to try the Excel version.


    The OrchardMAX app was developed by AgNition Inc. with funding from Growing Forward 2.

  • Simple Statistics for Growers

    Simple Statistics for Growers

    In North America, winter is agriculture conference and lecture season. Growers are inundated with graphs and charts and left to make sense of what they’re seeing. It might be an agrichemical rep promoting a new pesticide or a seed dealer comparing yields. Maybe an equipment dealer is illustrating return on investment. Even university researchers and government extension specialists have been known to flash the occasional graph from time to time.

    Without a basic understanding of how data can be abused, we are at the mercy of those presenting the data. So, in 2012, I was asked to develop a talk that would give growers a basic grounding in descriptive statistics. More to the point, it would empower a grower to raise their hand and ask questions if they felt a presenter was talking out of their… *ahem*.

    • Did the researcher do their stats correctly?
    • Is the data clear and easy to understand?
    • Is the presenter skewing something to make us see what they want?

    Since writing it, I’ve been asked to deliver this talk to several grower groups, which is surprising because very few people love statistics. Now that we’re all webinar-savvy, I took the opportunity to update the presentation and record it.

    The video is only 15 minutes. When you’re done I hope you’ll appreciate that it’s OK to be skeptical of data. Ask questions and dig deeper.

  • Reading Airblast Nozzle Tables

    Reading Airblast Nozzle Tables

    Airblast operators should know how to read a nozzle table. They are found on dealer and manufacturer websites as well as in their catalogs. Table layout varies with brand, but they all relate a nozzle’s flow rate to operating pressure. The better tables also provide the spray angle and the median droplet size (i.e. spray quality).

    Operators need this information to complete calibration calculations (aka sprayer math) and when deciding how to distribute nozzle rates, angles and spray quality along a boom relative to the target canopy.

    This article focusses on hollow and full cone nozzles, which are commonly found on airblast sprayers. For more information on flat fan nozzle tables (e.g. for banded under-canopy or, vertical booms or broadcast applications from horizontal booms), refer to this article.

    Reading the table

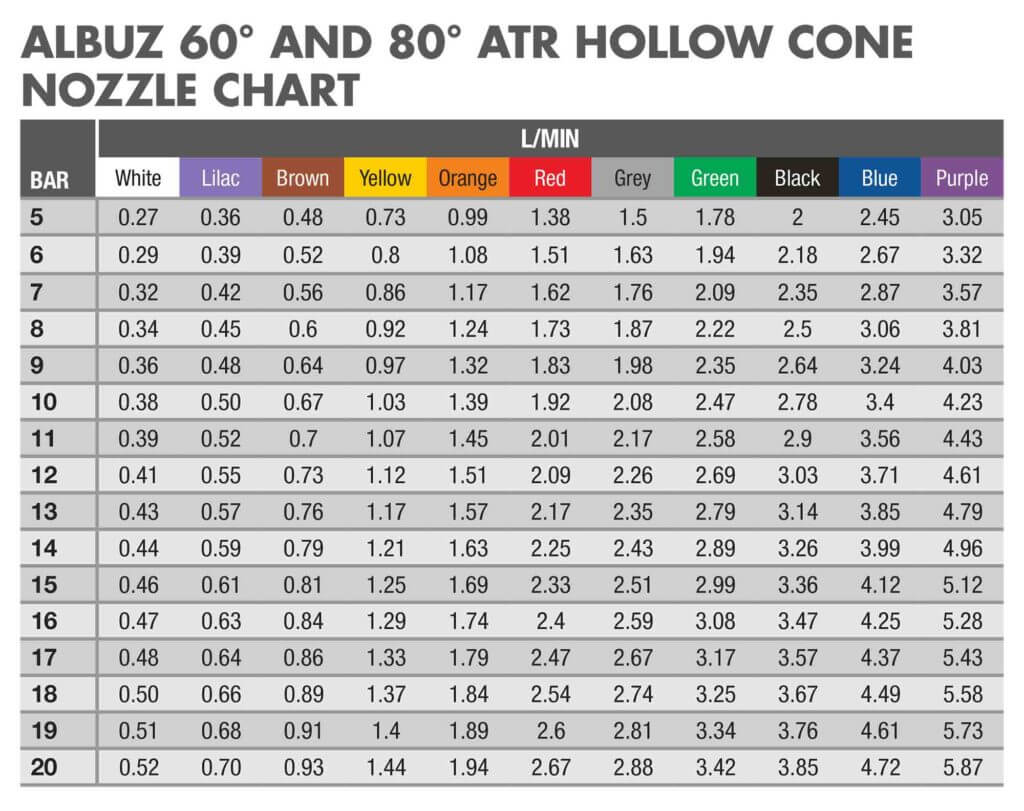
    Let’s use the table below to determine a nozzle’s flow rate for a given pressure. First, find the nozzle colour in the top row. Second, find the operating pressure in the left-most column. Finally, the flow rate is indicated in the cell at the intersection between the row and column. For example, a red ATR hollow cone nozzle operated at 9 bar will emit a flow rate of 1.83 L/min.

    Perhaps you want to determine which nozzle will give a specific flow rate. Find the rate in the body of the table and trace the column and row to determine which nozzle/pressure combination will achieve it. For example, if we want a flow rate of ~1.00 L/min, we can use a Yellow at 10 bar or an Orange at 5 bar. Yellow is the better choice since the Orange would have to be operated at the bottom of its pressure range (more on that later).

    This Albuz nozzle table for 60 and 80 degree molded hollow cones gives flow rates in litres per minute.

    Note: Do not to confuse TeeJet’s ISO-standardized TXA or TXB nozzles with TXVK or ConeJet nozzles. They may be the same colour, but their outputs are very different.

    Higher flow rates or full cone patterns can be achieved using combination disc and core (or disc and whirl) nozzles. Depending on the manufacturer, the disc plate is defined by it’s diameter in 64th’s of an inch. The core or whirl plate might be described by the number of holes (e.g. 2-hole, 3-hole, etc.), or some other manufacturer-specific nomenclature (e.g. 45’s, 25’s etc.).

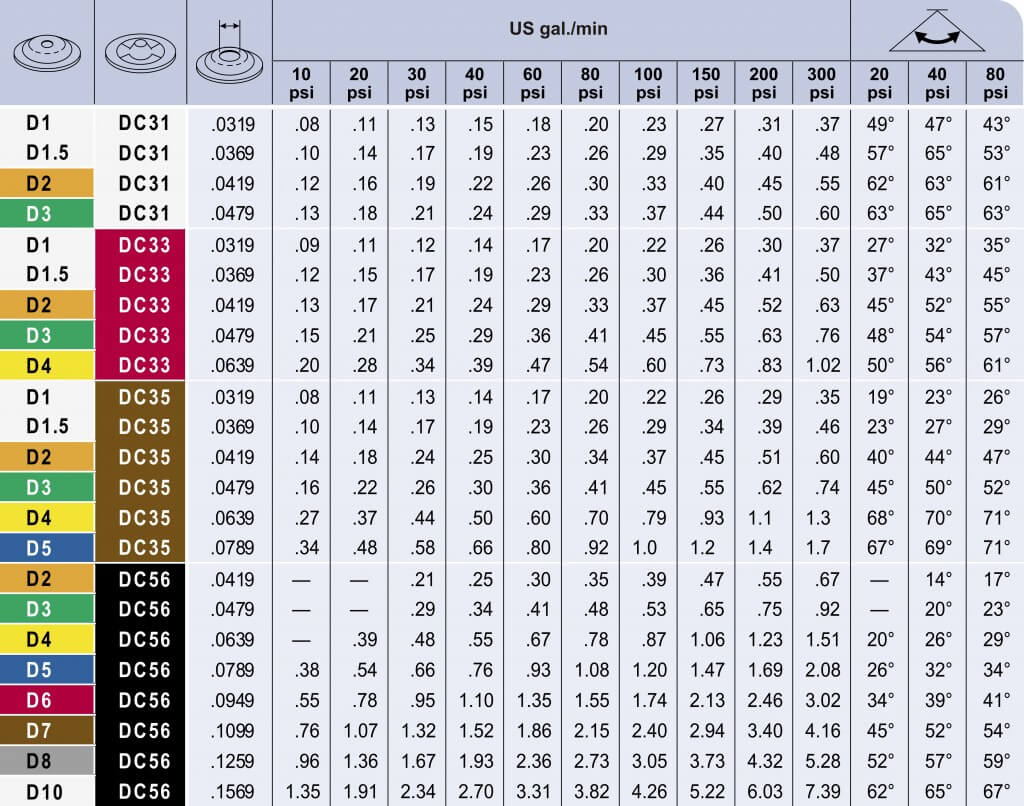
    Using the table below, we see that a D2 disc and a DC35 core will emit 0.34 gpm at 80 psi. By continuing along the row, we see that the spray angle for this combination will be 47 degrees at that pressure.

    This nozzle Table for TeeJet disc & cores is fairly typical of any manufacturer’s nozzle table. Find the disc & core combination in the two left-hand columns, and follow the row until it intersects your operating pressure to determine the rate in US gallons per minute. Or, if you know your ideal rate already, you can find the best disc & core combination for a given pressure to achieve that rate.
    This TeeJet nozzle table gives the flow rate for a disc (D#) and core (DC#) full cone combination nozzles in US gallons per minute.

    Pressure problems

    Do not choose a nozzle at the extreme of their flow or pressure range. A trailed PTO sprayer will experience pressure changes from driving on hills, or rate controllers will create pressure changes in response to changes in travel speed. In either situation, coverage will be compromised if the nozzle is pushed outside its optimal range.

    Note: Use pressure to achieve small changes in flow, but for more extreme changes, switch nozzles. Remember, it takes 4x the pressure to get 2x the flow. Stated differently, it takes 1/4 the pressure to get 1/2 the flow.

    You may not find a nozzle/pressure combination that emits the rate you are looking for. When your desired rate or pressure falls between the figures listed in the table, you can take the average. When nozzling an entire boom with different nozzle rates, get each position as close as you can to achieve the overall boom rate for a given pressure. It’s always a compromise – don’t stress over it.

    The author looking up nozzle rates during a spring calibration. The operator was running at 190 psi, but the catalogue only listed 180 psi and 200 psi. When span is only 20 psi, it’s fairly safe to approximate the output. When the table only lists in 50 psi increments, it is more difficult to determine the rate without testing the output. This issue usually occurs at pressures above 200 psi, and that’s very high for most horticultural operations. Consider using a lower operating pressure, if possible.
    Looking up nozzle rates during a spring calibration. The operator was running at 190 psi, but the catalogue only listed 180 psi and 200 psi. When the increment is only 20 psi, it’s reasonable to approximate the output. When the span is 50 psi increments, it is more difficult to determine the rate without testing the output (it’s not a linear relationship). This issue usually occurs at pressures above 200 psi, and that’s far too high for cane, bush, vine and high-density orchards. In these situations, consider using a lower operating pressure.

    Different nozzles, same rate

    Different disc core combinations, or molded nozzles at different pressures, can produce similar flow rates. However, their spray quality and spray cone angles can be very different (see last three columns in the TeeJet table above).

    The angle of the spray cone can have a big impact on spray coverage. When the target is far away from the corresponding nozzle (e.g. the tops of nut trees), or the canopy is very, very dense (e.g. citrus canopies), consider tight-angled full cones under high pressure. This is inefficient and can give variable coverage, but it is sometimes the only option in extreme situations.

    Two hollow cone nozzles on top and five full cone nozzles below. Note the lack of spray overlap with the full cones for the first few meters. This would be a concern if the target were closer to the sprayer, such as grape or berry. Also note that the top two nozzles should not be on; their spray will likely not reach the intended target.
    Oops! Two hollow cone nozzles on top and five full cone nozzles below is the exact opposite of how things should be. Note the lack of spray overlap with the full cones for the first few meters. Spray from the top two positions will likely not reach the intended target.

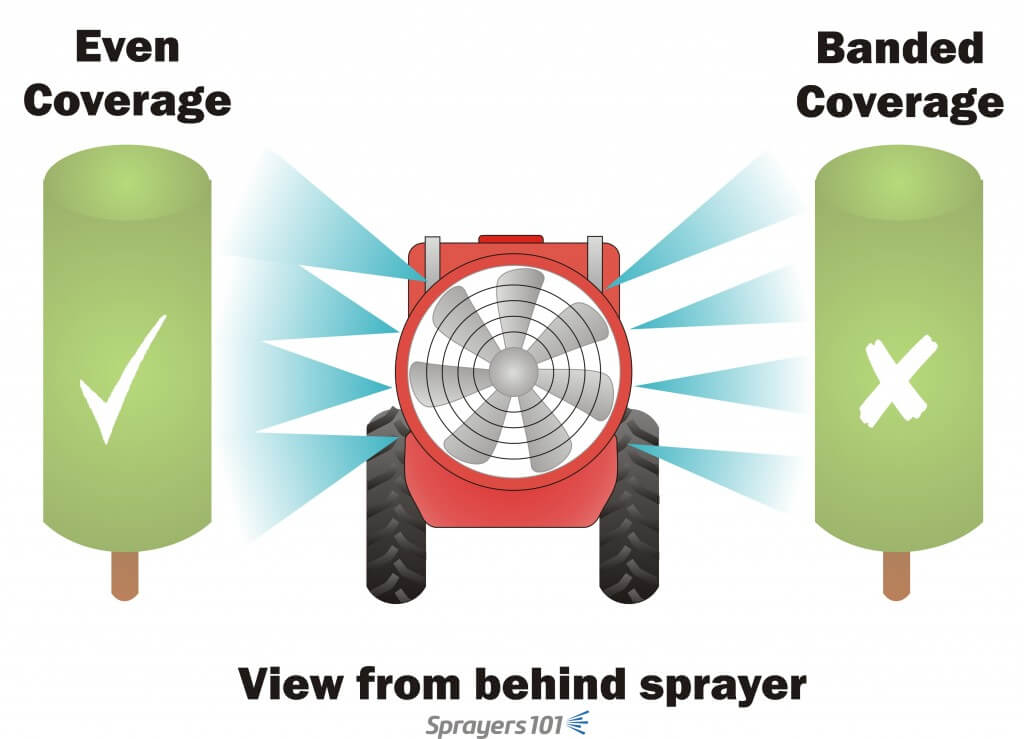
    When the target is very close to the sprayer, full cones do not overlap and create undesirable striping or banded coverage. Creating a full, overlapping spray swath that spans the entire canopy is a function of nozzle spacing, distance-to-target, and sprayer air-settings. It can also be affected by humidity, wind speed and wind direction at the time of spraying.

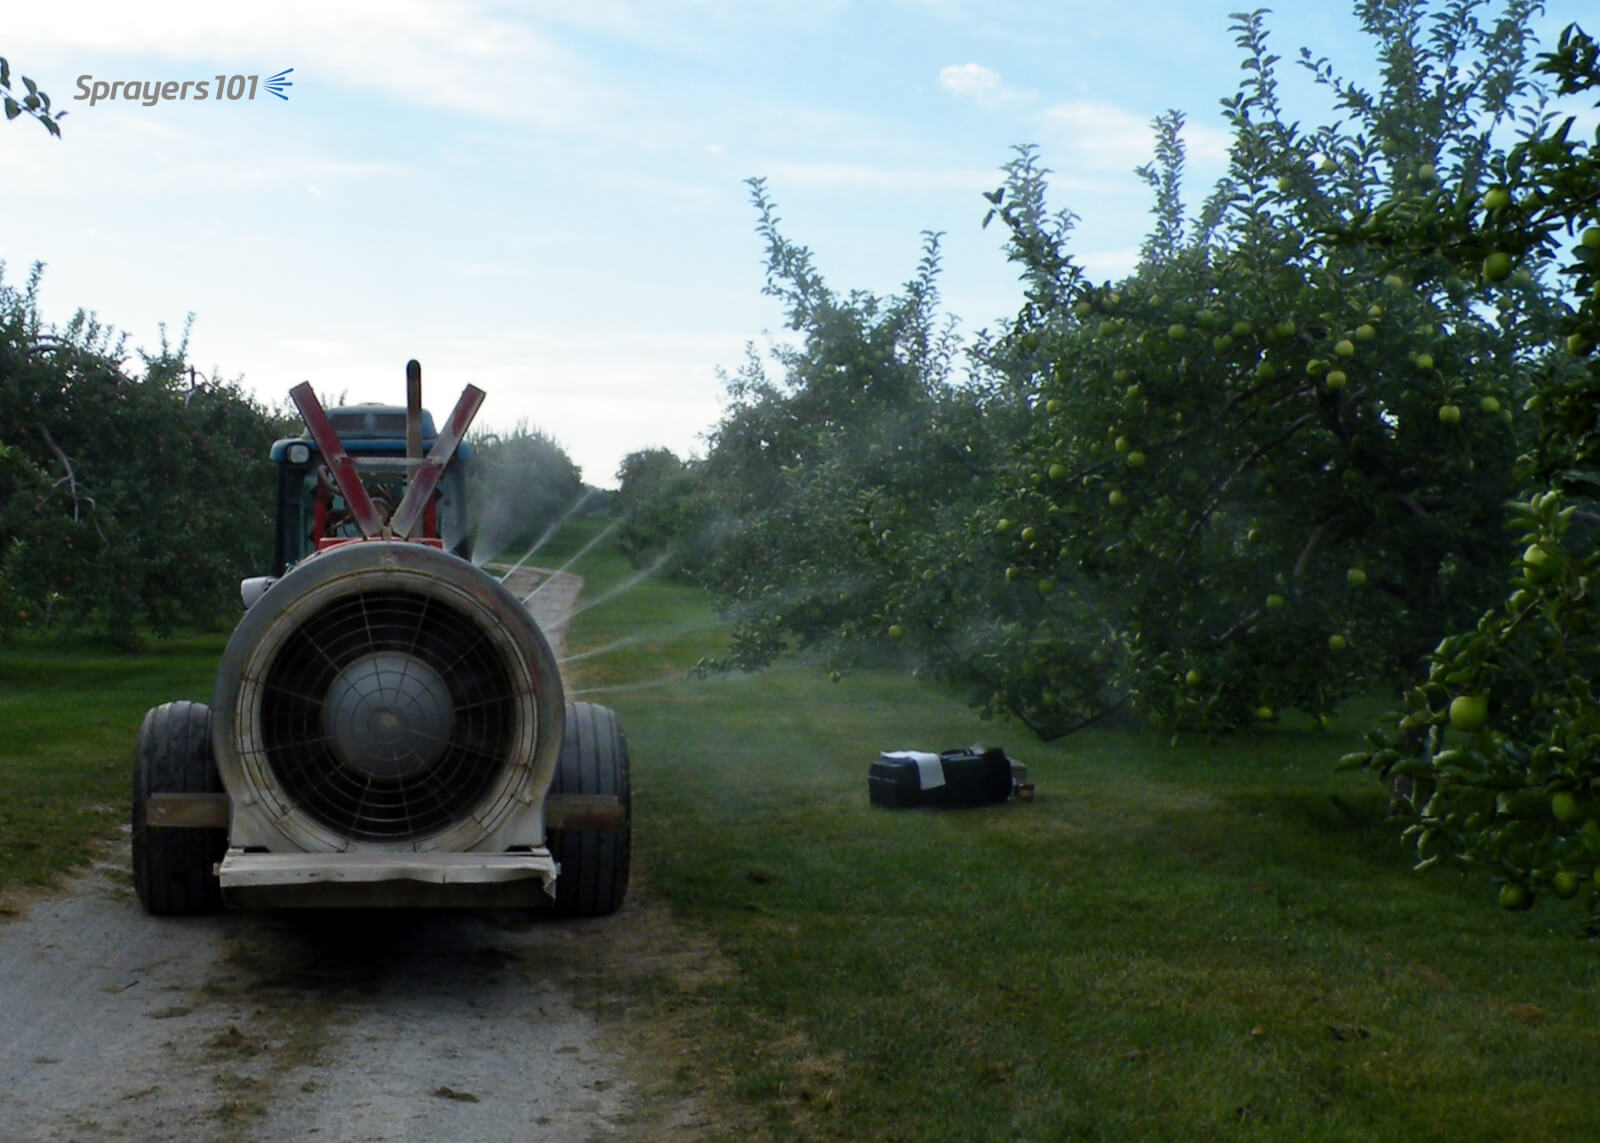
    Confirm your settings by parking the sprayer in the alley between crops. With the air on, spray clean water while a partner stands a safe distance behind the sprayer to look for gaps in the swath. The partner will see things the operator’s shoulder check will not reveal.

    Shoulder checks may not show you what’s really happening. Have someone stand behind the sprayer while spraying clean water to see the nozzle spray overlaps sufficiently to span the entire canopy.
    Here’s what the operator sees. But, shoulder checks may not show you what’s really happening. Have someone stand a safe distance behind the sprayer while spraying clean water to see the nozzle spray overlaps sufficiently to span the entire canopy.
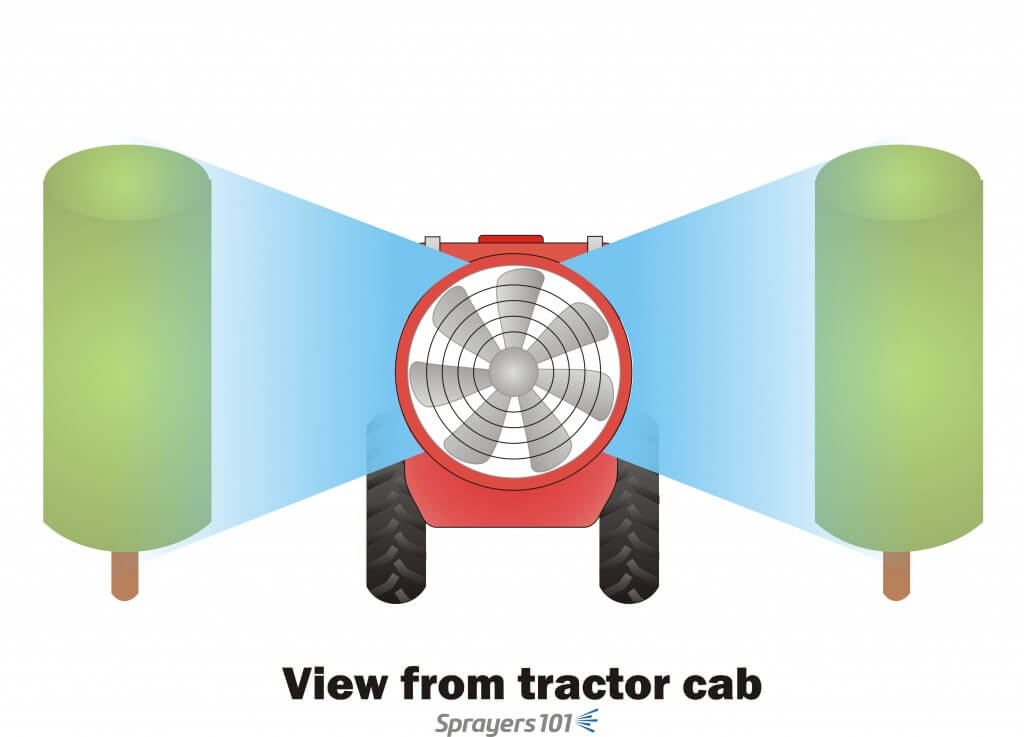
    Shoulder checks may not show you what’s really happening. Have someone stand behind the sprayer while spraying clean water to see the nozzle spray overlaps sufficiently to span the entire canopy.
    Here’s what the partner standing behind the sprayer sees. Take a picture with a smartphone to show the operator.

    Nozzle tables can be wrong

    Sometimes nozzles do not perform per the nozzle table. We have discovered errors in published tables, worldwide. Here are the big three:

    • Conversion errors. Manufacturers publish catalogs in Metric and in US Imperial, but we have found many errors in the conversions.
    • Spray angle errors. When nozzles are operated at the extremes of their pressure ranges, spray angles deviate from those listed in the tables.
    • Flow rate errors. When tables are not updated to reflect changes in nozzle design, or the manufacturing process, actual flow rates deviate from those listed in the tables.

    Perhaps it’s not the table, but the nozzle itself. Most nozzle manufacturers accept a flow variability up to +/- 2.5% for new nozzles, but we have seen higher. It depends how they are made (machined, stamped, printed) and the material they are made of.

    Validate flow rate and pattern

    When errors are discovered and reported, the manufacturers can be slow to issue corrections and the errors will persist in old tables. Yes, even apps (which are often based on tables) can be wrong. So, predicted flow rates can prove unreliable. This is why it is important to double check by observing nozzle overlap and validating flow rate when you replace nozzles – even when they are brand new.

    Thanks to Dr. David Manktelow (Applied Research and Technologies, Ltd., NZ) for input into this article.

  • Productivity Calculator

    Productivity Calculator

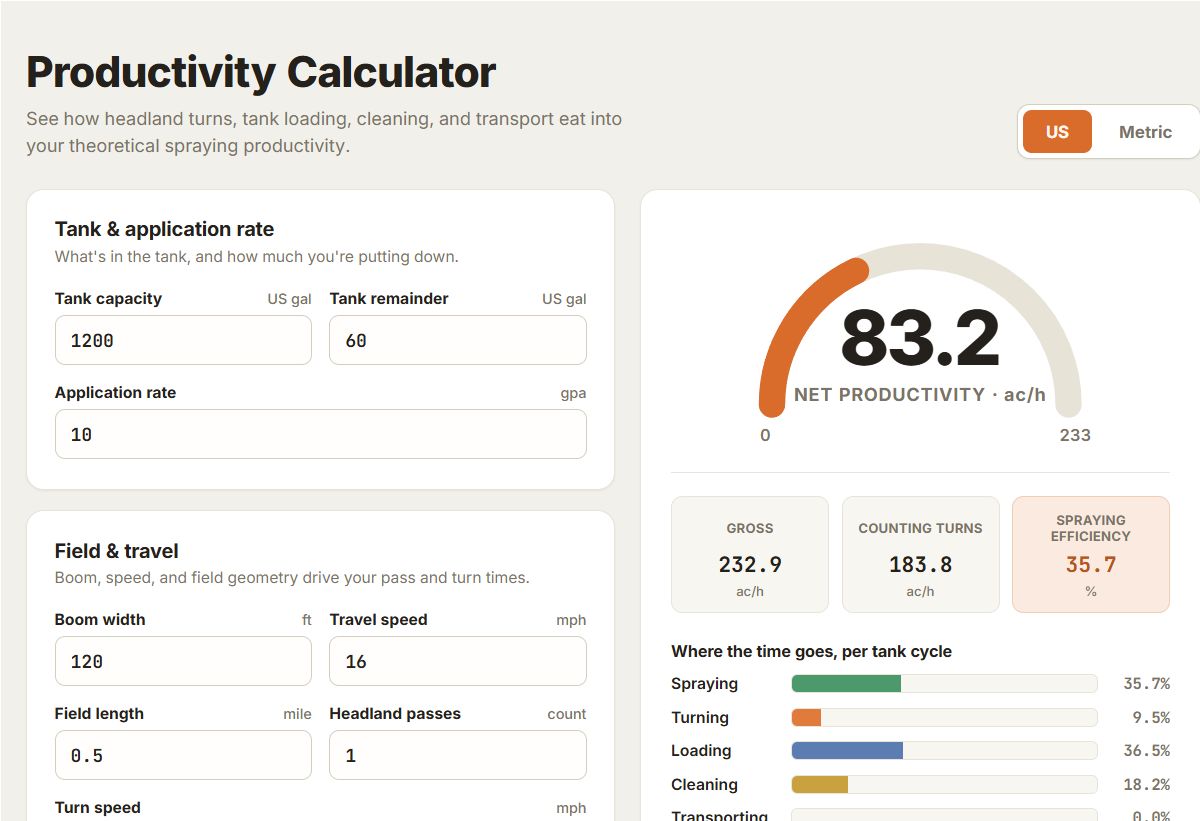
    Want to figure out how your sprayer configuration affects your productivity?  Try out that tells you acres per hour, the amount of productivity lost to turning, cleaning, filling, and transporting. You can test the benefit of faster tendering, bigger tanks, wider booms, /or changing the application volume.

    You might be surprised how productive you can be without driving faster.

    Download the app to your phone or laptop where it will run natively. On a phone, use the “Save to Homescreen” feature to create an icon there.

  • How Low Can You Go?

    How Low Can You Go?

    Listen to an audio recording of this article by clicking here

    There’s a lot of talk about lowering the boom to reduce drift and make twin fan nozzles more effective. But how low can we actually go with a boom before striping becomes a problem?

    We’ve done some calculating and have come up with answers.

    First, a few guidelines. Tapered flat fan nozzles require overlap to generate a uniform volume distribution under the boom. Traditionally, we’ve recommended 30 to 50% overlap with fine flat fan sprays. The small droplets tended to redistribute to fill in any gaps that might occur.

    Overlap from fine sprays is less critical than from coarser sprays because the small droplets redistribute readily.

    The advent of low-drift nozzles changed that advice. This nozzle type produces fewer droplets overall, and, like all fan-style nozzles, puts the coarser ones towards the outside edges of the fan. These don’t redistribute.

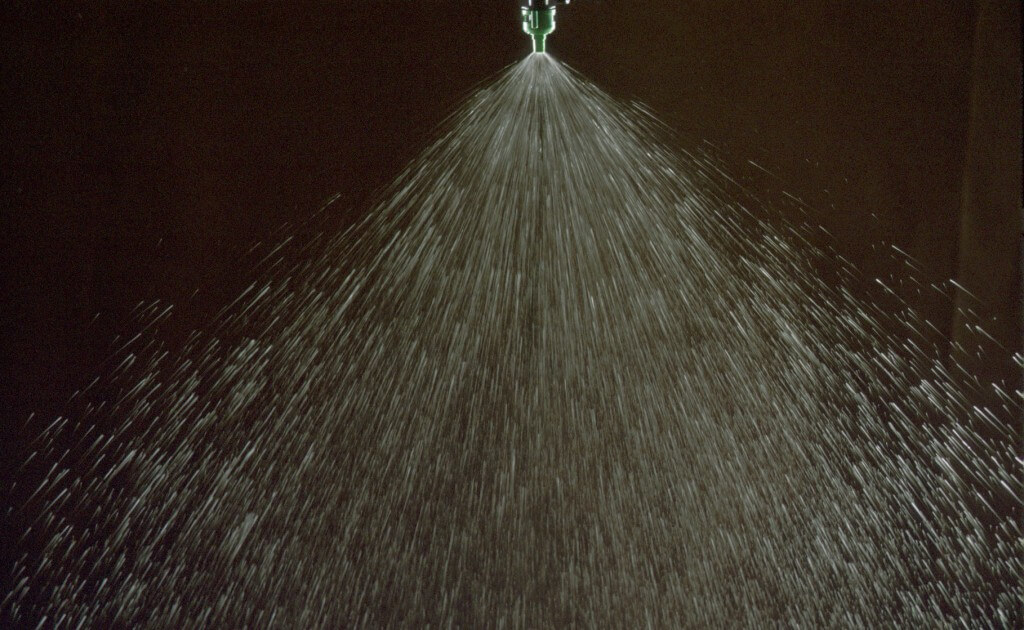
    A typical flat fan spray places the coarser droplets at its periphery, and the smaller ones in the middle. When only the outed edges overlap, that can creates a band of poor coverage.

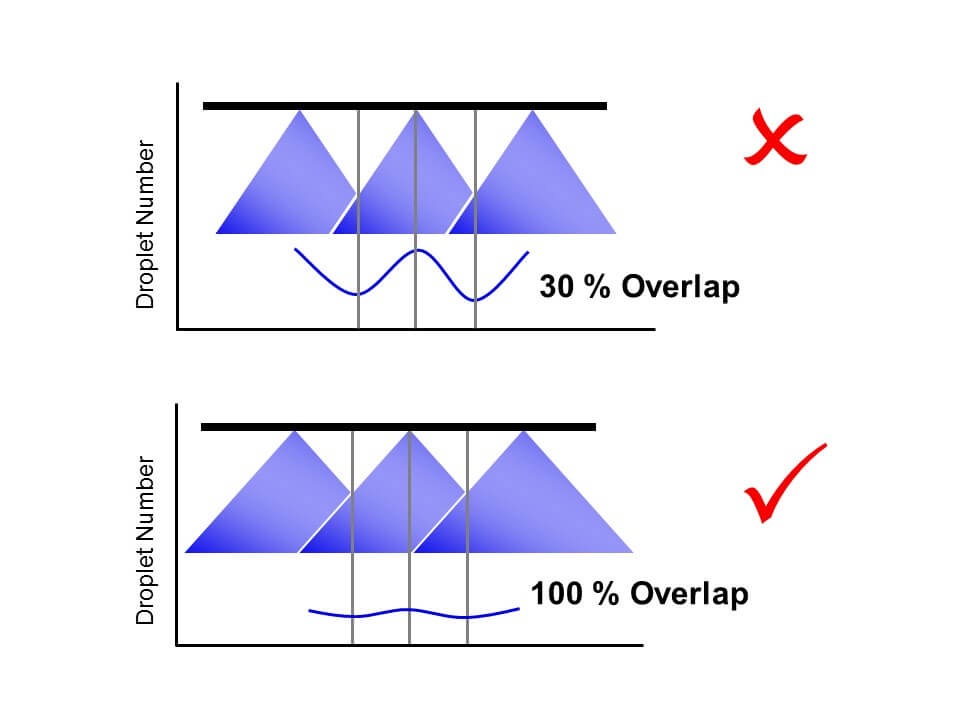
    When we had 30% overlap and these two edges met, a region of relatively few, coarse droplets was formed, and this region contained almost no small droplets. On a patternator, the volume distribution was still good. But when we measured the droplet density, we saw a deficit in coverage at the overlap.

    With low-drift nozzles, we need 100% overlap to distribute both small and large droplets uniformly under the spray swath. Too little overlap and we create bands of relatively few but large droplets that can cause striping.

    Since then, we’ve been recommending 100% overlap for low-drift sprays. This means that the pattern width at the target will be twice the nozzle spacing, and all regions under the boom receive droplets from two adjacent nozzles.

    With this adjustment, small droplets appeared throughout the spray swath, and striping was eliminated.

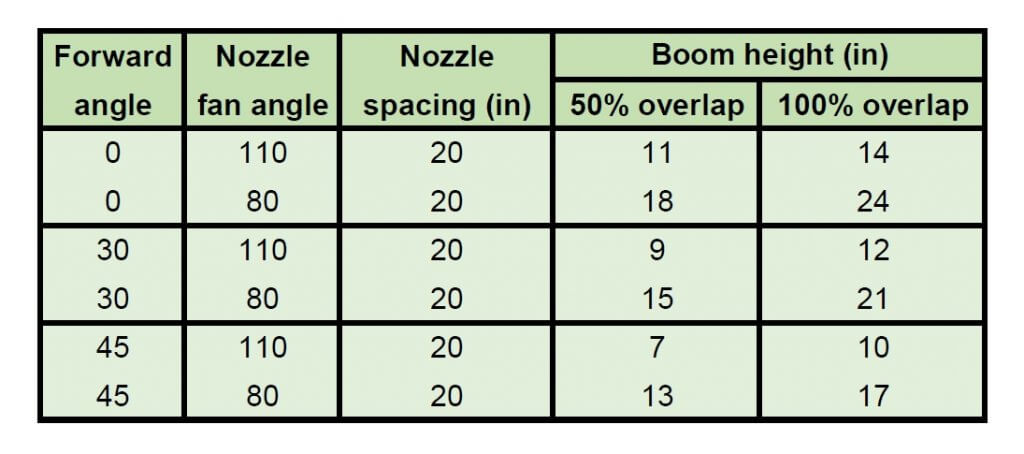
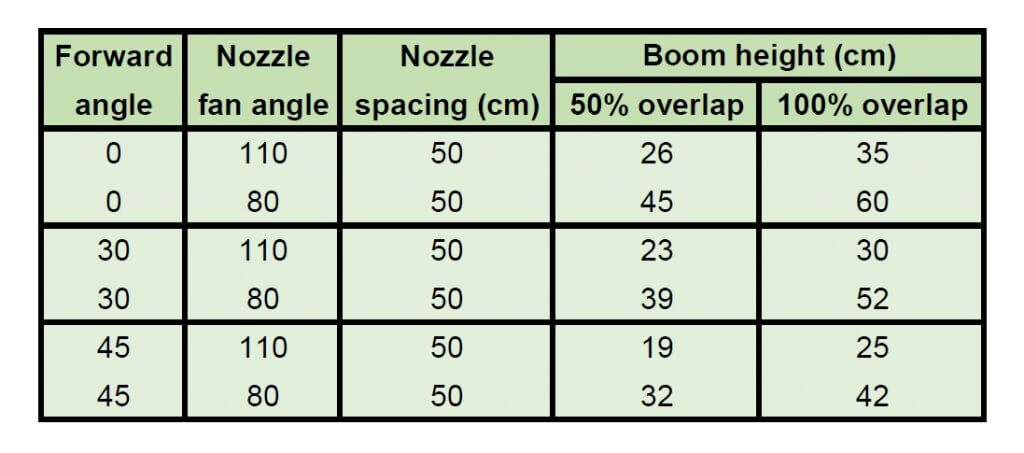
    That leaves the question, just how low can a boom be set without creating this problem? The following tables provide some theoretical numbers.

    Minimum boom heights for achieving 50% and 100% overlap of flat fan spray nozzles (US units)

    Minimum boom heights for achieving 50% and 100% overlap of flat fan spray nozzles (metric units)

    A word of caution: The advertised fan angle on a sprayer nozzle often differs in practice. Not only will it be slightly different by design, it also depends on spray pressure and tank mix. As a result, it’s best to do a visual check. Set the spray pressure to the minimum you expect to use. Inspect the spray patterns and set the boom height so that the edge of each nozzle pattern reaches to the middle of the next nozzle. That means your pattern width is twice the spacing and will give 100% overlap. No tape measure required.

    The tables were generated from a spreadsheet which can be downloaded here:

    • The values are theoretical and assume the fan angles are accurate. Some nozzles don’t produce the advertised fan angle. Enter your actual angle in the spreadsheet if you know it.
    • The theory assumes that the droplets at the edge of the fan always move in their projected direction. In fact, after some distance, say 50 to 75 cm, gravity pulls the droplets down and the pattern no longer widens at the same rate. The rate of pattern collapse depends on the droplet sizes.
    • Use the 0% overlap column to help with banding nozzle pattern width. Simply use the nozzle spacing column to enter your desired band width.
    • Note that angling the nozzles forward or backward decreases your minimum boom height, but depending on the deflection of the spray in the wind, this too has limits.
    • Too high a boom obviously increases drift. But patternation from overlap isn’t affected that much, largely because the pattern is now subject to aerodynamics and that becomes more important.

    Pro Tip: Attach a length of plastic hose or a large zip tie to the boom, cut to your minimum boom height. This makes it easier to see what your boom height is, from the cab or the ground.

    The bottom line is that a boom can be quite low and still allow excellent overlap and pattern uniformity from the nozzles. Yet we all know that most sprayer booms can’t reliably operate that low because they don’t control sway well enough. The ball’s in your court, sprayer manufacturers!