This video won the Gold 2019 Canadian Farm Writers Federation’s Jack McPherson Award for Electronic Media. This award is for the best video, news story or feature broadcast by a Canadian medium less than 15 minutes in length on an agricultural topic. We’d like to thank Jason Strove, Bern Tobin and the whole team at RealAgriculture for helping to bring Exploding Sprayer Myths to life.
Welcome to season four of Exploding Sprayer Myths, featuring a new opening sequence and a special guest star. Have fun accidentally learning about reducing pesticide drift as we poke fun at Canadian and Australian stereotypes. If you’re unfamiliar with the McKenzie Brothers and the Great-White North, then be sure to educate yourself here before you take off, eh?
Beauty.
Thanks to Mary O’Brien (@SprayDriftGirl) and the Simcoe Research Station.
Humidity is important in spraying. With the average tank of pesticide being 90 to 99.5% water, evaporation plays an important role in both droplet size and active ingredient concentration. Low humidity causes droplets to evaporate faster, potentially increasing drift and reducing uptake. But relative humidity (RH) isn’t the best way to measure this effect because the same RH at two different temperatures results in two different water evaporation rates.
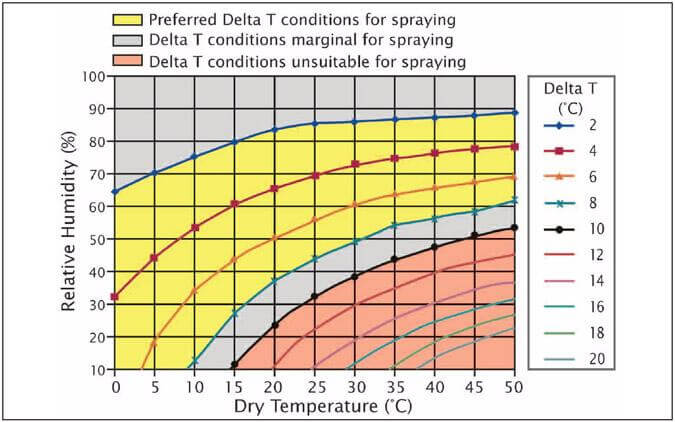
Instead, we present Delta T, also known as “wet bulb depression”. Delta T is an atmospheric moisture parameter whose use in spraying has made its way to North America from Australian operations. It is defined as the dry bulb temperature minus the wet bulb temperature, and provides a better indication of water evaporation rate than RH. Higher Delta T means faster water evaporation.
The recommendations from Australia are to avoid spraying when the Delta T is either too high or too low, with a range of two to eight being described as ideal.
Figure 1: Delta T chart used in Australia (Source: Australian Gov’t Dept of Meteorology)
Delta T is being reported on an increasing number of weather stations, and it’s time we took a closer look at what it means.
Measuring Relative Humidity
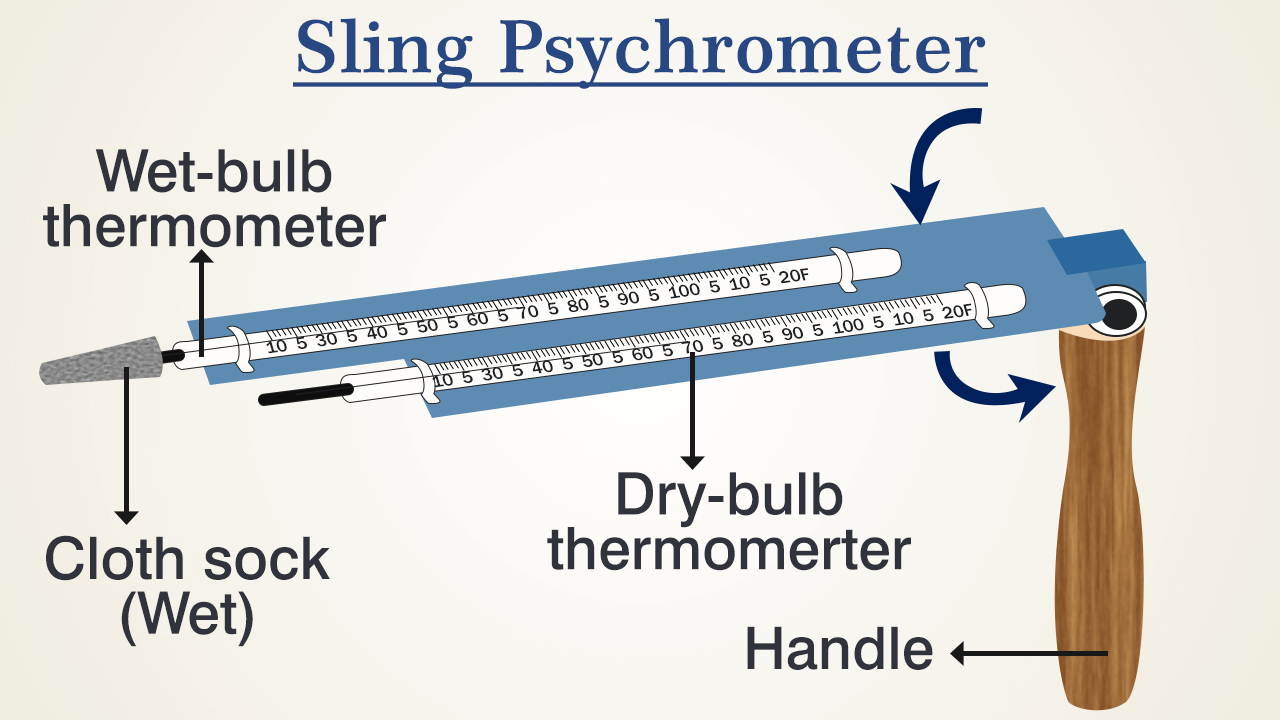
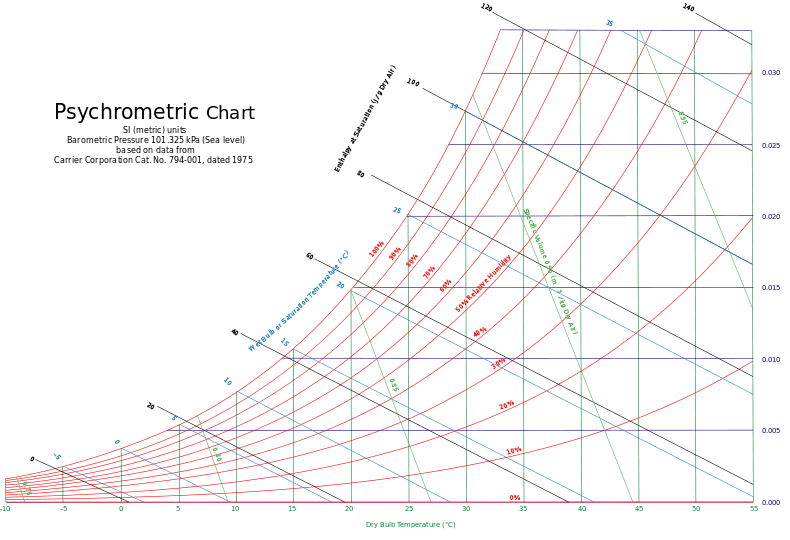
In the early days of weather reporting, relative humidity was calculated from psychrometric charts. All one needed was a hygrometer, usually a sling psychrometer. A sling psychrometer is two identical thermometers side by side whose bulbs could be slung in a circle, exposing them to moving air. One bulb was covered in a cotton wick moistened with distilled water, the other was left exposed and dry.
As the bulbs met moving air, water evaporated from the cotton wick and that reduced the temperature of that thermometer. The dryer the air, the greater the evaporation rate and therefore the greater the temperature drop. The dry thermometer was unaffected by this movement.
On measuring the wet and dry bulb temperature, one consulted a psychrometric chart. This chart converted the two temperatures to total water content in the air, compared it to total water-holding capacity, and expressed it as Relative Humidity. Psychrometric charts are useful for many other air parameters such as dew point, vapour pressure, or enthalpy. (Pause briefly to give thanks that we don’t need to know what enthalpy is.)
Turns out that RH is a poor measure of water evaporation rate. An RH of 24% at 20 C has exactly the same evaporation rate as an RH of 44% at 35 C. That’s why Delta T is the preferred measurement: it’s linearly related to evaporation.
Note: Modern electronic weather stations don’t need two thermometers to measure air moisture content, and use polymers whose capacitance or resistance changes with atmospheric moisture. Add an internal look-up table, and we have all the information we need.
Pros and Cons of Water Evaporation
It’s important to note that our Australian colleagues caution against spraying when water evaporation rate is both too high and too low.
Too High:
Water evaporates rapidly, reducing droplet size and pre-disposing the smaller droplets to drift;
Deposited droplets dry quickly, reducing pesticide uptake which is more effective from a wet deposit.
Too Low:
Water doesn’t evaporate, maintaining the smaller droplets in a liquid state. These small droplets are already drift prone, but are now more potent because of more effective uptake. Overnight conditions that are inverted are usually humid, adding to harm potential from the inversion.
Delta T in North America
The addition of this parameter to our spraying weather lexicon has been useful. But it’s important to understand the context in which it was developed to properly judge its suitability.
Aussies started talking about Delta T because the use of finer sprays under the hot dry conditions found during their summer sprays resulted in significant evaporative losses, significantly greater drift potential, and potential reduction of product performance. The guidelines to avoid spraying when Delta T exceeds eight or ten originate there.
A few changes have happened since these guidelines were developed. Over the past ten to 20 years, we’ve observed greater use of low-drift sprays, with the coarser sprays’ larger droplets resisting fast evaporation. In the past five to ten years, water volumes have increased due to our heavier reliance on fungicides, desiccants, and contact modes of action. Both of these developments have helped reduce the impact of a dry atmosphere. We simply can’t say if a Delta T of 10 is too high with these new application methods.
Looking at it another way, if Delta T values are very high, increasing water volume and droplet size will mitigate that to some degree, as the Aussies state in their extension materials (linked earlier).
Formulation
Pesticide formulation can also play a role in evaporation. Once the water is gone, oily formulations may still have good uptake because the oily active ingredient stays dissolved in the oily solvents. This is both good and bad, helping on-target efficacy but also increasing the risk of more potent drift. Solutions, on the other hand, are more likely to leave their actives stranded on leaves as crystals once the water is gone.
Bottom Line
Delta T is definitely useful information when spraying. It will typically rise and fall with air temperature as the day proceeds, and it is wise to consider suspending operations when values are critical. Take note of the Delta T when spraying the same product throughout these hot days and learn from the experience. Remember, the atmosphere affects not just sprays but also plants and insects, and due to this complexity we may not be able to attribute success or failure to just one measurement.
Note: This article was written by Bob Wolf of Wolf Consulting and Research, and first appeared as an NDSU Extension Service publication. Bob has agreed to reproduce the article on our website.
When applying crop protection products, a good steward is one who can identify and record the environmental factors that may negatively impact making an application; particularly, the possibility of spray drift.
New label language states: “Avoiding spray drift at the application site is the responsibility of the applicator.” A wise sprayer operator must possess the ability to assess the environmental conditions at the field location to determine how best to spray the field, or maybe decide it would be best not to spray that field, or part of that field, at that time. Instruments that assess environmental conditions are available to assist applicators in making good decisions.
Making the correct measurement is the critical first step. Record the information measured to document the application conditions. Quality records help mitigate against any misapplication allegations, such as a drift complaint. Many of the items listed below are based on past legal experiences with applications involving spray drift litigation.
The following guidelines should help you measure and accurately record environmental conditions at the application site.
1- Document any instrument used by recording the manufacturer and model number. Accurate portable weather instruments are recommended. Portable weather instruments are available that log and store data, and aid in auditing and recordkeeping. Some will have Bluetooth/wireless capabilities.
2- Environmental measurements include wind speed and direction, temperature, and relative humidity.
3- At a minimum, record data at the start and finish of the job. Consider more often as conditions change or for a job that lasts over a longer period. For example, make observations when tank refilling for larger fields. Time stamp all observations with a.m., p.m., or military time.
4- Take meteorological readings as close to the application site as possible. Be advised that the weather data received via a smart phone or local weather station may not be accurate for the location being sprayed.
Note the specific location where the measurement was made, such as GPS coordinates, field entry point, field location, etc. Check the label to see if it requires a specific observation location in relation to the treatment area.
5- Make all measurements as close as possible to the nozzle release height (boom height) and in an area not protected from the wind by the spray machine or your body. For aerial applications, six feet is suggested when using a hand held instrument.
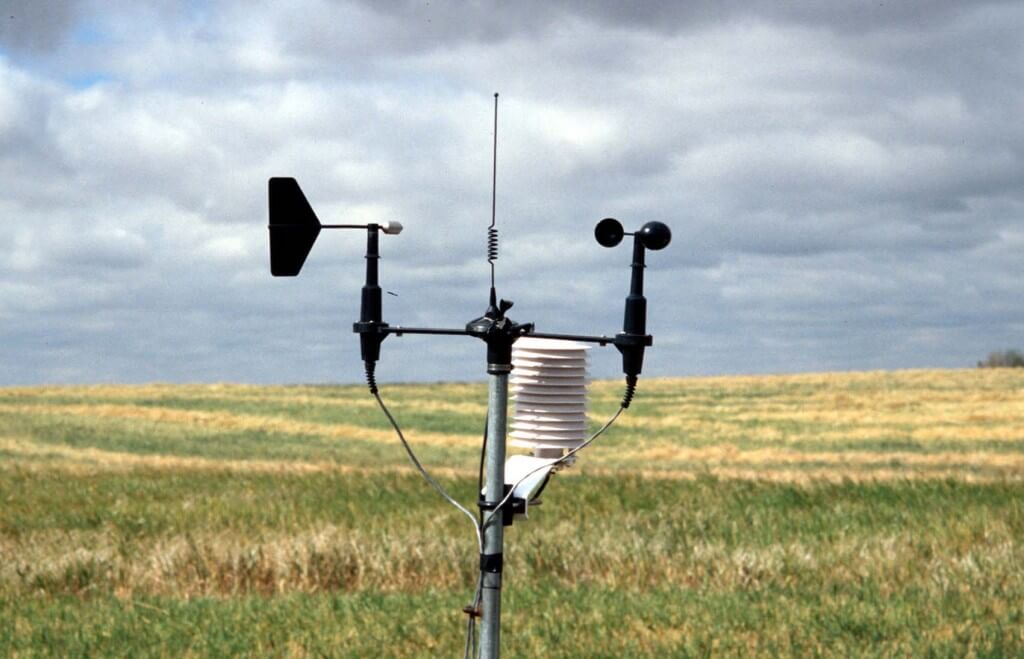
6- Record wind speed averaged over a 1 to 2 minute time span. Note the time the observation was recorded. Most instruments give an average over a period of time. Make sure the instrument’s anemometer is facing directly into the wind.
Do not record winds as variable or with a range i.e. 4 to 8 mph – an average gives a better indication of the transport energy. Light and variable winds, where directions may change several times over a short period, can be more problematic than higher speed winds in a sustained direction. Observe any label restrictions on wind speed.
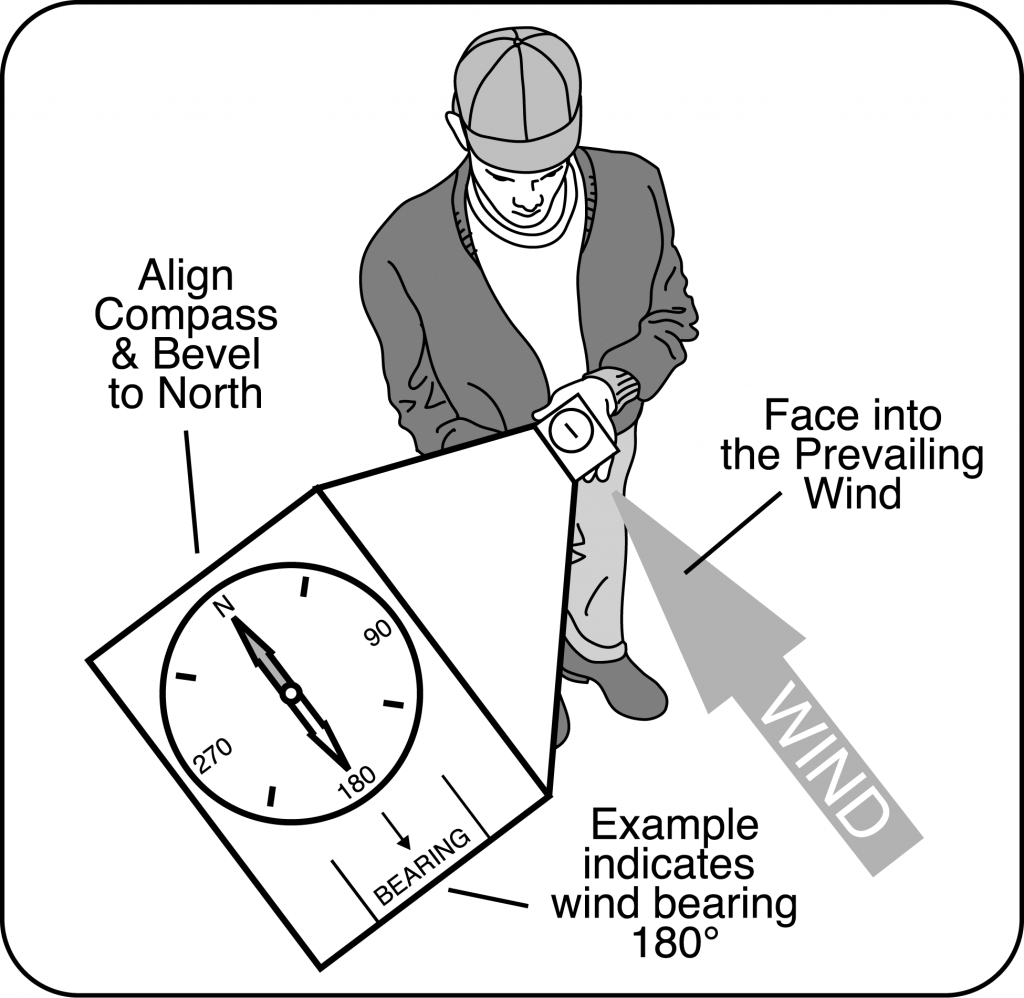
Wind direction requires a similar averaged measurement. Record direction in degrees magnetic from a compass (0-360°). The use of alphabetic characters, i.e., N, S, NW, to indicate wind direction is discouraged. The key for determining direction is to have an accurate assessment method: trees moving, dust, smoke, a ribbon on a short stake, etc. Face directly into the wind and record the direction from which the wind is coming. A ribbon on a stake with the ribbon blowing directly at your body is a simple fail safe approach. Movement of smoke, particularly from moving aircraft, or dust may help determine direction.
7- Record temperature and humidity since they can be helpful in determining temperature inversion potential. It may be advisable to record both temperature and humidity well before and after the application for this purpose. In fact, recording a morning low and an afternoon high would be useful regarding determining the potential for an inversion. Take temperature measurements with the instrument out of direct sunlight. Shade the instrument with your body or spray equipment. This is especially critical if you are trying to assess temperature differentials for determining if an inversion is in place.
8- Be alert to field level temperature inversion conditions which typically occur from late afternoon, can be sustained through the night, and into the next morning. Beware, inversions can start mid-afternoon. Observe conditions such as the presence of ground fog, smoke layers hanging parallel to the ground, dust hanging over the field/gravel road, heavy dew, frost, or intense odors (i.e., smells from manure or stagnant water from ponds are held close to the surface when inversion conditions exist). Inversions commonly occur with low (less than 3 mph) to no wind speeds. Spraying in calm air is not advised. If a mechanical smoker is used note wind direction and smoke dissipation with a time stamp.
9- Note any variances due to terrain or vegetation differences, tree lines, buildings, etc.
10- Initial or sign all recordings to indicate who made the observation(s).
This article was written by Tom Wolf for “PEI Potato News Magazine”, a publication of the Prince Edward Island Potato Board (http://peipotato.org/). It is reprinted with permission.
PEI Potato News Magazine
“Should I be using low-drift nozzles?” It seems like a simple question with an obvious answer. We all want to reduce spray drift, and this easy-to-use technology is the fastest way to get there.
And yet, the question is more complicated than it first appears. Yes, all applicators want to reduce drift, but many worry about the coarse sprays produced by low-drift nozzles. As a spray volume is divided into coarser (i.e. larger) droplets, there are fewer of them, and that can reduce coverage. It’s a legitimate concern.
Let’s start with our shared value first – the desire to reduce spray drift.
Given the economic, environmental and health impacts of spray drift, the importance is hard to over-state. That’s why spray drift management is a primary concern of our federal regulators whose job is to protect the public interest. It’s also a concern for the neighbours who have a right to keep unwanted products off their property, whether it’s residential or agricultural.
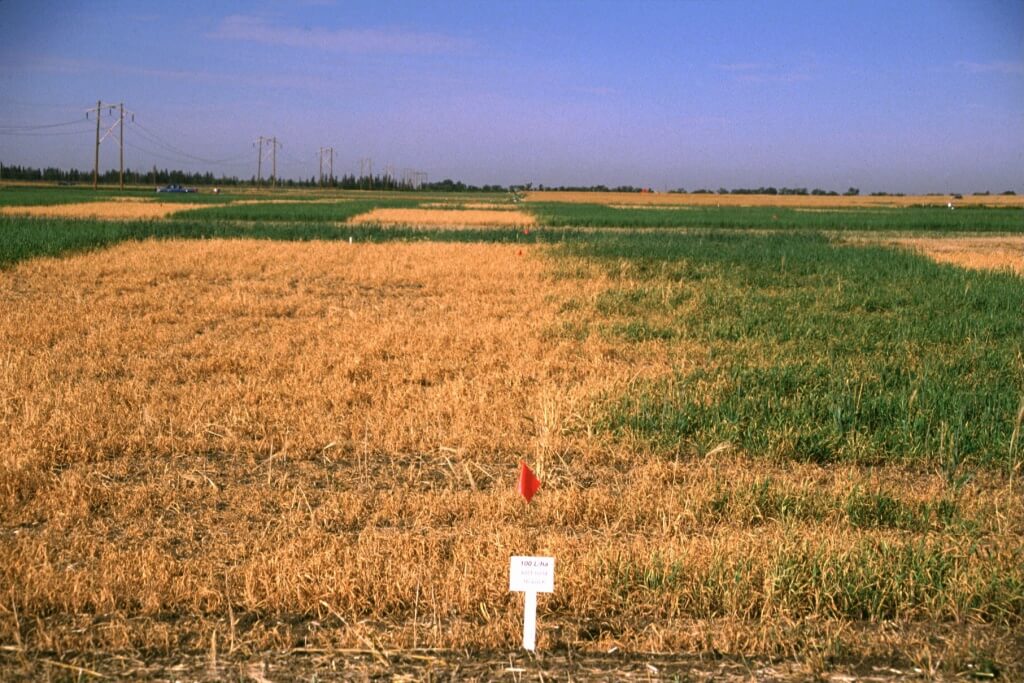
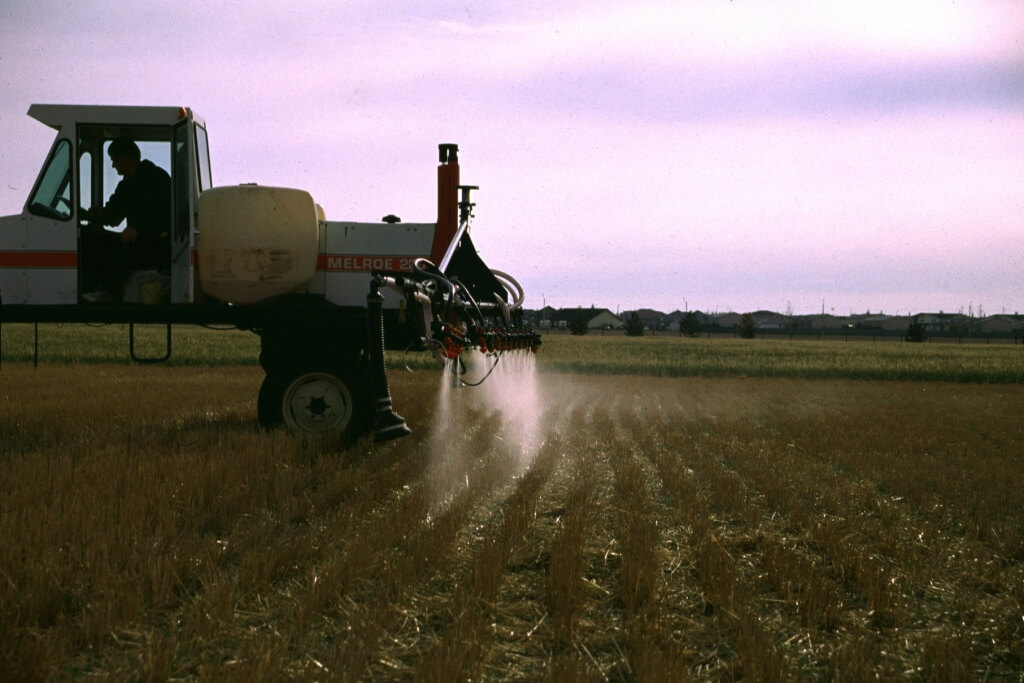
Conventional flat fan nozzles (XR8004) operating at 40 psi
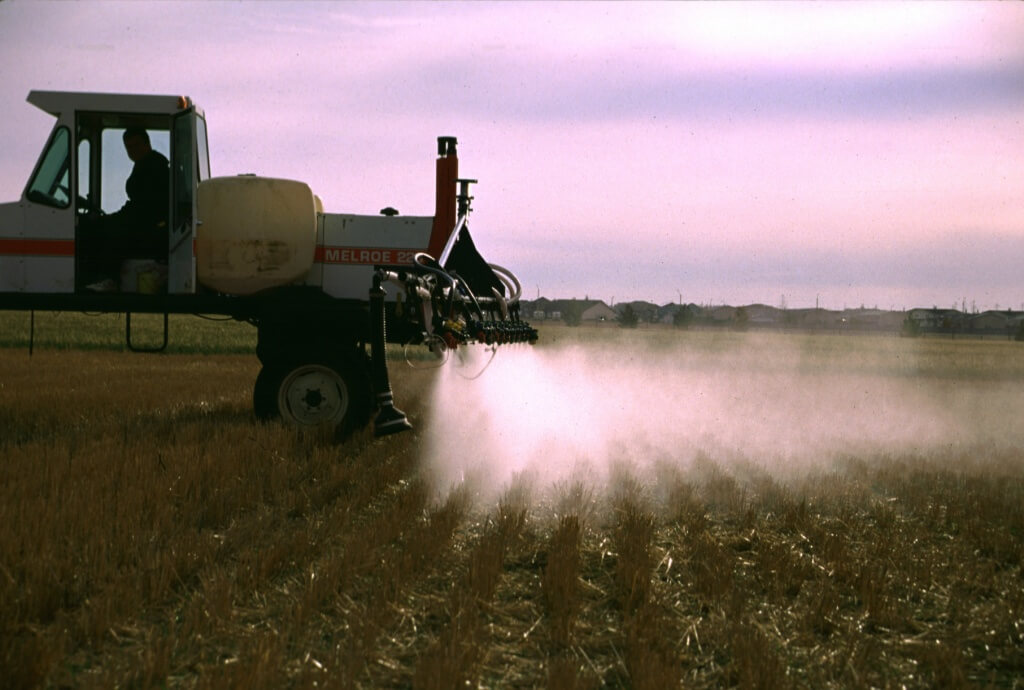
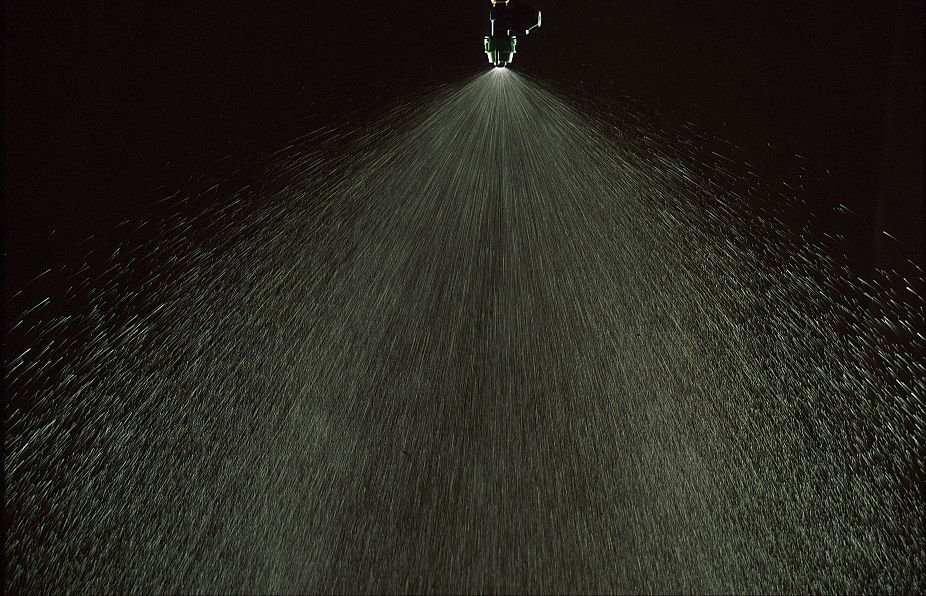
Glyphosate drift with 20 km/h side wind, XR8004 40 psi
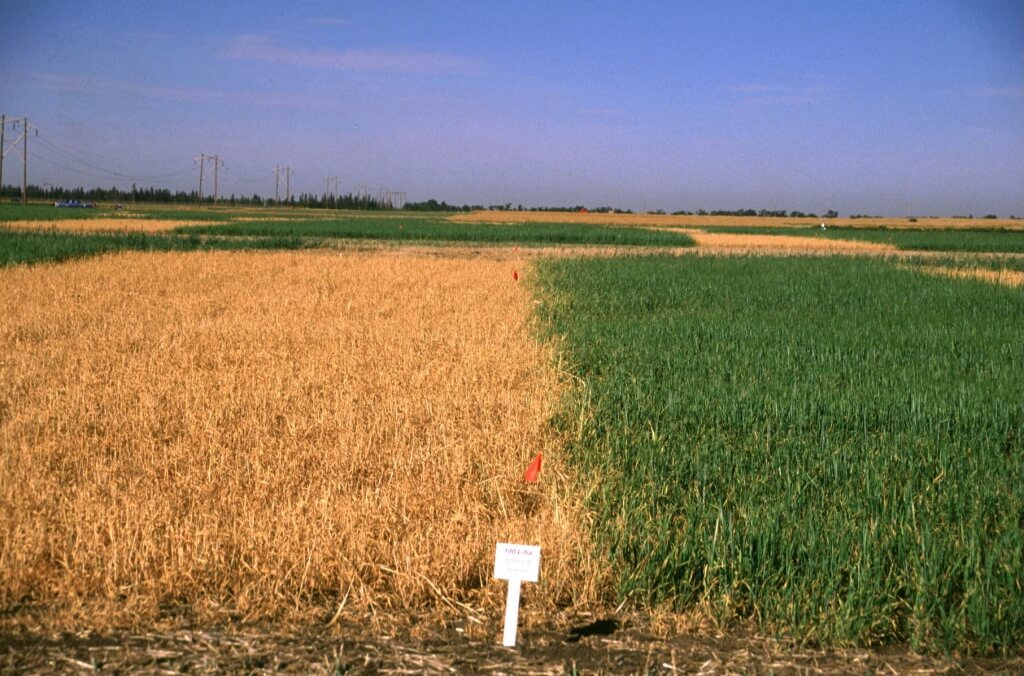
Low-drift nozzles (TD11004) operating at 60 psi
Glyphosate drift with 20 km/h side wind, TD11004 60 psi
For these reason, managing drift should be a foremost concern for applicators. The technology is vital to the crop production industry, and if we don’t take care of the issue, someone else will take care of it for us. That’s not the best path.
Of these, the most economical and practical is using coarser sprays via low-drift nozzles. Engineered to emit fewer fine droplets, they are proven to reduce drift by anywhere from 50 to 95% compared to a standard flat fan of the same size. When it comes to reducing drift, they work.
When these tips first hit the mainstream as “pre-orifice” nozzles in the late 1980s, and later as “venturi” nozzles in the mid 1990s, we were impressed with their ability to reduce drift. And the obvious question was, what about product efficacy? Can fewer, larger droplets do the job? The answer, to our initial surprise, was yes.
In the late 1990s, the crop protection industry (including governments, universities, and the private sector), participated in studies throughout Europe, Australasia, and North America looking at low-drift spray performance. In Canada alone, we conducted over 100 studies and concluded that pesticide efficacy was not harmed when a properly adjusted low-drift nozzle was used. A surprising result showed that fungicides did not seem to need finer sprays, contrary to popular opinion, as long as water volumes were sufficient to provide adequate coverage.
As we did more and more studies, it became apparent which points were critical:
When using venturi nozzles, spray pressure had to be increased from the industry standard of 40 psi to about 70 psi. This is because of a venturi nozzle’s two-stage design. The high pressure compensated for an internal pressure drop inside the nozzle. Sprays remained low-drift, but patterns and overall efficacy were better at this higher pressure.
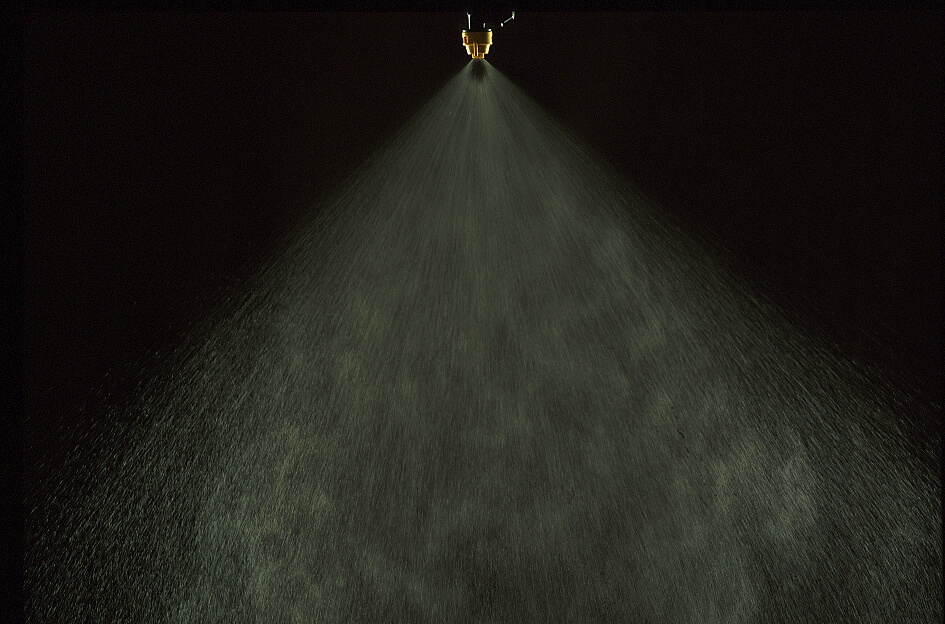
Spray pattern of conventional spray (XR8002, 40 psi)
Spray pattern of low-drift spray (ULD12002, 60 psi)
Spray deposit of conventional spray (XR8002, 40 psi. ~10 gpa)
Spray deposit of low-drift spray (ULD12002, 60 psi, ~10 gpa)
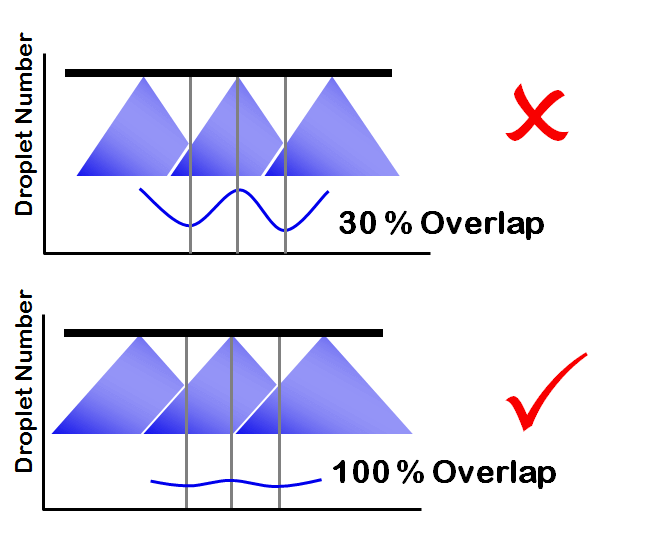
Spray pattern overlap needed to be greater with low-drift sprays – a full 100%. In other words, the edge of one nozzle’s spray pattern should reach the middle of the adjacent nozzles’ patterns. The pattern width at target height was now twice the nozzle spacing and this ensured good distribution of not only the spray volume, but droplet numbers, along the boom.
We needed to pay attention to the target plant architecture and leaf surface properties. Plants such as grasses (with vertical surfaces and difficult-to-wet leaves) often had less spray retention with coarser sprays. Low-drift nozzles worked, but we couldn’t go as coarse in these cases. Careful selection of low-drift nozzles as well as more attention paid to operating pressure solved these issues.
Our minimum water volumes had to increase slightly to compensate for the fewer drops produced by low-drift sprays. This was especially true for contact modes of action where too few droplets-per-area reduced performance. Using an Extremely Coarse spray at a very low water volume was asking for trouble.
Much of my efforts in recent years have been to advise applicators just how coarse they can safely go without harming product performance. This involves things we’ve touched on in this article, like water volumes, modes of action in the tank mix, target plant or canopy architecture, growing conditions, and the like. We’ve arrived at a few rules of thumb, like those above, but as always, it’s dangerous to oversimplify and there are always new situations to grapple with.
While we were learning how to tweak low drift nozzles to get them to perform, we also learned there were significant advantages to using coarser spray qualities.
Foremost, there was an immediate reduction in drift. One applicator told me years ago that switching to a low-drift spray removed a huge burden of worry from him, and that alone was worth it.
Low-drift sprays made it easier to spray on-time, even if weather conditions were marginal for conventional sprays. The result: the timely removal of weeds, or the correct staging of fungicides and insecticides. This has paid large dividends in terms of protected yield.
Coarser sprays can protect product performance from some adverse conditions, such as days with high evaporation rates. On such days, fine sprays evaporate to dryness so quickly that uptake can be limited. Larger drops stay liquid longer, with more uptake the result.
Directed sprays, be they banded sprays or twin fan nozzles for fungicides, make more sense from coarser nozzles. The reason is that these coarser sprays go where they’re pointed, whereas fine sprays lose their path in wind or through travel-induced deflection, very quickly.
We also learned about the air-entrainment that coarser sprays can produce. Large droplets dragged air with them, and smaller droplets could hitch a ride in their wake. This provided a form of air-assistance that reduced drift and carried small droplets into the canopy. Finer sprays had a harder time producing this type of drag, and sustaining it in the canopy.
When we analyzed the droplet size spectrum of coarse and fine sprays, we confirmed that the total number of droplets produced by any given volume of water had been reduced. Not a surprise. But two things struck us.
First, even though the average size of droplets in coarse sprays were very large, they still contained a population of small droplets. In fact, if you counted every single droplet in the spray, the vast majority were small and they were still taking care of coverage.
Second, the critical amount of coverage (measured as the percent of the surface area covered by spray deposits) that was necessary for a given product to work was lower than what we’d been aiming for. In other words, we didn’t need as much coverage as we thought we did, and any excess didn’t actually add to product performance in most cases.
We later analyzed the relationship between spray coverage and herbicide performance and found that the uniformity of the deposits was actually more important than the amount of coverage per se. So, if we focussed on proper overlap and spray pressure there was greater benefit than increased coverage alone. Deposit uniformity has become our research focus of late.
So, should you be using low-drift nozzles? By adopting the changes in pressure, overlap, and water volume outlined above, and paying more attention to the plant architecture and pesticide mode of action, we’ve been very successful in implementing low-drift sprays in all field crops. In my view, we can safely retire Fine sprays for all field crop pesticides. This means conventional flat fan nozzles, hollow cone nozzles, and the like. Get rid of them. All they do is add drift potential.
It’s safe to adopt low-drift sprays. Research and experience from the field prove that they work. Low-drift sprays should be viewed as an agronomic tool that improves application timing and accuracy. And with less drift, we show that agricultural practice can be both efficient and environmentally responsible. That’s going to be a very important story to tell, now and in the future.