Category: General Operation

All general hort articles on sprayer operation.

  • How Much Horsepower do I Need?

    How Much Horsepower do I Need?

    How much horsepower (HP) do you need (really) when pairing a tractor and a towed sprayer or any other PTO powered implement? This important question should be asked BEFORE purchasing any towed implement. Surprisingly, there’s not much guidance out there, so you might hear answers like:

    1. Whatever my tractor has must be enough… whatever that happens to be.
    2. What?
    3. The right amount of HP is what I can afford. Erma, grab that milk can full of egg money… 
    4. MOAR! (Yes, we know how “more” is spelled, but memes are funny).
    Skeletor knows horsepower

    Rating Tractor Horsepower

    If you thought there was only one way to rate the horsepower of a tractor, well, you’d be wrong. At its simplest, horsepower is:

    (torque × engine revolutions) ÷ a constant

    We’ll expand on this later. The rub comes in how you define each of these factors and where you measure the power. Let’s start with something simple like engine speed, which is expressed in Revolutions Per Minute or RPM’s.

    Engine Speed

    So, if horsepower is the result of torque times engine speed, what speed do the manufacturers plug into the formula? One of two values are used:

    1. Power Take-Off (PTO) Engine Speed

    This is the engine RPM’s that produce the rated operating speed on the PTO. When the PTO is engaged, the engine is directly and mechanically connected to the PTO shaft. Therefore, maintaining the engine at the rated PTO speed, typically between 1,500 and  2,300 RPM depending on if it’s gas, diesel, turbocharged or not, will keep the PTO spinning at a uniform 540 or 1,000 RPM (the two typical PTO speeds) regardless of the driving speed.

    2. Maximum Engine Speed. 

    This is the engine’s maximum intermittent operating speed… just shy of destroying said engine. An engine rated using the maximum speed gives you a false sense of security, because to get that horsepower you’ll be burning a ton of diesel, over-speeding your PTO implement, and wearing your tractor out very, very quickly. You wouldn’t drive your car around town in low gear because you’d redline the engine. Why would you do it to your tractor?

    In the speedometer/tachometer (above the steering wheel) on this beautiful old tractor, the first black bar is the PTO rated RPM. The second is PTO Max. Operating with the PTO engaged above PTO Max can be damaging to the implement and to the tractor, and dangerous for the operator.

    Horsepower Basics

    OK, now we are ready to dig in a little deeper into defining tractor horsepower. What does it mean if, for example, your tractor is rated at 65 HP? We’ll skip the history lesson on watching the output of horses over an average day and move to the modern definition. Horsepower from a rotating shaft (such as the output of an engine) is:

    Horsepower = [Torque in foot-pounds × Engine speed in Revolutions Per Minute (RPM)] ÷ 5,252

    Here is a typical tractor torque curve. Notice how after peak torque, RPM’s climb quickly but net HP doesn’t. Unless specified, we can assume this is Engine Horsepower, not PTO Horsepower. If the above Torque/HP curves were your tractor, the PTO speed would likely be 1,500-1,600 RPM. According to the graph that would equate to about 82 HP. Running the engine up by 40% (2,100 RPM which is the max speed in this case, gets you about 98 horsepower. That’s only a 20% improvement. Remember, this is engine horsepower, not PTO horsepower, so this may not all be available for you to use. Image from JD.

    Total Versus PTO Horsepower

    Perhaps our tractor’s 65 HP rating describes Engine Peak Horsepower. This is what the engine would produce on a test stand, and it likely uses the maximum engine speed. This rating is a bit disingenuous. Not only because you will probably operate it at rated PTO engine speed, but also because some power is lost to internal processes, like the power steering pump, automatic transmission pump, alternator, auxiliary hydraulics, et cetera. So peak engine horsepower isn’t usually a very useful number unless you are in marketing and like big numbers.

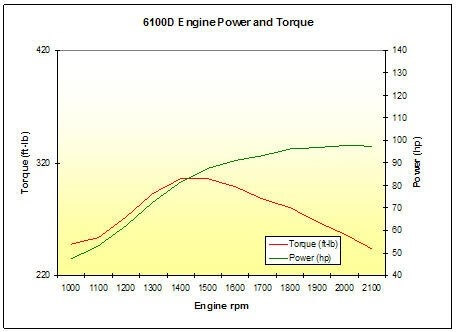
    A more accurate and useful rating is the Power Take-Off (PTO) Horsepower. This is the amount of horsepower available to do work at the PTO shaft. This may be at the rated PTO engine speed or the PTO Maximum speed. Estimating power using either speed offers a much more realistic rating of what you have to work with. As previously noted, PTO Rated Speed is usually near the speed where the engine creates the highest torque per revolution. This is often called the Power Band. Operation in this engine speed range will use the least diesel and result in the greatest amount of life in the machine. 

    Another important thing about PTO Horsepower is that this is the total amount of power available to do work. This could all go to PTO when the tractor is standing still, but both locomotion and the horsepower required to run the implement need to be subtracted from this number. So if your tractor is indeed 65 PTO horsepower, that’s the actual amount of horsepower you likely have to work with in real life. 

    In this excerpt from a Kubota Spec sheet, you see that the Rated Engine horsepower is quite a bit higher than the PTO horsepower. A 72 HP “rated” tractor really has 61 horsepower for you to work with. The 106 horsepower version on the right really has 91 PTO horsepower.

    The Horsepower that Matters

    To sum things up, PTO Horsepower is the number you really need to care about. All this up to now just to describe the nuances of how horsepower is expressed. No wonder HP is a topic that’s avoided. If you can find or download the manual, now you at least have the tools to get to how much horsepower you have to work with.

    Maximum Load

    In order to answer the question of how much HP you need, you must consider your operation. You need to size your tractor for the biggest load it will ever be used for, even if you only do that thing once a year. Typically this would be a sprayer, rotavator or a brush flail. The rest of the year you won’t burn much extra diesel if you aren’t using the power in a bigger tractor, but you can’t draw on horsepower that isn’t there in a smaller one. 

    Though it’s not common, you can have too big a tractor.  You need only watch “Clarkson’s Farm” for ample evidence (and a chuckle).

    The enormous and infamous Lamborghini tractor that starred in “Clarkson’s Farm” on Amazon Prime is a good example of taking horsepower a little too far.

    The Basics of Estimating Load

    Now that you have the extremes in mind, let’s get to scratchin’. There are three things you must know to determine the maximum load: 

    1. Locomotion – The power needed to move the tractor and implement
    2. Implement Power – The power needed to operate the implement
    3. Safety Factor – This is a buffer that gives us a little extra just in case.

    For the following guesstimates let’s assume you are doing orchard and vineyard work with a compact/narrow tractor. There really aren’t any hard and fast equations for this, but these will get you in the ballpark. If you are a nut grower with full sized tractors or a vegetable/field crop grower, you may need to scale up. 

    Locomotion

    People discount it, but the power required just to move the tractor and the implement around is substantial. If the implement is a fixed tower sprayer with a 500 gallon tank, this might require 15-20 HP on flat, dry land. If your topography includes hills, or your terrain includes mud or tall grass, you may need to double that requirement. 45 HP just to move around before you even engage the PTO. Speed matters, too; If you are driving 5 mph, you’ll need twice the HP versus driving 2.5 mph.

    C’mon Tom! Faster! Redline those RPM’s! Image from www.pigtailpals.com

    Implement Power

    The manufacturer of the implement should be able to tell you how much horsepower the implement requires. Small, three-point hitch airblast sprayers may only require 10-15 PTO HP. Larger tower sprayers may require 40-50 PTO HP. Brush flails may take 25-45 HP.

    This is where things can get sticky and you need to make sure you’re both talking the same language. Some manufacturers will tell you how much power the implement takes, others will skip all the steps in this article and go right to recommending the size tractor they think you’ll need. If you’re unsure, ask. Be sure to factor in the locomotion requirements discussed earlier, the dealer may not understand your conditions in their general recommendation but usually can provide some clarity with a little more information from you.

    Safety Factor

    It’s always a bad idea to run at 100% of your power capability. Most of you reading this article are likely working with mid-life or older tractors with a few thousand hours on them. Ol’ Bessie loses some of the pep in her step over time. After engine break-in, the tractor will slowly lose power capability over its life. The harder you work it, the faster this occurs. Enthalpy happens (now that’s a great tee-shirt idea).  Plan for it. Once you have an idea of your worst-case locomotion and implement power needs, add them up and give yourself another 15% (That is, multiply by 1.15).

    Summing It Up

    Now we can finally answer the question. In order to determine how much tractor horsepower you need, follow these steps:

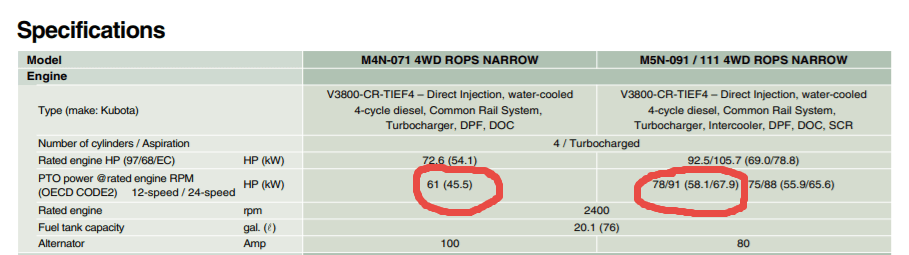
    1. Understand the real PTO horsepower of the tractor you are considering. This is the only thing that matters. You should be able to find online documentation for this if it doesn’t come with the tractor or you’ve filed it somewhere that you’ll never forget…
    2. Establish the maximum load you are likely to encounter. Calculate this by multiplying the sum of Locomotion and Implement Power requirements by a 1.15 Safety Factor.
    3. If you are still unsure, discuss these factors with your trusted local tractor dealer, ensuring you are both speaking the same language. It is better to err on too much tractor than not enough, but do so within reason.

    Looking at our original orchard application with a 500 gallon tank and a larger tower type sprayer, travelling around 3 mph:

    35 HP for locomotion, 40 HP to run the sprayer and 15% safety puts us at 35 + 40 + [0.15 × (35+40)] = 86.25 PTO HP

    Wishing you all MOAR POWER and perfect spraying weather.

  • Greenhouse Foggers

    Greenhouse Foggers

    Greenhouse application equipment spans from the humble squirt bottle, to gas-powered foggers, to robots equipped with hydraulic vertical booms. The variety of spray equipment available reflects a variety of needs, just as a carpenter’s toolbox contains different tools designed to do different things. In order to get the most out of foggers and misters, it’s important to understand how they differ from “conventional” hydraulic spraying.

    A greenhouse robotic vertical boom sprayer.
    A greenhouse robotic vertical boom or “tree” sprayer

    Mechanical and Chemical Spread

    For many greenhouses, water is the carrier that dilutes and delivers the chemistry to the target. Water has a high surface tension and tends to bead on target surfaces. Dr. Heping Zhu (USDA, Ohio) created some amazing videos using controlled water droplets and both waxy and hairy leaves. In first video we see how water beads up on a waxy leaf, and as it evaporates, the area touching the leaf surface remains small. In the second, we see the droplet get hung up on a trichome (leaf hair) and evaporate while suspended above the leaf surface.

    Neither situation is desirable since the goal of spraying is to maximize the level of contact between droplet and target. Contact can be increased via mechanical spread or chemical spread (see figure below).

    The degree of chemical spread can be increased by adding adjuvants such as non-ionic surfactants to reduce surface tension. In the videos below we see the same controlled droplets with the same volume of liquid, but they now include a non-ionic surfactant. In the first video we see a greater degree of contact with the waxy target surface as the droplet spreads. In the second, the droplet does not get caught by the trichome, but splashes down onto the surface. Some product labels advise the inclusion of adjuvants and others are already formulated with them. In the case of surfactants, be aware of the potential for run-off and phytotoxicity.

    Mechanical spread requires us to break a single, larger droplet into several smaller volumes to increase the degree of contact. This approach usually comes with a caveat about evaporation, but this is rarely a concern in a humid greenhouse. As for the risk of drift, once again, in greenhouses it is a different story than conventional spraying. Spray drift is desirable! Lateral air movement is very important to encourage plant canopy penetration and prevent droplets from merely settling on upward-facing plant surfaces. While some equipment generates its own air, the air currents in the greenhouse are often the primary means for suspended droplets to circulate throughout the space. In either case, air could be considered the carrier instead of water. Too little air flow, or gaps in circulation, will reduce coverage. Too much air flow (specifically, greenhouse air circulation) may cause plants to exhibit stunting.

    Spray Quality (ISO)

    Here’s how ISO/DIS (5681:2019 Equipment for crop protection — Vocabulary 3.2.1) defines the spray quality produced by misters and foggers:

    • (3.2.1.13) MIST: “Spray with volume median diameter between 50 µm and 100 µm.”
    • (3.2.1.14) FOG: “Aerosol spray with volume median diameter under 50 µm where the droplets are effectively suspended in air with little or no settling by gravity.”

    These droplets do not behave like coarser droplets. For more information on droplet movement, survivability, and transfer efficiency, download Purdue Extension’s “Adjuvants and the Power of the Spray Droplet”.

    Water sensitive paper has limited utility when diagnosing coverage from foggers. Sophisticated optical scanners may be able to detect deposits as small as 25 µm, but this is open to debate. Manufacturers do not support the use of papers when quantifying deposits less than 50 µm , and some draw the line at 100 µm.

    In the following image, papers were used to diagnose coverage (from clean water) in a poinsettia greenhouse. The two papers on the right were located in the canopy and sprayed using a thermal pulse fogger and a hardware store style hand pump. The paper on the left was held directly in the path of the fogger while using the smallest nozzle provided with the unit. The spray enveloped the paper (and the person holding it). Close inspection showed tiny deposits, and the SnapCard app detected 4.5% coverage, but this greatly underestimates the actual deposition and does not account for the droplet count.

    UV dyes are the preferred method for analyzing coverage from foggers.

    Fogging and Misting Equipment

    Greenhouse spray equipment can be classified by droplet size, but also by the spray volume they employ.

    High Volume (HV)

    These applications are performed at pressures ranging from 500 to 4,285 kPa (75 to 700 psi) employing flow rates of 3.9 to 5.7 L/min (1 to 1.5 US g/min). They use standard label rates to accomplish a dilute application by broadcasting droplets larger than 100 microns. The goal is to cover all surfaces without incurring run-off. Examples of HV application equipment include backpack sprayers, trailed sprayers and boom sprayers. Practice and self-calibration are necessary to achieve the desired results when using manual HV sprayers.

    Targeted Low Volume (LV)

    These applications are performed at high pressures around 20,685 kPa (3,000 psi) employing flow rates approaching 1 L/min (0.26 US g/min), covering 93 m2 (1,000 ft2). They apply reduced rates over a given area and create droplets between 25 and 100 µm. These are concentrated sprays that do not result in wet foliage. LV applications are particularly good in high-humidity environments, when it is desirable to minimize the moisture on leaves. Examples of LV application equipment include aerosol cans.

    Ultra-Low Volume (ULV)

    These applications employ flow rates approaching 2 L/min (0.52 US g/min), covering 930 m2 (10,000 ft2). They require concentrated solutions, but apply reduced rates per area using droplets less than 25 µm. ULV applications will not raise greenhouse humidity and are a good choice when days are short and nights are long. They are also an excellent way to apply disinfectants for complete space sanitation before starting a new crop. It is important to ensure vents are closed and fans are off during sanitation. Examples of ULV application equipment include total release cans, auto foggers and thermal pulse foggers.

    PulsFOG hand-held ULV cold fogger

    Thermal pulse foggers are unlike other ULV equipment and warrant special consideration. The design of the pulse fogger has remained virtually unchanged since the 1940’s. Smaller, 24 hp machines are used in smaller operations but range up to large 175 hp machines. Tank size ranges from 10 to 50 L, where 10 L should be enough to cover 4,645 m2 (50,000 ft2) in about 10 minutes, depending on crop density. Their range is about 35 m (115 ft) from the point of release.

    Thermal Pulse foggers do not create aerosol using air shear – they use combustion (80 to 100 explosions per second) to shatter spray into a fog and propel it via positive pressure. Heat is a by-product of the engine, making it an unsuitable method for applying biological products.

    However, water-cooled foggers such as Dramm’s Bio Pulse Fogger reduce the exhaust temperature below 100 °C to make the application bio-rational. This has the added advantage of making droplet sizes more consistent and preventing spray from evaporating too quickly before it diffuses to the target.

    Dramm Bio Pulse Fogger.
    Dramm Bio Pulse Fogger

    Using a Fogger

    Dramm recommends that operators use approximately 1 L of carrier in 5 L of spray mix, but a higher proportion of carrier would be required for more viscous products. Start with a full tank of clean, high grade gasoline and once the fogger has been started, run it continuously until the application is complete. Leave it running even when moving between Quonset huts (see below).

    Know when to use a pulse fogger versus an auto fogger. Auto foggers are convenient because the operator can set them and leave. However, in the case of multiple huts, it is more efficient and timely to use a thermal pulse fogger.
    Know when to use a pulse fogger versus an auto fogger. Auto foggers are convenient because the operator can set them and leave. However, in the case of multiple huts, it is more efficient and timely to use a thermal pulse fogger.

    Do not leave the manual fogger running unsupervised as an auto fogger: If they stay stationary, or aim directly at the canopy (as in hydraulic spraying), they could drench and potentially damage nearby plants.

    When fogging, aim between the plants, such as the alleys and between hanging plants. This allows the fog to expand and permeate canopies for the best coverage. When spraying is done, be sure to release the pressure created in the spray tank to prevent accidental back flow into the gasoline tank.

    And, because it’s convenient to include the math in this article, here are the formulae for calculating greenhouse volume to help you determine rates.

    Care and Maintenance

    HV, LV and ULV equipment requires model-specific cleaning and maintenance, according to manufacturer’s instructions. Even when sprayers are kept in prime condition, they are only as good as the operator’s understanding. When the wrong product is applied by the wrong machine using the wrong method, operators risk poor control, crop damage and increased potential for pesticide resistance. For more information, read the instructions that came with your sprayer, or contact the manufacturer.

    Thanks to Louis Damm and Dr. Heping Zhu for their contributions to this article.

  • Venting Liquid-Filled Pressure Gauges

    Venting Liquid-Filled Pressure Gauges

    Liquid-Filled or Dry?

    Small-plot agricultural sprayers should have a pressure gauge on the wand or boom to ensure accurate application rates. Most are added after-market and the operator has the choice of buying liquid-filled or dry gauges.

    Glycerine- or silicone-filled gauges are preferred because they dampen pressure spikes, pulsation and mechanical vibration. Compared to dry gauges, they are available in higher ranges and are less prone to moisture problems (which cause corrosion, accuracy and visibility issues).

    We use 100 psi (~7 bar) liquid-filled gauges for our handheld sprayers. Only recently did we acknowledge the sticker affixed to the glass advising the user to cut the nipple off the rubber plug located at the top. Preferring to avoid messy leaks, we have always left it intact.

    We wondered what impact, if any, this was having…

    What are Vents?

    Expensive gauges have mechanical vents that can be opened prior to use and closed to retain liquid when stored. More commonly, there is a rubber plug with a protrusion (referred to as a nipple).

    Why Vent?

    Mechanical, liquid-filled gauges are sealed to keep the liquid in. When there are temperature fluctuations, the liquid expands or contracts and creates “case pressure”. This exerts a force that interferes with the pressure reading.

    According to Marshall Instruments, case pressure can offset the accuracy by approximately 1 psi (0.07 bar) for every 35˚F (20˚C) temperature change, but is only noticeable when measuring lower pressures (0-15 psi or 0-1 bar). Nevertheless, they advise all gauges should be vented prior to use.

    The plug can be removed to allow the user to refill the gauge, maintaining an air space of about ½” at the top of the window. If the nipple is cut off, the gauge is permanently vented and will leak if the gauge is not kept vertical.

    Testing

    We performed an experiment to see if typical working temperatures had a practical impact on the accuracy of an unvented gauge. We suspended an unvented, liquid-filled gauge upright in a water bath at approximately 15˚C, 30˚C or 45˚C (59˚F, 83˚F or 113˚F) until it equilibrated. The high temperature may seem unreasonable, but gauges left in trucks on summer days get far hotter.

    The gauge was quickly removed and placed in a manometer (Ametek T-975) where it was subjected to pressures of 15, 30 and 45 psi (1 bar, 2 bar and 3.1 bar) and readings recorded. This was repeated five times. We then vented the gauge and repeated the process.

    Results

    At first, there appeared to be very little difference in average accuracy of vented and unvented gauges. Accuracy refers to the closeness of a measured value to a standard or known value. Perhaps there was some small increase in the pressure reported by an unvented gauge, but very little practical difference.

    However, when we look at variability we get a different picture. Variability is a measure of precision, which refers to the closeness of measurements to one another. The graphs show that an unvented gauge has greater variability (less precision) at lower temperatures and lower pressures.

    A good way to think of accuracy and precision is using the classic archery bulls-eye metaphor. The unvented pressure gauge is best represented by the third image, where it is accurate (on average) but not precise (variable).

    Real-World Example

    What does this mean in practice? Consider someone spraying a small plot using a TeeJet XR8002 nozzle on a CO2-powered hand boom at 30 psi. The difference in output between 30 psi and 40 psi is about 0.003 gpm / psi.

    An unvented pressure gauge used on a hot day may read 1.5 psi lower, causing you to overcompensate and raise the pressure 1.5 psi higher than intended. That would result in 0.0045 gpm (0.5%) more applied. Compensating for an unvented gauge on a colder day might be closer to 0.009 gpm (1%) more applied.

    Assuming a walking speed of 3.1 mph (5 km/h) and a swath of 20” (50 cm), the nozzle should emit about16.3 gpa at 30 psi. Unvented in the heat, that’s 16.7 gpa. At 33 psi, that’s 17.15 gpa. That’s almost 1 gpa more than intended. Potentially, the lack of precision could make a significant difference.

    Conclusion

    • Liquid-filled gauges are preferred over dry gauges.
    • To ensure precision, the gauge should be vented prior to use.
    • Permanent venting on a hand-held sprayer causes leaks, which is a nuisance, so we suggest simply lifting the edge of the plug with a screwdriver or fingernail to vent the gauge prior to each use.

    This work was performed by OMAFRA summer student, Aidan Morgan.

  • Oh the Places You’ll Spray – Parody

    Oh the Places You’ll Spray – Parody

    Enjoy our take on a Dr. Seuss work-of-art. We’re sure the fine doctor would want to end resistant pig weed’s reign of terror as much as we do. Hear us recite it in the sound bar, read it yourself, or head to the bottom of the article to see the talented Bridgette Readel (@bmreadel) read it for you. Enjoy!

    Press Play to hear the audio version of this article

    In the home farm’s west field,
    where the soybeans won’t grow,
    and the wind blows the soil from deep tillage you know,
    and no pollinators come, excepting old crows
    is the patch of resistant pigweed.

    And downhill in the boundary, some neighbours say,
    if you look close enough you can still see today,
    where herbicide persisted,
    in the places it drifted,
    from the winds that took it away.

    How did it drift?
    How did it get there?
    And why was it lifted and taken somewhere
    from the home farm’s west field where the soybeans won’t grow?
    Look to the sprayer.
    Look close, and you’ll know.

    You won’t see Coarse nozzles.
    You will see high booms
    that wobble and bounce on a sprayer that zooms
    in headwinds too high
    in the late afternoon.
    They may even spray by the light of the moon!

    Check the chemical shed.
    Crack the door, just a fraction.
    You’re likely to see
    A lone mode of action.

    “Tell me how,” says the farmer
    “I’ll do what you say.”
    “But I only have so many hours in the day
    to spray the west field where the soybeans won’t grow,
    and battle the pigweed that simply won’t go.”

    “Oh the things you can do! So much can be done!”
    “Learn to spray in light winds, in the day, in the sun!”
    “Lower booms, use more water, use droplets so Coarse.”
    “We’ve told you before…
    (you will note we are hoarse.)”

    The farmer said nothing, just gave us a glance.
    We could tell he was thinking of time, effort and cash.
    “Driving slow improves coverage,
    and you can make up the time,
    with faster fills, longer booms, and more precise A-B lines.”

    That was long, long ago.
    Let’s check in today,
    and see if the problems have withered away.

    In the home farm’s west field,
    where the soybeans now grow,
    and cover crops cling to the soil down below,
    the pollinators buzz because drift doesn’t blow.

  • Putting a Number on Pesticide Waste

    Putting a Number on Pesticide Waste

    Waste (noun): an act or instance of using or expending something to no purpose.

    In agriculture, environment and economy are intertwined. Producers strive to obtain the maximum return on their inputs. They study incremental returns and avoid applying more inputs than necessary, especially if conditions don’t warrant it.  The financial incentive is powerful, and waste is a four-letter word. This applies to seed, fertilizer, and pesticide. Pesticide labels identify the rate needed to obtain the desired result, and there is no incentive to over-apply. In fact, it’s illegal.

    But there are plenty of other places where applications incur waste. As with time efficiency, it’s a good idea to identify where this waste occurs, and the only tool needed is a sharp pencil.

    When might we incur waste in the spray application process?

    • Mixing more than we need because we don’t trust the flow meter or the tank gauge entirely, or don’t know the exact field size.
    • Priming the boom before the first swath.
    • Overlapping due to curvy terrain and coarse sectional control.
    • Spray drift away from the intended swath.

    How big are the losses?

    Let’s say we have a clean sprayer and need to spray 160 acres before moving to a new crop and product. We plan to apply 10 gallons per acre and have a 1,200 gallon tank with a 120 foot boom. That means we need 1,600 gallons of spray mix in total.

    Once we’re at the field we prime the boom. Each sprayer is different, but depending on operator experience, 30 to 50 gallons are usually needed to push product from the tank to the last nozzle. Only part of that is lost to the ground, as boom sections can be shut off as soon as product has reached every nozzle of that section. We’re assuming 0.2 gallons per foot of boom is lost.

    Spraying itself is relatively straightforward. Swath and sectional control handle the overlaps, but in less ideal terrain, double application is known to account for 4 to 5% of the area to reach non-square parts of the field. This is even more likely when the outer section is 10’ or more. Early turn-on of the boom prior to leaving the headland, to allow boom to reach operating pressure, adds to this.

    Air-activated shutoff for individual nozzles reduces section size at a reasonable cost.

    With an average nozzle, we can expect about 2% of the product to airborne drift. Most airborne won’t return to the ground within the field borders, so it’s a complete loss.

    Most of the spray that travels more than 5 m after leaving boom stays airborne and should be considered a total loss from the field.

    As we finish, the pump will draw air before the tank is empty due to sloshing or foaming, and a 50 to 60 gallon remainder may not be unusual. This simulation has assumed 5% of tank volume remains.

    We also need to purge spray from the boom at cleanout, consuming approximately 0.4 gallons per foot of boom. This occurs after the field is completely sprayed and is therefore considered waste.

    So how does this add up? The following table shows the approximate losses associated with five setups.

    Table 1: Spray mix losses during a sprayer operation. Setup 1 = baseline, Setup 2 = low application volume, Setup 3 = baseline with recirculating boom, tank level monitor, and low-drift nozzles, Setup 4 = large area between cleaning, Setup 5 = large area with recirculating boom, tank level monitor, and low-drift nozzles.

    In the first scenario, we spray just 160 acres at 10 gallons per acre. Priming the boom with 0.4 gallons per foot (allowing for all associated feed lines) consumes 48 gallons, but only wastes half of that, or 1.5% of the total volume needed for the field.

    Four percent overlap consumes another 64 gallons.

    If we have 5% of the tank volume left over, that’s 60 gallons. That amount is so small it doesn’t even register on the sight gauge but nonetheless it represents another 4% of the total sprayed amount.

    Upon cleaning the boom, we need to push the spray mix out of all the  plumbing after the pump, as it has nowhere else to go. At an assumed 0.4 gallons per foot, that’s another 48 gallons or 3%.

    If we add to that a conservative 2% drift loss, it sums to a surprising 14% of the total spray volume. For those that use lower water volumes (the second scenario), the volumetric losses are slightly less, but their proportion is higher, now accounting for 23% (!) of the total spray mix.

    In the third scenario, let’s assume we use a recirculating boom that returns the initial prime volume to the tank, eliminating any waste. We’ll also upgrade to individual nozzle sectional control, reducing overlap to 1%. And, since we want to know exactly what’s left in the tank, let’s invest in an AccuVolume system to precisely monitor tank volume. This allows us to make small rate adjustments up or down to be sure as much of the mixed product goes onto the sprayed swath as possible.

    Recirculating booms allows the spray mix to pass through entire length of boom without being sprayed, saving waste during priming and allowing waste-free boom rinses.

    When the sump begins to empty, we can introduce some water from the clean water tank to push the last of the mix to the boom (a continuous rinse system makes this easy).

    An AccuVolume sensor shows the exact volume left in the tank at any slope position and with 1 gallon resolution, allowing greater accuracy when filling and emptying.

    We’ll assume our sump waste is now reduced to 12 gallons. We still need to dispose of the content of the boom somehow, so the recirculating boom offers no saving there. But let’s also add better low-drift nozzles to reduce drift by 50% (now 1% total volume). Total loss is now just 6%.

    Low-drift nozzles such as this AirMix (Agrotop) SoftDrop reduce airborne drift by 50 to 90%.

    The last two rows in the table repeat the first and third scenarios for a larger sprayed area (1000 acres) before a tank cleaning is needed. This doesn’t change the magnitude of the volumetric loss, but reduces its proportion. Percent loss is down by a factor of two from the 160 acre interval, to 3 to 7%.

    Experienced operators might cheat the system a bit by mixing the required pesticide with some extra water to make up for the plumbing waste. Doing so prevents extra pesticide from being consumed, but it doesn’t reduce the inherent inefficiency.

    Lessons

    This exercise suggests that waste from spraying is probably higher than we assumed. If we average the scenarios, there is 10 to 15% waste. At, say, $200,000 spent on pesticide for a single spraying season, that’s $20 – $30,000 worth of product and water hauled that ends up where it doesn’t belong. Beyond the time and money, there can also be environmental consequences depending on how that waste is treated.

    There are some things that can be done.

    • Know the exact area of the field to be sprayed.
    • Study your sprayer plumbing and consider improvements such as recirculating booms and continuous cleanout.
    • Improve monitoring of tank content to allow lower remainders.
    • Consider individual nozzle shutoff to improve sectional control. These are part of Pulse Width Modulation (PWM) systems, but can also be achieved with less expensive valves.
    • Plan spray operations to minimize the amount of product changeovers.
    • Consider direct injection.

    The return on investment for plumbing improvements can be high and result in considerable future savings over the life of the sprayer. It’s worth thinking about.