Tag: canopy

  • RPAS Swathing in Broad Acre Crop Canopies

    RPAS Swathing in Broad Acre Crop Canopies

    This work was performed with contributions from Adrian Rivard (Drone Spray Canada) and Adam Pfeffer (Bayer Crop Science – funding partner). Dr. Tom Wolf is gratefully acknowledged for his editorial support and assistance interpreting the results.

    Introduction

    This research is part of a continuing effort to identify best practices for broad acre crop protection using remote piloted aerial systems (RPAS). Previous work in wheat, corn and soybean has provided insight into how RPAS operational settings and environmental factors affect drift potential, effective swath width and spray coverage. This information, paired with advancements in RPAS design, has helped operators to improve spray deposit accuracy.

    However, RPAS still produce what has traditionally been considered poor (or at least sporadic) broad acre coverage. Many studies have illustrated these shortcomings using herbicides or fluorescent tracers. Contributing factors include inappropriate operational settings, low application volumes (20-50 L/ha) paired with coarser spray qualities, and inaccurate swath widths. In light of these issues, we struggle to reconcile claims of acceptable disease control, which is arguably the greatest challenge in a spray-based crop protection paradigm.

    Tar Spot

    One real-world example of intermittent disease control from aerial applications (not just RPAS) is the case of tar spot in corn. Tar spot is a fungal disease caused by Phyllachora maydis and it is becoming a significant economic concern in Ontario. Left unchecked the disease causes rapid, premature leaf senescence. This reduces photosynthetic capacity, and ultimately, yield. Depending on spray timing, crop variety, environmental stressors, and the product applied, protection should last for up to three weeks.

    In the last few years there have been several reports (both in Ontario and in corn-producing US states) of tar spot “striping” following aerial sprays. Crops seem well protected directly beneath the flight path (green and healthy), but efficacy tapers to failure towards the edges of the swath (brown and desiccated). Fundamentally, this is likely due to inadequate spray coverage caused by an overestimation of the effective swath width.

    Figure 1 Tar spot striping in Western Illinois following two applications from a fixed wing sprayer (2023).
    Figure 2 Tar spot striping from RPAS volume trials. A brown strip can be seen between two passes in each RPAS treatment of 30 and 50 L/ha. The top is an application by a 100 foot horizontal boom. Each treatment is separated by an unsprayed check. (2023).
    Figure 3 – Tar spot striping in Ontario corn following fungicide application by helicopter (2024).

    Effective Swath Width (ESW)

    The measured swath width presents the lowest variability (as indicated by the coefficient of variability, CV) while minimizing the degree of over- and under-dosing. As a matter of operational productivity, wider swaths mean wider route spacing, which is attractive because it means fewer passes and faster applications. Once the agronomics are considered, the effective swath width is that portion of the swath that gives the desired biological result. It may equal, or only be a fraction of, the measured swath width. It is plausible that inappropriate effective swath widths from aerial applications are common, but have not always been detected, because:

    • Generally, fungicides are weakly systemic and give modest yield increases from disease suppression and their “stay green” properties. Until tar spot, a sub lethal dose of fungicide did not lead to rapid and acute crop failure.
    • Most growers do not intentionally leave unsprayed checks, or the check locations do not coincide with disease presence.
    • The applied product rate is sufficiently high to cover regions of under-application.
    • Taken together, deficiencies are often too subtle for passive detection.

    This is not to suggest that pilots intentionally inflate swath widths. Swaths are evaluated during fly-in calibration sessions using established protocols (e.g., Operation S.A.F.E.), and RPAS swath evaluation has emulated these practices. Calibrations take place on bare ground or stubble/grass using two-dimensional samplers (i.e., continuous samplers like string or bond paper, or discreet samplers like water sensitive paper). However, this protocol does not account for any physical interference from the crop canopy itself. This may have negative implications, particularly given the unique nature of the RPAS swath.

    RPAS tend to produce swaths with a very narrow span and a steep profile. To a certain extent, their swath widths share a direct relationship with altitude and headwind speed, and coarser sprays result in narrower swaths (with Dr. Michael Reinke, MSU). The outer edges of the RPAS swath represent the least amount of spray volume along the width, and this coincides with the turbulent dispersion zone of the downwash. Therefore, those extremes should contain a higher proportion of low-energy droplets moving in multiple directions relative the centre of the swath.

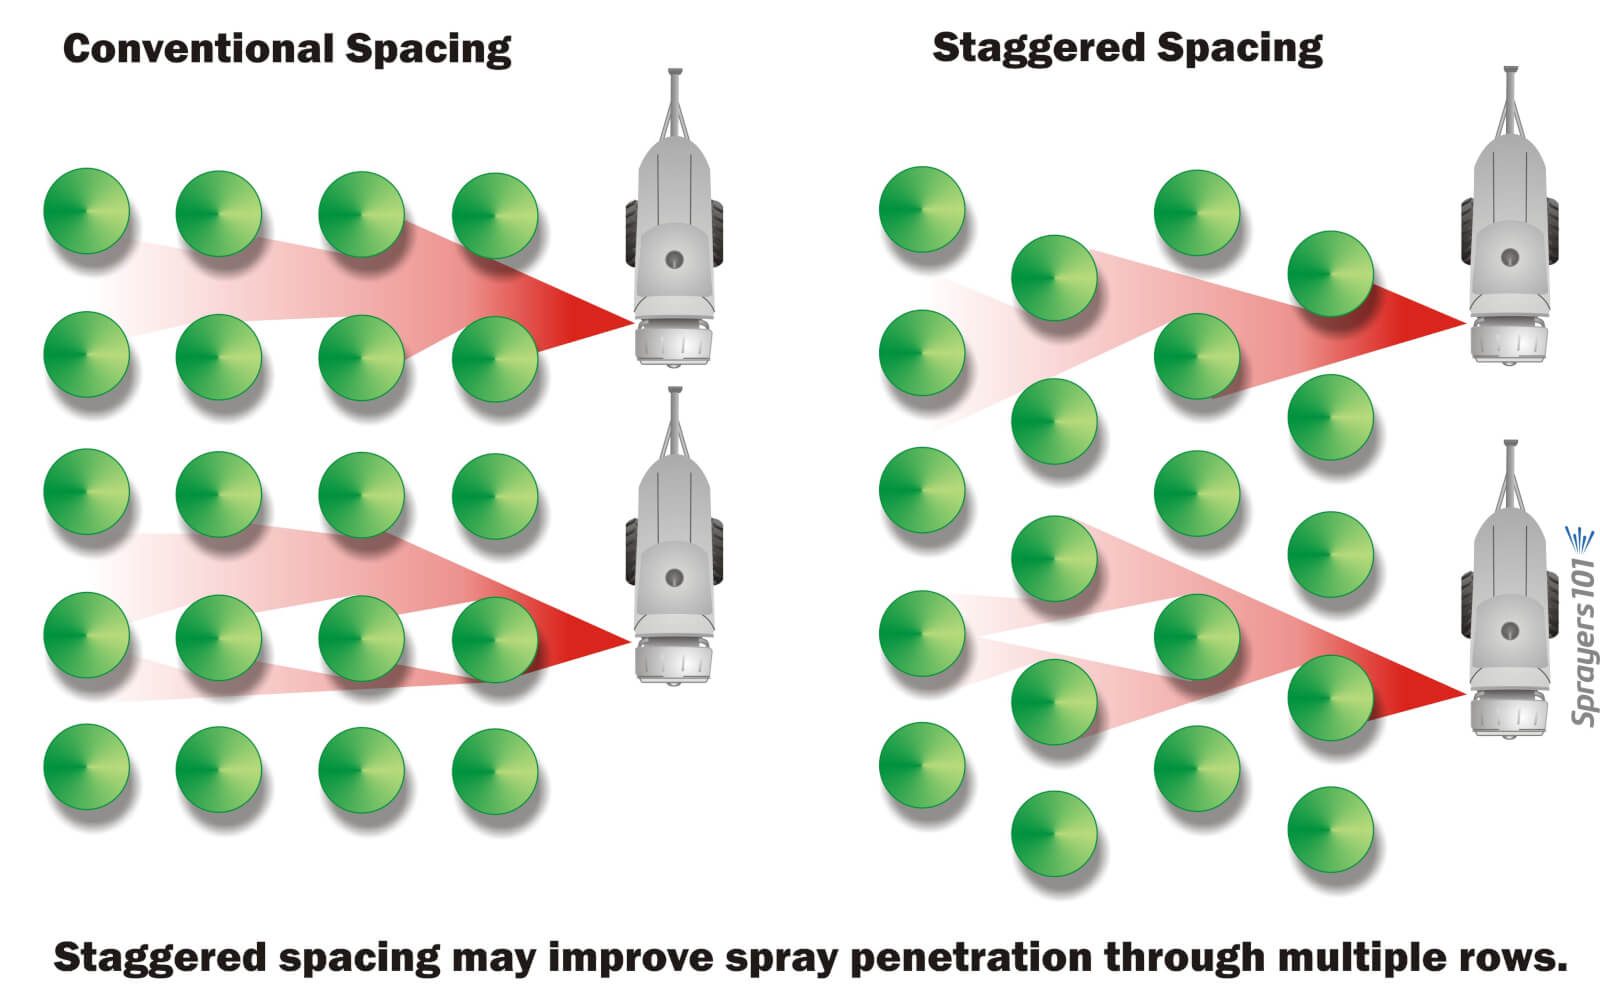
    While crop morphology and planting architecture are contributing factors (i.e. part of the agronomic use case), it is generally accepted that the degree of spray penetration falls off exponentially with canopy depth. It follows that this should also be the case for any lateral movement, resulting in a significantly shorter swath in-canopy versus on bare ground.

    Materials and Methods

    Spray Sampling

    Spray deposition was sampled using a 15.8 m (52 ft) Speed Track (Application Insight LLC) loaded with 3-inch bond paper (Staples Canada). The spray mix was 0.3% v/v FD&C Blue #1 Liquid. Bond papers were analyzed using a Swath Gobbler (2nd gen software – Application Insight LLC) at 100 mm sampling rate (i.e., ~150 discreet images per sample). Hue: 32-180. Saturation 17-60. Value: 156-255.

    The Swath Gobbler produces a complete, correlated and ordered record of the cross-section of a swath. For each discreet image, it reports the number of individual droplet stains on the sampler per area. It also reports percent area covered by measuring the total number of pixels with dye divided the total number of pixels in the image.

    The device deliberately does not calculate a Droplet Size Distribution (DSD) of the stains. This is because any DSD calculated from paper collectors relies on assumptions that cannot be validated, such as the fact that all droplets are captured and detected, spread factors are known for that application condition and similar for all stain sizes, there are no multiple hits, etc.

    RPAS

    The sprayer was a DJI T40, calibrated according to the pilot’s standard operating procedure (Drone Spray Canada). Certain operational settings varied with treatment and will be detailed later in this section.

    The flight path was perpendicular to the sampler, aligned with the centre using pin flags as references for the pilot. Spraying began approximately 20 m prior to the sampler to ensure the RPAS was at target speed and continued some 20 m past the sampler.

    Figure 4. DJI T40 approaching sampler on bare ground. Sampler was later moved into the adjacent wheat field (left).

    Defining Coverage

    Swath width will be calculated from two different coverage metrics.

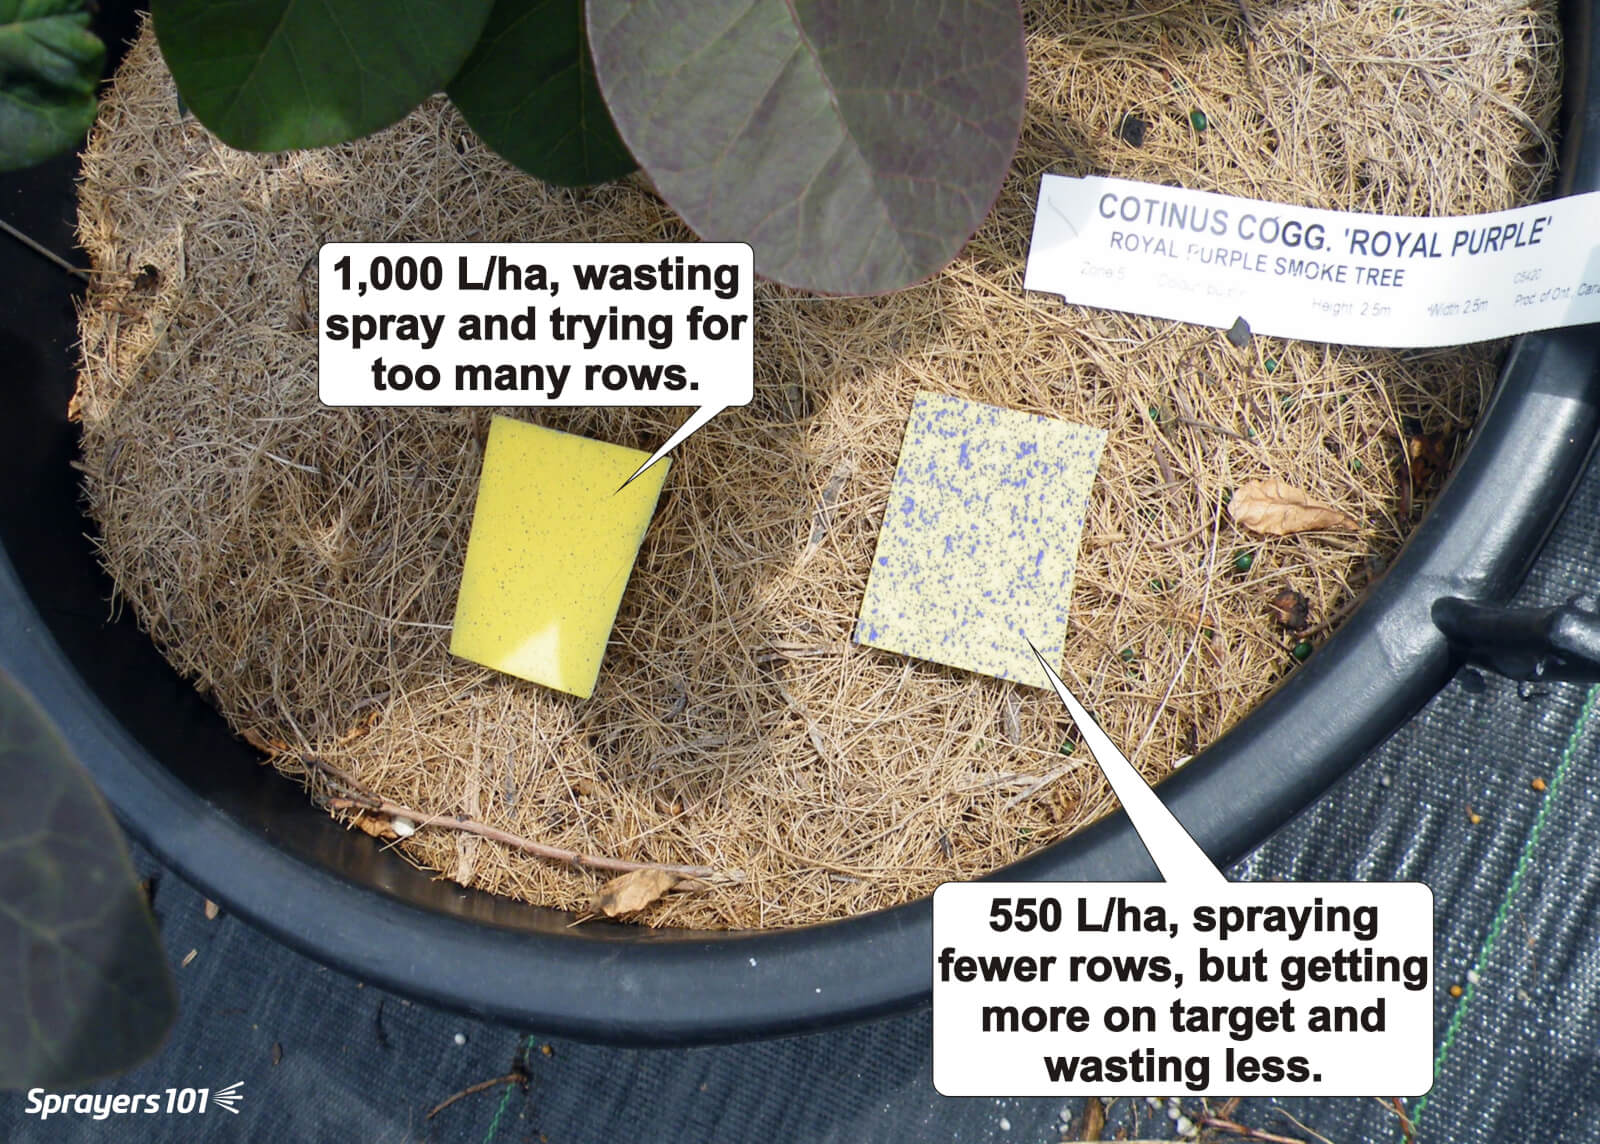
    Percent Area Covered describes the amount of surface area covered by deposit. Given the variable degree of stain diameter (a function of sampler material, spray mix, and droplet velocity) this value can only be used as a relative index (i.e., can only be compared to itself). No conclusions can be drawn about how spray interacts with plant tissue, but generally more coverage correlates to improved crop protection.

    Deposit Density describes the number of individual droplet stains on the sampler per area. Higher densities can imply more uniform distribution over the plant surface, which is particularly important for contact materials.

    Previous studies (with Dr. Tom Wolf, Agrimetrix Research and Training, data not shown) indicate a higher correlation between deposit density and swath width at lower versus higher spray volumes. Lower volumes are typically comprised of finer droplets, which are more accurately resolved using deposit counts. Swath widths determined by deposit density also tend to be longer than those determined using percent coverage, better aligning with real-world observations of efficacy.

    Wheat

    R40 wheat was planted on October 9th, 2023, at 808,000 seeds/ha (2 million seeds/ac). Wheat height at the time of the trial was 60 cm (25 in). The location was 45180 Fruit Ridge Line, St. Thomas, Ontario. Deposition trials took place on May 23rd. Wheat stubble swath testing also took place at this location on May 15th.

    The RPAS was programmed to apply 50 L/ha using a 260 µm droplet diameter according to the DJI software. Air speed was 5 m/s and the flow rate was 11-12 L/min as it passed over the sampler. Swath was programmed at 8 m.

    Coverage was evaluated for water (control) and for a spray mix containing 0.15% v/v Interlock (a drift mitigating adjuvant – Winfield United) and 0.15% v/v Interlock + 0.125% v/v Activate Plus (a spreader adjuvant – Winfield United). For bare ground, each treatment had three passes (n=3) except for water, which had four (n=4).

    The wheat canopy was only sprayed with water three times (n=3). Limited passes were made because it served as a proof of principle. Any indication of relevant differences in the swath width would justify later trials in corn and soybean. These first passes revealed issues with the experimental design that were later corrected:

    • The RPAS spray tank level was not held constant. The RPAS weight affects the intensity of the downwash. The volume dropped from 30 L to ~20 L over the course of the experiment. In future trials, a tank volume of 20 L was maintained from a premixed source.
    • The wind direction occasionally shifted from a direct headwind to a partial cross wind from the RPAS’s right. In future experiments, we waited for an optimal wind direction before starting each pass.
    • The RPAS altitude was set to 3 m above bare ground. We assumed it would climb to account for the height of the wheat, but the canopy did not register with the RPAS sensors. As a result, spray was released ~60 cm closer to the wheat heads than to the ground in bare ground swathing. In future experiments, we confirmed that the RPAS was 3 m from the top of the crop canopy.
    • Despite best efforts, moving the sampler into the wheat parted and distorted the canopy. As a result, the sampler was not as obscured as it should have been. We developed strategies to minimize canopy distortion in corn and soybean that will be described later.
    Figure 5. Top-down view of sampler in wheat canopy. Note that the canopy did not close over the sampler as intended.

    Corn

    Corn was planted on May 15th, 2024, at 13,300 seeds/ha (33,000 seeds/ac). The sampler was erected in the field on July 3 to allow the canopy to grow up and around it. Deposition trials took place on July 26 and every effort was made to leave the canopy undisturbed around the sampler. Corn measured 2.4 m (9 ft) at the tassel and 1.2 m (4 ft) at the silks. The sampler height corresponded to the ears. The location was 42°40’52.1″N 81°04’45.9″W near 5277 Quaker Road, Sparta, Ontario.

    Figure 6 Sampler erected to 4 ft. Crop grew around the sampler to minimize any canopy disturbance.
    Figure 7 Sampler position relative to ears during sampling.
    Figure 8 Installing Speed Track for swath testing in wheat stubble.

    Soybean

    Soybean was planted on June 30th, 2024, at 80,800 seeds/ha (200,000 seeds/ac) on 38 cm (15 in) centres. Deposition trials took place the morning of August 14. While the densest area was selected for the trials, the field was patchy with crop height spanning 20-25 cm (8-14 in). Each section of the Speed Track was inserted under the canopy separately to avoid disturbing or damaging the plants. The track was elevated ~10 cm off the ground. The location was at 42°46’50.4″N 81°08’20.8″W near 43900 Talbot Line, Central Elgin, Ontario.

    Figure 9 Sampler in soybean.

    Corn and Soybean Treatments

    The following treatments were repeated three times in-canopy (n=3) (Table 1). The actual flow rate (recorded as the RPAS passed over the sampler) was always ~1.5 L/min less than programmed.

    Treatment #Droplet Diameter (µm)Programmed Swath (m)Volume (L/ha)Rate (L/min)Flight Speed (m/s)Spray Mix
    1320102010.510water
    232083010.58.3water
    332085010.55water
    43208305.75water
    550085010.55water
    63208505.750.5% Masterlock
    732083010.58.30.5% Masterlock
    Table 1 RPAS operational settings for corn and soybean treatments

    The following treatments were repeated three times on wheat stubble (n=3) (Table 2). Once again, the actual flow rate (recorded as the RPAS passed over the sampler) was always ~1.5 L/min less than programmed.

    Treatment #Droplet Diameter (µm)Programmed Swath (m)Volume (L/ha)Rate (L/min)Flight Speed (m/s)Spray Mix
    1320102010.510water
    232083010.58.3water
    332085010.55water
    43208305.75water
    Table 2 RPAS operational settings for wheat stubble treatments

    Weather Data

    The RPAS flight path was into the prevailing wind, but minor variations occurred throughout sampling. Weather was recorded as the RPAS passed over the sampler using a Kestrel 3550AG weather meter in a vane mount positioned on a tripod 2 m above ground (Table 3).

    TerrainWind Speed (km/h)Direction Relative to Flight PathTemperature (°C)Cloud Cover (%)RH (%)
    Bare Ground3-5Headwind +/- 25° from starboard20-21060
    Wheat Canopy5-7Headwind +/- 25° from starboard21-22060
    Corn Canopy2-4Headwind +/- 15° from starboard23-26<1075
    Wheat Stubble4-7Headwind +/- 15° from starboard26-28<1065
    Soybean3-4Headwind +/- 15° from starboard22055
    Table 3 Average weather conditions during trials.

    Results

    Raw Coverage Expressed as Percent Coverage or Deposit Density

    Coverage can be presented as raw data plotted by swath position. This is a qualitative means for assessing the swath. The bare ground data has been presented (using both coverage metrics) as an example (Figures 10 and 11).

    Figure 10 Swath coverage data for water on bare ground expressed as percent area covered. All four passes are plotted.
    Figure 11 Swath coverage data for water on bare ground expressed as deposit density. All four passes are plotted.

    Repetitions were similar enough to imply that environmental conditions were consistent during sampling. By averaging the repetitions, coverage in-canopy can be more easily compared to that on bare ground Figures 12 and 13).

    Figure 12 Average swath coverage data expressed as percent area covered. Bare ground (n=10). Wheat canopy (n=3).
    Figure 13 Average swath coverage data expressed as deposit density. Bare ground (n=10). Wheat canopy (n=3).

    The magnitude of coverage on bare ground exceeded that in-canopy, tapering to similitude and near-zero at the edges of the pattern. It can therefore be concluded that the entire swath was captured, and that spray was filtered by the canopy before reaching the sampler within.

    The difference between bare ground and the wheat canopy was greater when the data were presented as percent area versus deposit density. Differences in the number of deposits from finer sprays were more accurately resolved using deposit density than percent coverage. Since it can be expected that smaller droplets penetrate a canopy better than coarser droplets, it may be more appropriate to use deposit density to document their presence. We also saw indications of wider swaths when data were presented as deposit density, as well as a bimodal distribution that reflected the positions of the two rotary atomizers.

    While informative, this raw coverage format did not allow empirical comparisons. Each pass must be converted to a swath width.

    Converting to Swath Width

    Each pass was transformed by averaging Swath Gobbler data to a single value every 0.5 m. Data were then entered into the www.sprayers101.com swath width calculator and the SW was manually determined for each pass. Criteria was the lowest overdose, lowest underdose and lowest CV for an idealized threshold coverage of 90% that of the highest value in the swath. In the following histogram, the SW from all treatments have been averaged for ground and canopy terrains (Figure 14).

    There was a significant reduction in swath width in a wheat canopy compared to stubble or bare ground. There was a 41.2% reduction in swath width in a canopy when measured as percent area covered and a 26.6% reduction when expressed as deposit density. As previously stated, deposit density better reflects the contribution of finer deposits, which tend to penetrate deepest into crop canopies.

    Figure 14 Average effective swath width for all treatments on all terrains. Swaths expressed from both percent coverage and deposit density metrics. Standard error bars presented. Canopy (n=45). Ground (n=22).

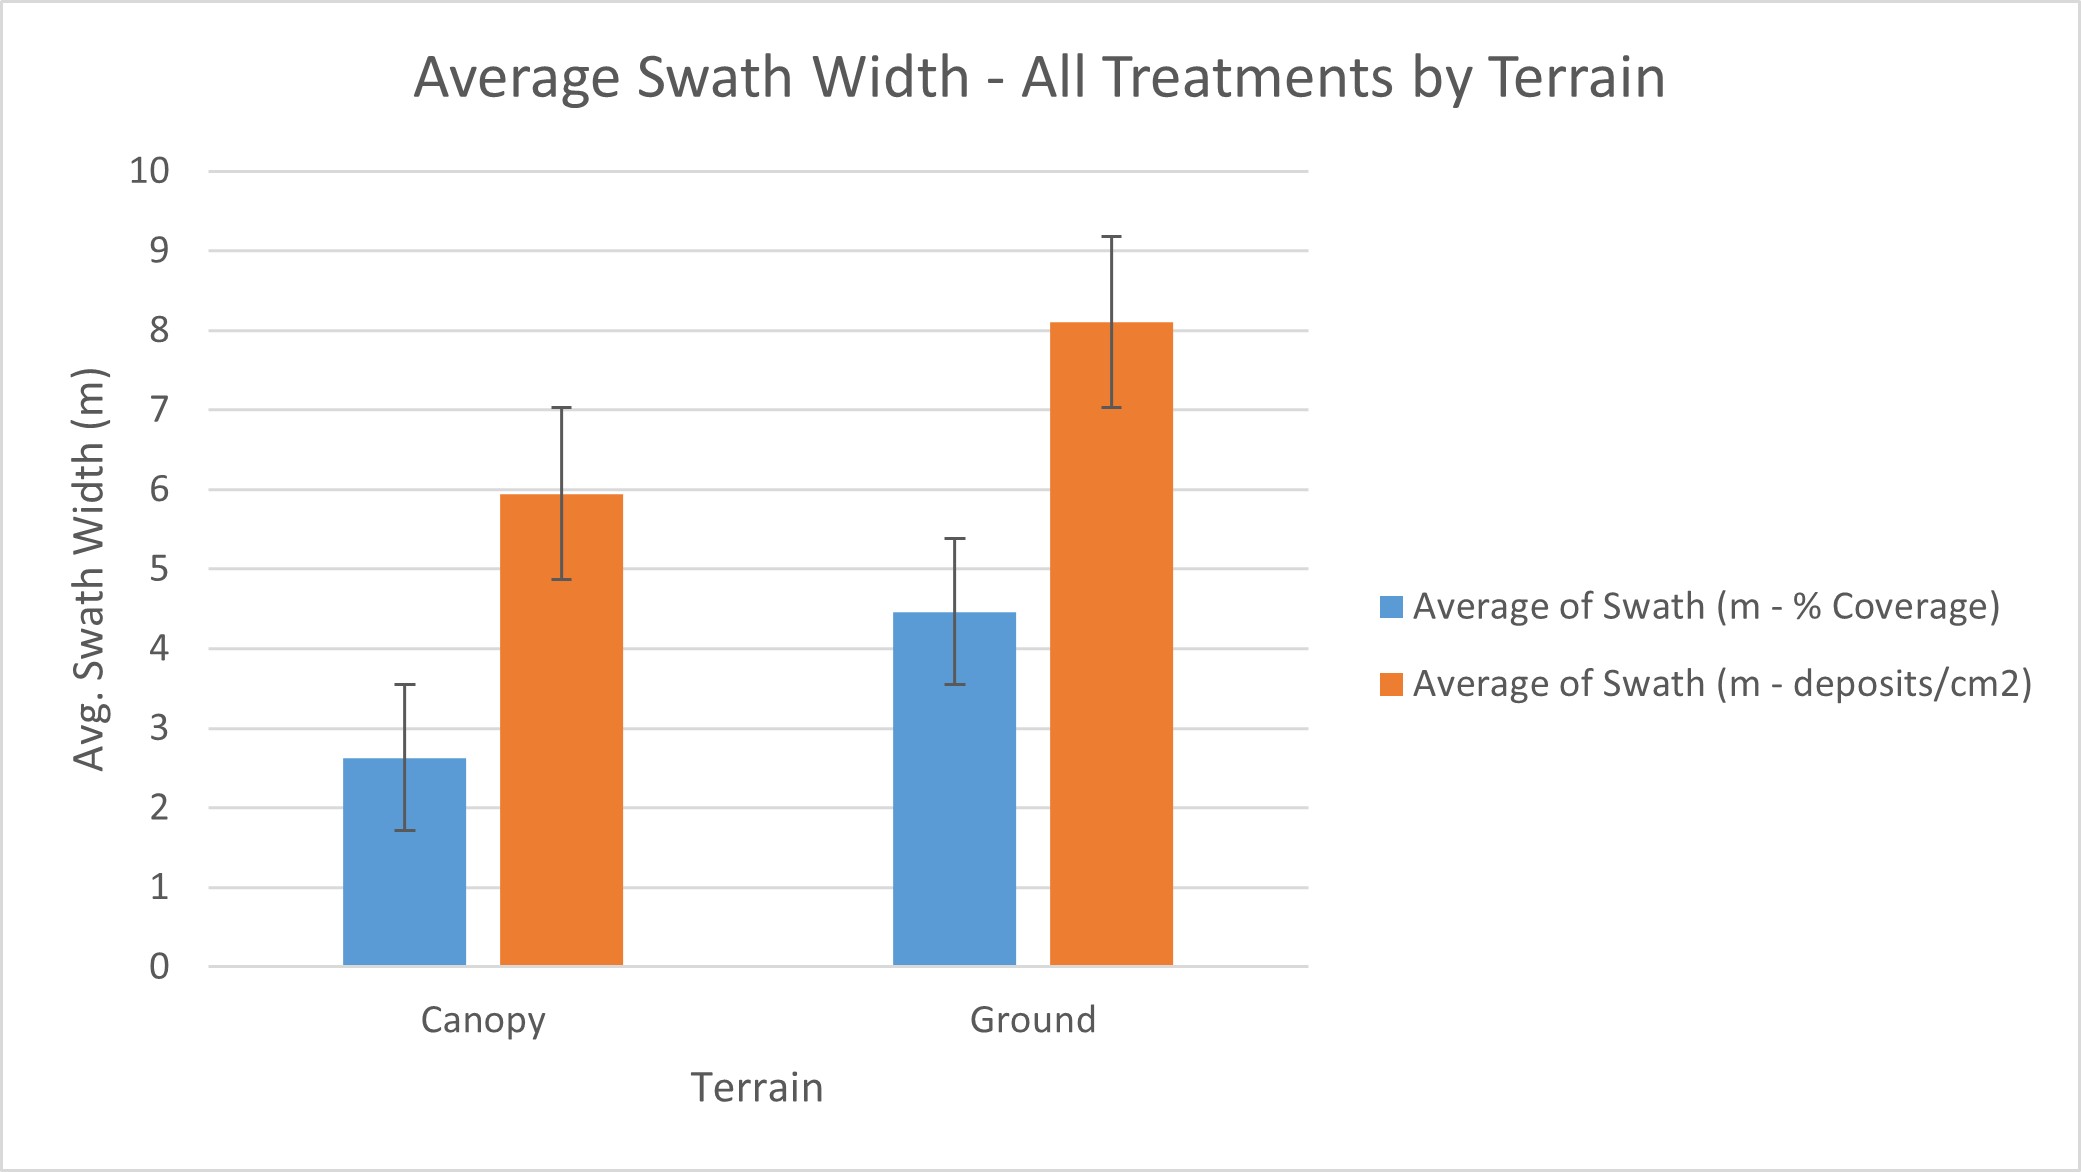
    When the data is considered by terrain and by crop, we see that swathing on bare ground or in wheat stubble doesn’t have a significant impact. This justifies combining those data as “Ground” in subsequent analyses.

    Another observation that supports the use of deposit densities is the difference between the intended (i.e., programmed) swath width and the detected swath width on ground (Figure 15). The SW on ground was closer to the intended 8 or 10 m swath width when expressed as deposit density. It was approximately half the desired width when expressed as percent coverage, which is considerably less than common practice.

    Figure 15 Average effective swath width for each crop and terrain. Swaths expressed from both percent coverage and deposit density metrics. Standard error bars presented. Ground 8 m swath (n=19). Ground 10 m swath (n=3). Canopy 8 m swath (n=39). Canopy 10 m swath (n=6).

    Canopy Effect

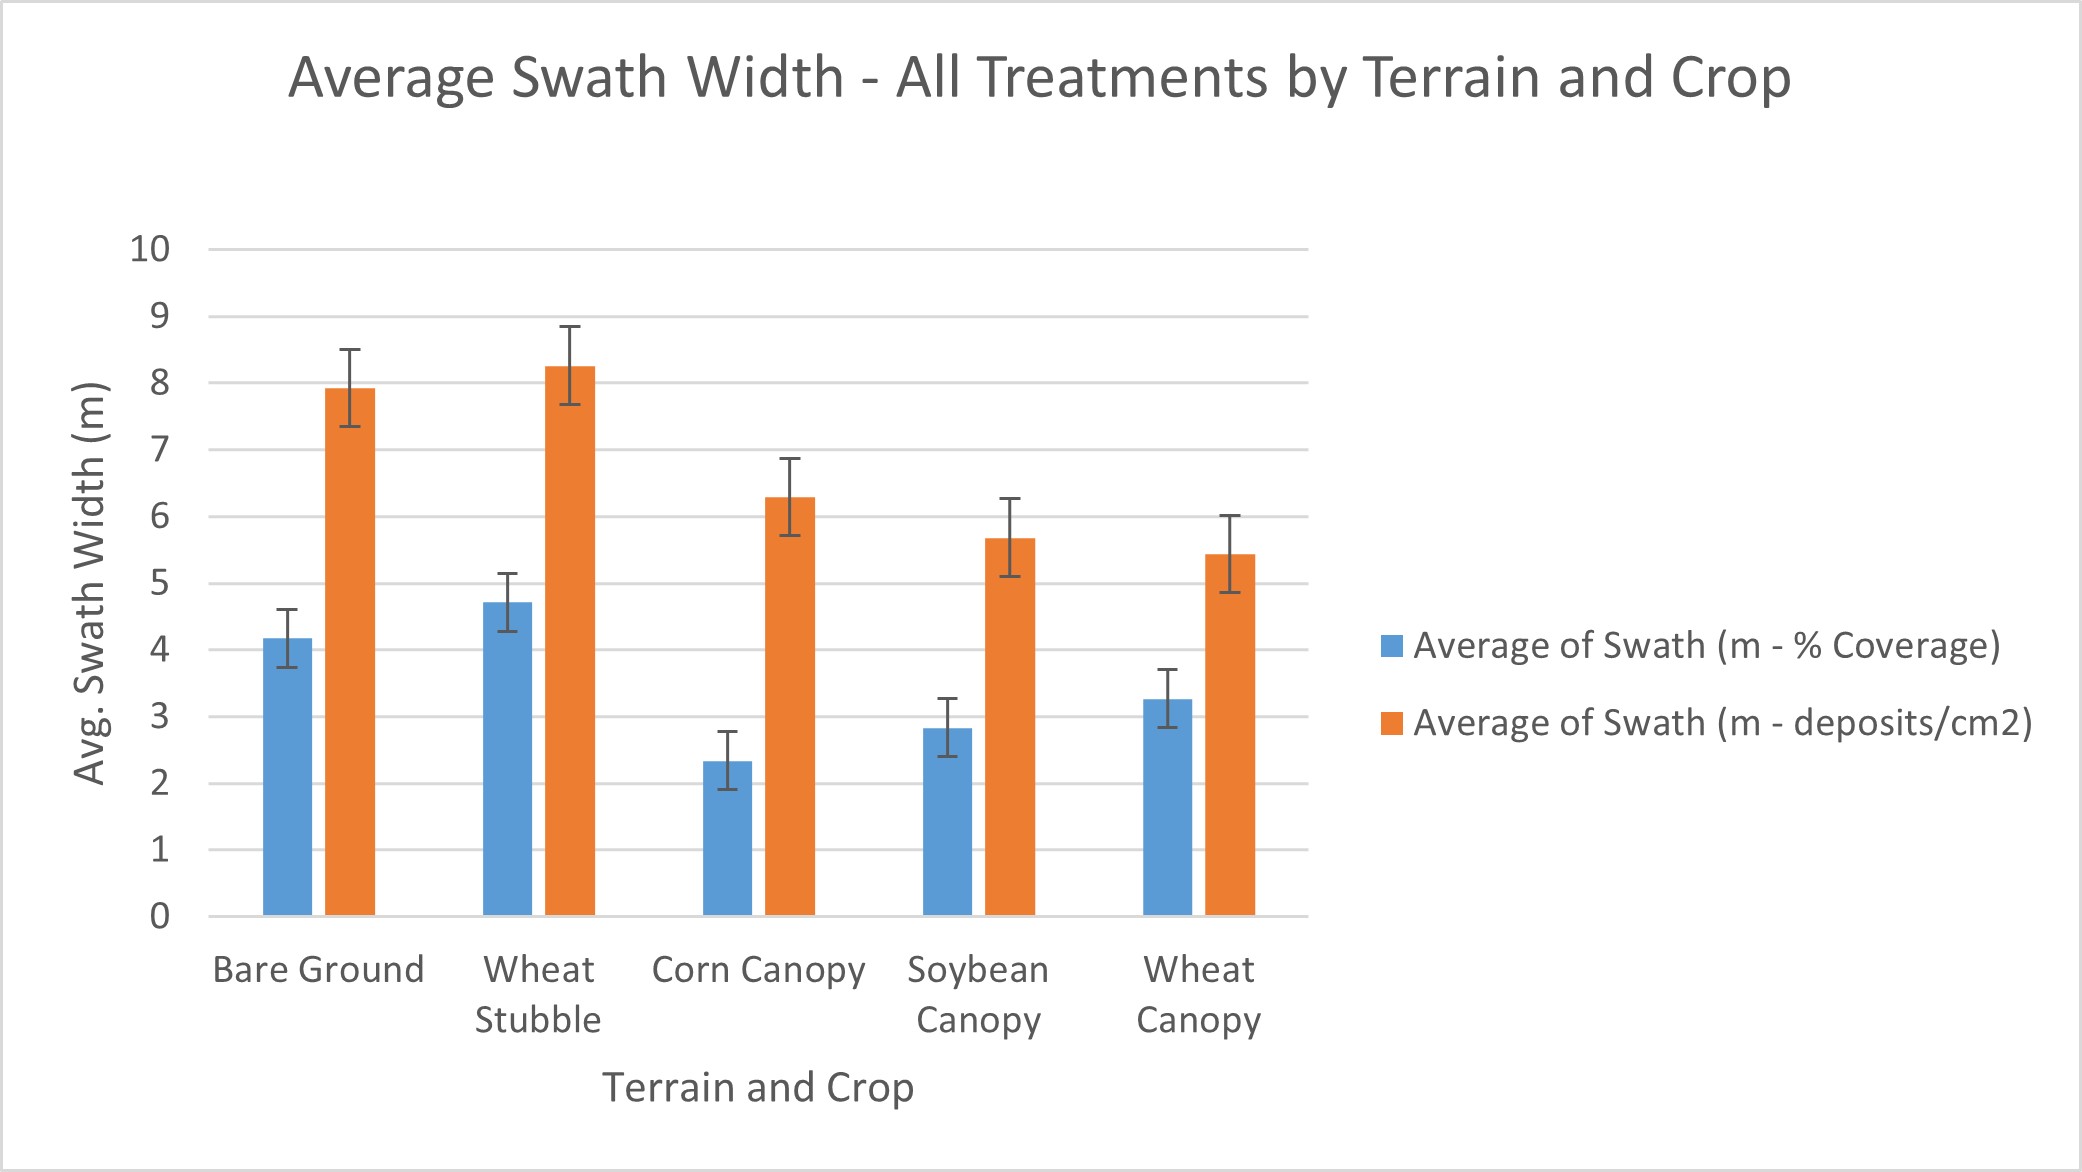
    By percent area, corn had the biggest reduction in swath width compared to bare ground, then soybean, then wheat (Table 4 and Figure 16). This suggests the SW shares an inverse relationship with the canopy depth. However, the relationship reversed when SW was expressed as deposit density. The relationship between droplet size, crop physiology, planting architecture and canopy penetration is complicated, and no conclusions can be drawn beyond a reduction in SW in-canopy.

    Crop% Reduction in SW (% area)% Reduction in SW (deposits/cm2)
    Corn44.020.6
    Soybean32.228.3
    Wheat21.731.5
    Table 4 Reduction in average effective swath width in-canopy by crop compared to on ground. Swaths expressed from both percent coverage and deposit density metrics.
    Figure 16 Average effective swath width for each terrain. Swaths expressed from both percent coverage and deposit density metrics. Standard error bars presented. Bare ground (n=10). Wheat Stubble (n=12). Corn Canopy (n=21). Soybean Canopy (n=21). Wheat Canopy (n=3).

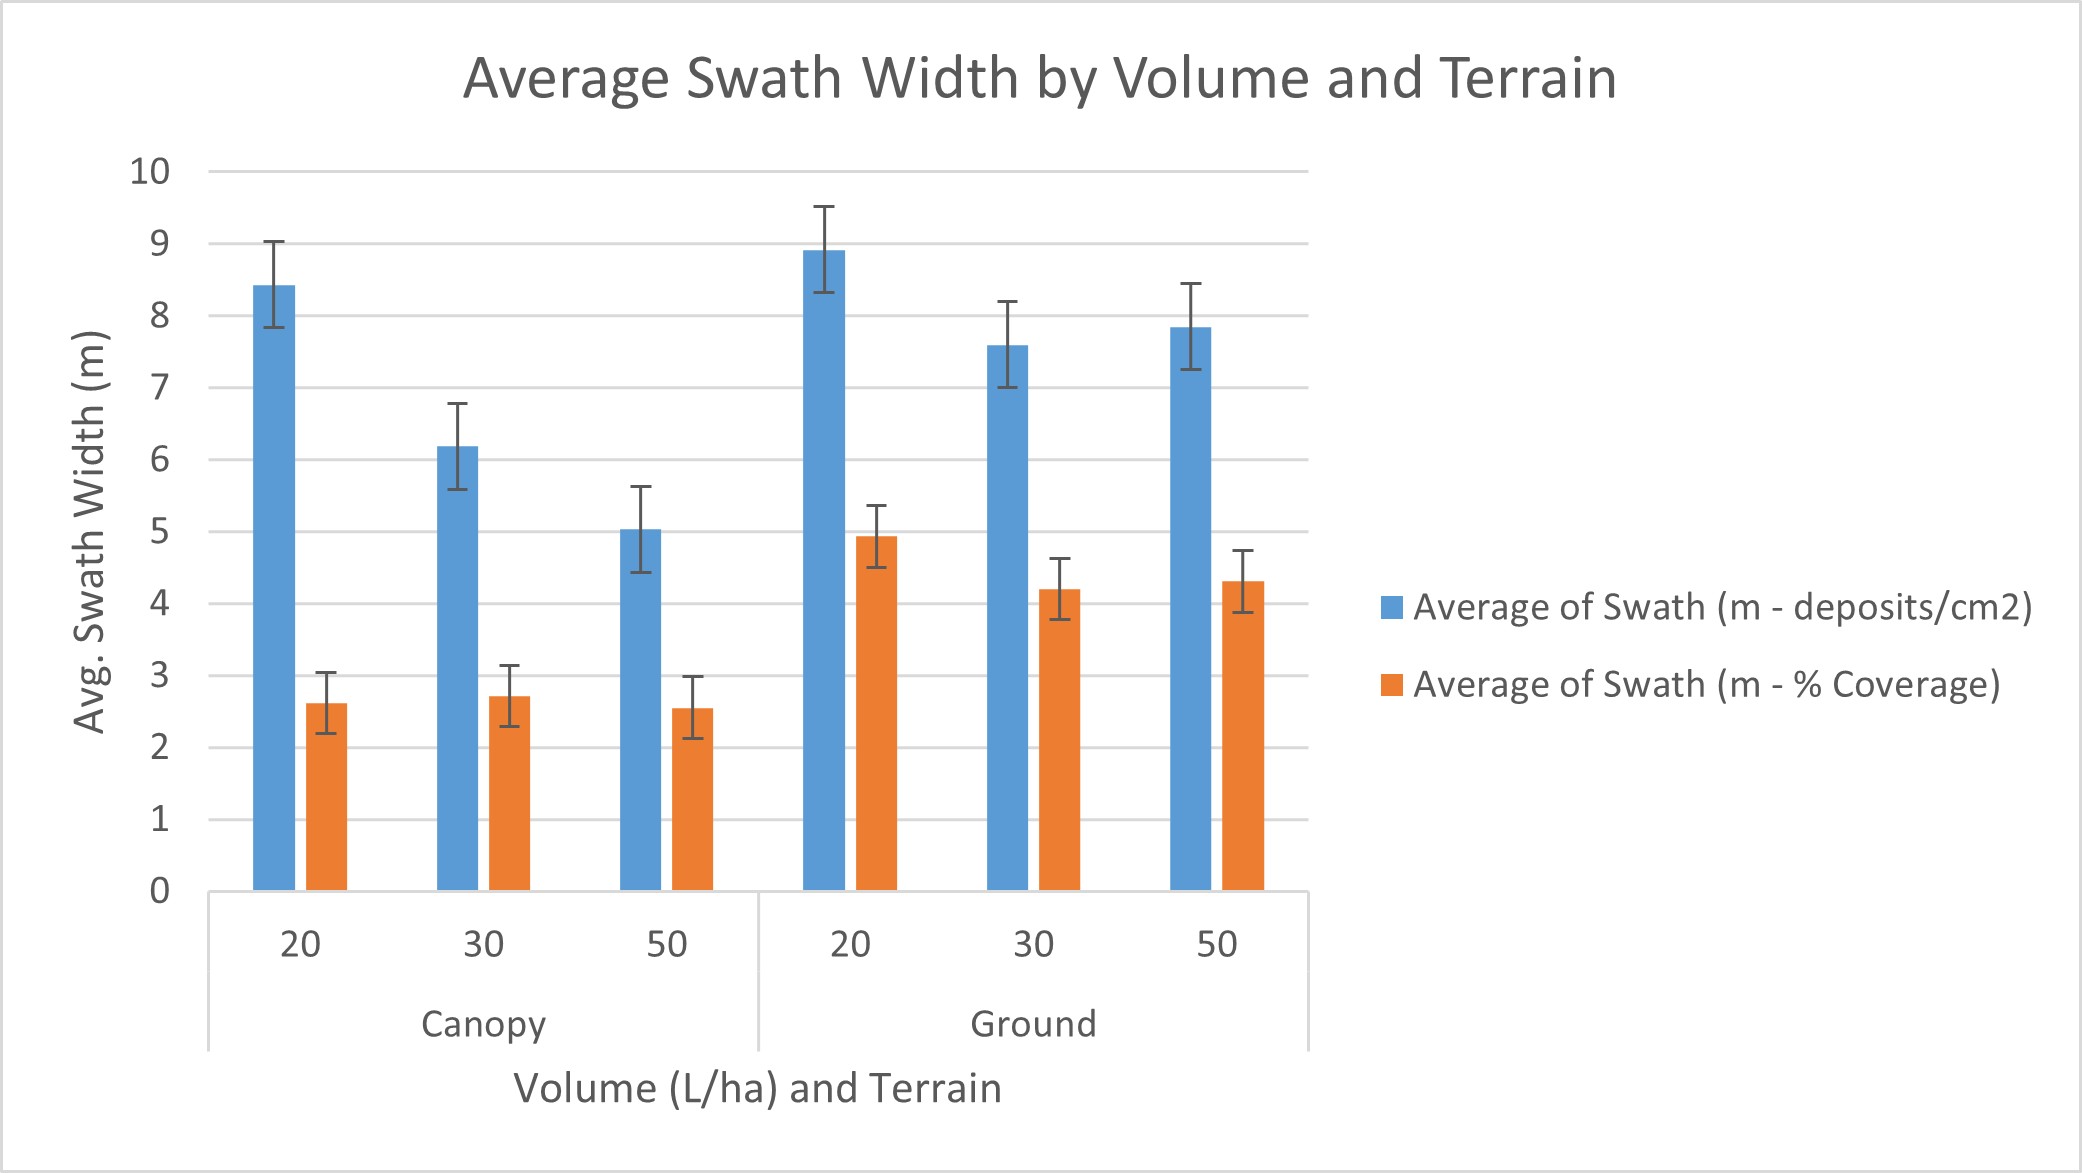
    Effect of Volume on SW

    The effect of spray volume on swath width is not immediately clear. When the data were expressed as deposit density, volume shared an inverse relationship with SW in canopy (Figure 17). There appeared to be no effect when expressed as percent coverage. The inverse relationship is weakly expressed, if at all, for both metrics on bare ground.

    Figure 17 Average effective swath width by volume and terrain. Swaths expressed from both percent coverage and deposit density metrics. Standard error bars presented. Canopy 20 L/ha (n=6). Canopy 30 L/ha (n=18). Canopy 50 L/ha (n=21). Ground 20 L/ha (n=6). Ground 30 L/ha (n=3). Ground 50 L/ha (n=13).

    Effect of Speed on SW

    For most RPAS designs, lower volumes are applied at higher flight speed (Table 5). Previous work demonstrated that higher flight speeds tended to result in wider swaths and an increase in drift. Do higher speeds cause wider swaths in-canopy, despite lower volumes?

    Volume Applied (L/ha)5 m/s Flight Speed8.3 m/s Flight Speed10 m/s Flight Speed
    203 treatments9 treatments
    309 treatments12 treatments
    5034 treatments
    Table 5 – Number of treatments for each flight speed by volume applied.

    Flight speed had a clearer impact on swath width than spray volume did (Figure 18). There was a positive relationship between flight speed and swath width as measured by deposit density in canopy and on bare ground.

    Figure 18 Average effective swath width by speed and terrain. Swaths expressed from both percent coverage and deposit density metrics. Standard error bars presented. Canopy 5 m/s (n=27). Canopy 8.3 m/s (n=12). Canopy 10 m/s (n=6). Ground 5 m/s (n=16). Ground 8.3 m/s (n=3). Ground 10 m/s (n=3).

    Just as with volume, there appeared to be no significant effect on swath width in either canopy when expressed using percent coverage. This was likely because finer sprays were better able to penetrate a canopy and deposit density is better able to resolve their presence.

    Conclusions

    There was no difference in SW between stubble and bare ground. The SW on-ground was far closer to the programmed 8 or 10 m swath width when expressed as deposit density.

    There appears to be a significant reduction of SW in-canopy versus on-ground. A crop canopy created a 26.6% reduction when expressed as deposit density. Specifically, corn was -20.6%, soybean was -28.3%, and wheat was -31.5%. Previous work has demonstrated diminishing coverage with canopy depth in corn, but it is difficult to make comparisons between agronomic use cases (e.g. different planting architectures and plant physiologies).

    When the data were expressed as deposit density, spray volume shared an inverse relationship with SW in-canopy, but the effect on SW on-ground was less clear. However, RPAS speed had a clear inverse relationship with SW in-canopy and strong trend on-ground.

    It is understood that finer spray is better able to penetrate canopies. One reason is because finer droplets are able to become entrained the downwash. Another is simply mathematical advantage, given that finer sprays are comprised of exponentially higher numbers of droplets than coarser sprays, increasing the odds of deposition. Conversely, coarser droplets (which have the greatest influence on percent area covered), are more likely to impinge on the canopy structure before reaching the sampler. Deposit density appears to be the more accurate metric for calculating SW both on-ground and in-canopy.

    The reduced SW in-canopy versus on-ground explains, in part, why striping is occurring in aerial corn fungicide applications. The route spacing reflects on-ground swath width, where it should reflect the shorter, ESW.

  • Adventures in Lecturing – Turn Off PowerPoint

    Adventures in Lecturing – Turn Off PowerPoint

    Harvest is mostly done and growers want to hear what we’ve learned and what’s coming next. Lecture season is upon us once again.

    In 2021 we’re still finding our way through virtual conferences and hybrid models, but I like to think we’re slowly returning to the in-person format. Just last week I gave my first in-person talk in 20 months. It felt wonderful after having spoken into a dead-eyed camera for so long. Half-way through my lecture I remembered a lesson I learned a few years back and spontaneously decided to go off-script.

    Let me explain.

    In 2016 I was invited to present at the 40th annual Tomato Days conference in Southern Ontario. I knew what I wanted to say, but didn’t have a decent slide deck for that particular topic. I’d have to pull one together.

    I work hard on my presentations. I employ lots of imagery (I create all my own illustrations). I get persnickety about fonts, white space and slide transitions. I try to tell a story that educates and hopefully, entertains. Prideful? Perhaps. But if you’re willing to sit on a hard chair for an hour, I’m going to do my best to make it worth your while.

    I finished the slide deck, drove three hours to the conference, handed my USB data key to the organizers and sat down to wait my turn. It was a clear, bright winter morning and I saw that the pavilion we were in was more-or-less windows and a roof. It was so bright, in fact, that none of the 150 attendees could see the projector screen!

    I watched sympathetically as the first speaker spent 30 minutes trying (and failing) to verbally describe his graphs. I cringed as the second speaker pantomimed her illustrations in some kind of brave, interpretive dance. Then it was my turn.

    I decided I wasn’t going down that road.

    When the moderator brought up my talk, I turned the useless projector off. I asked the squirming and disinterested audience:

    Q. “What’s the most terrifying thing you can do to an academician?”
    A. 
    “Take their Power Point away.”

    For the next 30 minutes we had a discussion about spray coverage. No props. No slides. The audience slowly warmed up to the new format. They shared experiences. They debated. They asked questions. I became more facilitator than speaker.

    When our time was up I think everyone was pleased. Sure, I missed a lot of my key points and never really addressed the subjects I thought I would, but who cares? Everyone learned something.

    For me, I learned that speakers should abandon the script every now and again. It’s not always ideal since we’re there to teach and structured visuals are often required. But, the next time you’re asked to speak, consider the possibility of using your time to engage your audience and establish a dialogue… not just talk at them until the moderator gives you the 5-minute warning.

    I have a colleague who does this masterfully. Whenever he is the last speaker on the agenda, and the previous speakers have discourteously gone over-time and whittled his time in half, he jumps straight to his take-home slide. He leads a quick discussion with the audience and becomes a hero. The moderators are now back on schedule and no one is late for lunch.

    Since “Tomato Days”, I now try to do this once a year. I never know when the mood will take me, but when it does I give the audience a choice: They can hear my canned presentation or I can shut it down and we can have a conversation. To date, given the option, every audience has opted to go off script. It’s scary, it’s fun and like I said earlier, everyone learns something.

    I challenge you to try it the next time you’re lucky enough to be in front of an audience in person.

  • Canopy Management for Improved Airblast Coverage

    Canopy Management for Improved Airblast Coverage

    Managing the canopy of any perennial crop (e.g. pruning, hedging, leaf stripping, etc.) is an important consideration. The benefits are manifold: It affects the health of the plant, the quantity and the quality of the yield. It allows light and air to circulate and it keeps the crop manageable. From the perspective of an airblast sprayer operator, the reason for canopy management is quite simple:

    If you can’t see it, odds are you can’t spray it.

    Picture this: It’s late April, and an apple grower and I are calibrating his sprayer. We achieve excellent spray coverage in the target block, shake hands and part ways. In late May I get a phone call from the grower. I assume it’s time to adjust his settings to match the growing canopy, but no… he had called to say he suspected apple scab in one of his blocks. Since I was the last person to adjust his sprayer, the unspoken implication was that I’d better come fix matters.

    As I drove back out to his orchard, I considered what the problem might be:

    • Bad product choice?
    • Poor application timing?
    • Spraying in inclement weather?
    • Cutting rates?
    • Resistance? (a long shot)

    Maybe it was ego, but I couldn’t believe it would be the calibration. We left ample volume to provide sufficient coverage to get the grower to petal fall. We ensured the spray swath was higher than top of the tallest tree, accounting for wind and an uneven alley. We did everything right to match the sprayer to the canopy and leave enough buffer to get to petal fall.

    When I arrived, he took me to a block I hadn’t seen before. We didn’t calibrate the sprayer to match this particular group of trees, but he figured since they were about the same height, the sprayer would do its job. It was immediately obvious to me what the problem was, but I knew if I simply told him outright, the lesson might not stick. And so, with respect to that old proverb, I taught him to fish rather than give him one. We spent the next few hours trying to fix our alleged calibration problem by exploring:

    • Slower ground speed
    • Higher fan gear
    • Higher rpms to increase fan speed
    • Changes to deflector settings
    • Air induction nozzles in top positions
    • Higher sprayer output

    Of course, none of these adjustments had any great impact on coverage because the problem was that the alley had grown so tight that branches were brushing the cab of the tractor (see picture).

    If the canopy is brushing against the tractor, it may intercept spray before it expands fully. Essentially, it temporarily blocks nozzles.
    If the canopy is brushing against the tractor, it may intercept spray before it expands fully. Essentially, it temporarily blocks nozzles.
    Closed canopies and tight alleys will almost always compromise spray coverage.
    Closed canopies and tight alleys will almost always compromise spray coverage.

    The canopy was so dense you couldn’t see the trunk! I asked the grower to move the sprayer down the row to a tree I saw that was far less dense that the others. We returned the sprayer to our original calibration settings and achieved excellent coverage once again. The only solution was to prune the trees, and once his workers did this, coverage improved considerably. An airblast sprayer can only do so much. Sometimes it comes down to canopy management.

    An orchardist taught me this trick: If you want to know if spray will penetrate a canopy, you should be able to see the trunk.
    An orchardist taught me this trick: If you want to know if spray will penetrate a canopy, you should be able to see the trunk.
    An orchardist taught me this trick: If you want to know if spray will penetrate a canopy, you should be able to see sunlight through the shadow at high noon.
    An orchardist taught me this trick: If you want to know if spray will penetrate a canopy, you should be able to see sunlight through the shadow at high noon.

    Row Spacing in Specialty Crops

    Canopy management isn’t just an orchard issue. For high bush blueberry crops, coverage problems may stem from insufficient pruning. How can spray reach the lower, inner portion of a mature bush to control spotted-wing drosophila if the canopy is too thick?

    Sometimes it’s not the canopy, but the plant and/or row spacing. Many nurseries arrange container crops, shrubs, whips and cedars as tightly as possible. This may optimize how many plants will fit on a given area, but it compromises sprayer access (due to the reduced number of alleys) and may cause plants to block one another from the spray. Nursery sprayer operators often use cannon sprayers to throw spray over and through all those rows of plants, but cannon sprayers produce excessive coverage at the beginning of the swath and increasingly erratic coverage as a function of distance.

    A cannon sprayer attempting five rows of cedars. This sprayer will eventually spray in from the other side, but experience has shown that coverage will be compromised in the centre rows and excessive in the outer rows. Spraying multiple rows may save time, but coverage is almost always erratic.
    A cannon sprayer attempting five rows of cedars. This sprayer will eventually spray in from the other side, but experience has shown that coverage will be compromised in the centre rows and excessive in the outer rows. Spraying multiple rows may save time, but coverage is almost always erratic.
    Calibrating a cannon sprayer can greatly improve coverage consistency. Before calibration (above) the sprayer was equipped with full cone nozzles in the upper boom positions and excessive air was employed in an attempt to force spray through the canopy. Although the sprayer would eventually pass down the far side of the five rows, only the water-sensitive papers in the tops of the trees indicated suitable coverage, and a great deal of spray simply blew away. After calibration (below) considerably less air and spray was used, and coverage on water-sensitive papers placed lower in the trees and facing the sprayer was more consistent. Remember, the sprayer would eventually pass down the far side, resulting in similar coverage on the remaining papers. Don’t bite off more than your cannon sprayer can chew – the further spray travels from the sprayer, the harder it is to achieve consistent coverage.
    Calibrating a cannon sprayer can greatly improve coverage consistency. Before calibration (above) the sprayer was equipped with full cone nozzles in the upper boom positions and excessive air was employed in an attempt to force spray through the canopy. Although the sprayer would eventually pass down the far side of the five rows, only the water-sensitive papers in the tops of the trees indicated suitable coverage, and a great deal of spray simply blew away. After calibration (below) considerably less air and spray was used, and coverage on water-sensitive papers placed lower in the trees and facing the sprayer was more consistent. Remember, the sprayer would eventually pass down the far side, resulting in similar coverage on the remaining papers. Don’t bite off more than your cannon sprayer can chew – the further spray travels from the sprayer, the harder it is to achieve consistent coverage.

    Coverage can be improved by reducing the distance the spray has to travel (i.e. leaving more alleys and reducing the density of planted rows).

    A Jacto cannon sprayer in a nursery. Many nursery and berry operations elect to spray multiple rows in one pass, but be aware that spray coverage suffers the farther away from the sprayer it goes. Independent research has shown that coverage is not reliable at half the distance typically claimed by many cannon sprayer manufacturers. This is a function of canopy density and weather. Always confirm coverage with water-sensitive paper. Photo Credit – M. Lanthier, British Columbia.
    A Jacto cannon sprayer in a nursery. Many nursery and berry operations elect to spray multiple rows in one pass, but be aware that spray coverage suffers the farther away from the sprayer it goes. Independent research has shown that coverage is not reliable at half the distance typically claimed by many cannon sprayer manufacturers. This is a function of canopy density and weather. Always confirm coverage with water-sensitive paper. Photo Credit – M. Lanthier, British Columbia.
    The results of a cannon sprayer calibration in a container crop nursery. The cannon sprayed 1,000 L/ha and tried to cover too many rows in a pass. The water-sensitive paper showed insufficient and inconsistent coverage. When it was recalibrated to spray 550 L/ha, but drive more rows, the water-sensitive paper showed considerable improvement.
    The results of a cannon sprayer calibration in a container crop nursery. The cannon sprayed 1,000 L/ha and tried to cover too many rows in a pass. The water-sensitive paper showed insufficient and inconsistent coverage. When it was recalibrated to spray 550 L/ha, but drive more rows, the water-sensitive paper showed considerable improvement.

    I also suspect that staggering plant spacing from row to row to reduce mutual shading might allow spray to penetrate more easily. As I write this, we’re planning to explore this concept in cedars.

    This is speculative, but the when nursery shrubs, trees and container crops are planted in perfect grids, mutual shading probably prevents spray from penetrating deeply into the planting. By staggering the spacing, spray may be able to penetrate more easily between rows. This can be accomplished without reducing the number of plants per hectare significantly.
    This is speculative, but the when nursery shrubs, trees and container crops are planted in perfect grids, mutual shading probably prevents spray from penetrating deeply into the planting. By staggering the spacing, spray may be able to penetrate more easily between rows. This can be accomplished without reducing the number of plants per hectare significantly.

    In the end, try to see the spray target from the droplet’s point of view. If you can easily see where you want the spray to go, you’ll do well. If you can’t see the target, it’s far more challenging.

  • Does Higher Pressure Increase Spray Penetration?

    Does Higher Pressure Increase Spray Penetration?

    A very common question we hear at sprayer demonstrations is:

    “I want to drive the spray deeper into the canopy – does higher pressure help?”

    Well, here’s the classic government answer:

    “…yes and no.”

    It depends on two things. First, the size of the droplet and second, your tolerance for drift (ours is almost zero, BTW). The following video explains how Fine droplets behave very differently than Coarse droplets. It’s always nice to get outside and toss a few balls around:

    Well, that last statement in the video isn’t strictly correct…

    It’s true that changes in pressure have greater impact on the momentum of coarser droplets, but there is some impact on finer droplets, too. Sufficiently high pressure makes for a finer spray quality and finer sprays have been shown to penetrate dense canopies more effectively. We have seen improved canopy penetration in ginseng, field peppers and matted-row strawberry using finer spray under higher pressure. If pressure is high enough, it will create air-inclusion and impart additional momentum to even Fine spray droplets over a short distance, but it’s a case of diminishing return. That is, it takes a lot of pressure to do it and relatively speaking they only got a bit faster/further. In our work, we used pressures between 90 and 300 psi. Excepting hollow cones, that’s generally on the upper end, or beyond a nozzles rated pressure range and it may even be outside the pumps capacity.

    The reason we downplay pressure as a tool for improving canopy penetration is because finer spray under high pressure causes unbelievable drift. A fraction of the spray does get deeper into canopies when you “fog it in”, but the plume of spray blowing beyond the sprayer is entirely unacceptable. Slowing down the travel speed, spraying on cool, humid, low-wind days and lowering boom height can help, but in every trial where we’ve used high pressure and Fine spray quality, we see the image below… or far worse:

    Staged drift in peppers using water
    Staged drift in peppers using water and high pressure combined with Fine spray quality

    The compromise in canopy penetration is to use a Medium spray quality and higher water volume. Stay within the pressure range the nozzle requires to achieve that Medium spray quality. If canopy penetration is still insufficient, consider canopy management (like planting density and pruning) and explore drop-arms to direct the spray, or booms that offer an air-assist or air-deflection option (a few shown here) to entrain and carry spray into the canopy.

    Don’t use higher pressure to increase canopy penetration.

  • Selecting the Right Water Volume

    Selecting the Right Water Volume

    Low water volumes can mean less effort to apply pesticides. But there is a limit to how low water volumes can go before problems appear. To understand the reasons why, and help applicators use the right volume for a given situation, we briefly outline what happens to a spray cloud as it reaches the crop canopy.

    Basic Principles

    To choose the right water volume, we have to remember three criteria for sprays to be effective.

    • First, the spray must reach the target.
    • Second, there must be enough droplets to sufficiently cover the target.
    • Third, the droplets have to be in a form (size and pesticide concentration) that allows the pesticide to be efficiently taken up by the target.

    Reaching the target

    Let’s start with the first criteria, reaching the target. Droplet size is important for minimizing both spray drift and droplet evaporation. Small droplets move off-target easily, they also evaporate to dryness very quickly and may not have the expected performance as a result. Larger droplets clearly reduce drift, but may bounce off the target and offer less coverage per water volume.

    Droplets of various sizes are actually important to cover all parts of a target, so we shouldn’t eliminate all the small ones. For example, penetration of dense broadleaf canopies, or coverage of small targets like stems is best achieved with smaller droplets, while larger droplets are useful for penetrating grassy canopies or targeting the top of a broadleaf canopy.

    Target coverage

    We need to get the right number of droplets to the target. The more leaf area to be covered (i.e., the taller or denser the crop canopy), the more droplets will be required. Leaf Area Index (LAI), defined as the total leaf area per unit ground area, is a good indicator of canopy density.

    To put this in perspective, consider a pre-seed burnoff or an early post-emergent herbicide spray vs. a late season fungicide. In the first case, the canopy can be described as being in a single plane near ground level, with leaf areas of target plants fully exposed and with an LAI of <1. High droplet density on the leaves will be achievable with relatively low volumes.

    In the second case, the canopy will have more depth, and will contain large leaf areas in each of the lower, mid, and upper canopy regions, with LAI >>1. Providing the same droplet number to each of the regions in the second case will require more droplets, and therefore more volume.

    Taken as a whole, the exclusive use of finer droplets can be counterproductive due to evaporation and drift. Higher water volumes have the advantage of allowing larger average droplet sizes to be used, minimizing evaporation, drift, and enhancing deposition.

    Deposit efficacy

    The third criteria, maximizing the performance of specific pesticides with droplet size, is more complicated. Typically, contact modes of action and grassy or difficult-to-wet targets require somewhat finer sprays and higher water volumes (Table 1). With tank mixes, such as glyphosate and Heat or AIM, the higher water volume and finer spray criteria should be used. For any specific herbicide, use the higher volume with coarser sprays.

    Table 1. Herbicide modes of action, minimum water volumes with low-drift nozzles, and maximum spray quality

    Mode of Action and Spray Quality

    In practice, an applicator rarely encounters just one type of targeting situation. Most herbicides are either broad-spectrum, or are tank mixed to target both grass and broadleaf weeds. As a result, the same spray operation has to be effective on grass weeds and broadleaf weeds, some of which may be near the top of the canopy, or be more mature, whereas others may be just emerging. In these cases, a number of different droplet sizes will be required.

    Low-drift nozzles

    A low-drift nozzle can be used for most applications, as long as small adjustments are made for specific conditions. Increases in pressure above 60 psi (for finer droplets, Medium to Coarse spray quality) and volume to at least 7 to 10 US gpa (for better penetration) with this nozzle optimizes performance for grassy weeds. Lower pressures (down to 40 psi, Coarse to Very Coarse spray quality) are sufficient for systemic broadleaf products or when additional drift control is necessary. Higher volumes (12 – 15 US gpa) may be needed to obtain coverage in dense canopies. Always check with nozzle manufacturer information to learn what spray quality is produced by the nozzle you’re using – this will vary with nozzle type, flow rate, and spray pressure.

    Droplet sizes in sprays

    All nozzles produce a wide variety of droplet sizes ranging from 5 µm to 1000 µm in diameter. The main difference between sprays is the proportion of their volume in any given size fraction, with low-drift sprays having less of their volume in the drift-prone sizes.

    Spray Quality Comparison
    Size distribution (by volume) of two spray qualities. Not that both of these sprays contain small and large droplets. The difference is the volume (=dosage) in each of these size fractions. Shaded areas highlight drift-prone droplets (left) and bounce-prone droplets (right).

    But even low-drift nozzles produce small droplets, and these provide sufficient coverage in most cases. Low-drift sprays do create more larger droplets, and these do not contribute to coverage due to their relatively low number and poor retention.

    Our main tools for droplet size selection are spray pressure (higher pressure reduces droplet size) or nozzle choice.

    Spray Pressure

    Higher pressures are sometimes thought to increase canopy penetration because they force the spray into the canopy. This is not true. While higher pressures create faster moving droplets, this speed quickly diminishes. By the time the spray enters the canopy, the faster velocity is lost, especially for the smaller droplets, and the only effect that remains is the finer spray. Finer droplets will penetrate many canopies further, but only if they are protected from wind. On a windy day, the finer sprays are more likely to blow downstream, or perhaps evaporate. The main benefit of higher pressure is better operation of the nozzle, especially air-induced nozzles, leading to more uniform patterns and better overall results.

    Large Droplet Advantages

    Although coarser sprays are often thought to work less well, they offer certain advantages.

    • One advantage is that a coarser spray tends to provide the air assist mentioned above (dragging air into the canopy, and giving smaller droplets a greater chance of moving where they’re needed).
    • Larger droplets also take longer to evaporate, increasing opportunities for uptake and translocation within the plant.
    • Larger droplets are more efficient at targeting the exposed, large leaves of plants requiring disease protection, leading to greater deposition and fungicide performance.
    • Most importantly, coarser sprays produce less drift, enabling application under windier conditions and thus ensuring that the timing of the application with respect to the crop or disease stage can be optimized.

    Water Volume

    Higher water volumes are the single most effective way of increasing dense canopy penetration. Higher volumes will deliver a greater number of droplets to the lower canopy, leading to greater performance when lower canopy coverage is of importance. When used in combination with lower travel speeds, the downward air flow created by sprays can provide significant benefits in forcing the smaller droplets further down. Larger volumes also decrease sensitivity to droplet size, permitting coarser sprays that reduce spray drift.

    Nozzle Angling

    Research has shown that exposed (upper canopy) vertical targets such as heads or stems will benefit from an angled spray. Forward-pointed sprays offer a slight advantage over backward-pointed sprays. Since angled sprays must maintain this trajectory to be useful, it is recommended that coarser spray qualities be used to minimize fine droplet production. Angled fine droplets will quickly deflect from their initial angled path and move with prevailing winds. Low booms heights also help in maximizing the benefit of angled sprays.  Canopy penetration has not been shown to be improved with forward angled sprays, but backward angled sprays can help place some spray deeper into grassy canopies.

    Broadleaf vs Grassy Canopies

    How can an applicator decide the most appropriate water volume and spray quality for a specific application scenario? The following guides should help.

    First determine the canopy density and form (broadleaf or grassy), and the target site within it (upper, mid, or lower). If the canopy is dense, but fairly vertical (i.e., a cereal), and a significant portion of it needs to be protected, the best strategy is to apply a higher water volume using a reasonably slow ground speed to allow the spray’s built-in air assist to work. If, on the other hand, only the upper layer of leaves, or the heads, are to be targeted, slightly less water can be used. If the water volume is appropriately high for the canopy, larger droplet sizes do not significantly diminish coverage or pesticide performance.

    If the canopy is dense but more horizontally oriented (broadleaf crops), similar rules apply for water volume and travel speed, but now the use of a somewhat finer spray may be of benefit. The smaller droplets will be better able to move around and through the leaves to reach deeper into the canopy. Ensuring a downward trajectory of the spray through travel speed and water volume selections will be important.

    Nozzle suggestions

    A very good starting point for a conventional rate-controlled sprayer is any one of the low-pressure air-induced tips that now form the majority of the market. These tips are similar enough in terms of pressure range (30 – 100 psi), spray quality (Medium-Coarse-Very Coarse, depending on pressure), and spray pattern fan angle (about 100 degrees) to have comparable performance with most pesticides. Such tips are best operated in the middle of their pressure range, which is about 50 – 70 psi, offering some room to move as travel speeds change.

    For those with Pulse-Width Modulation (PWM), where most air-induced tips cannot be used, nozzle choice is more limited but growing

    All these tips are described in more detail here.