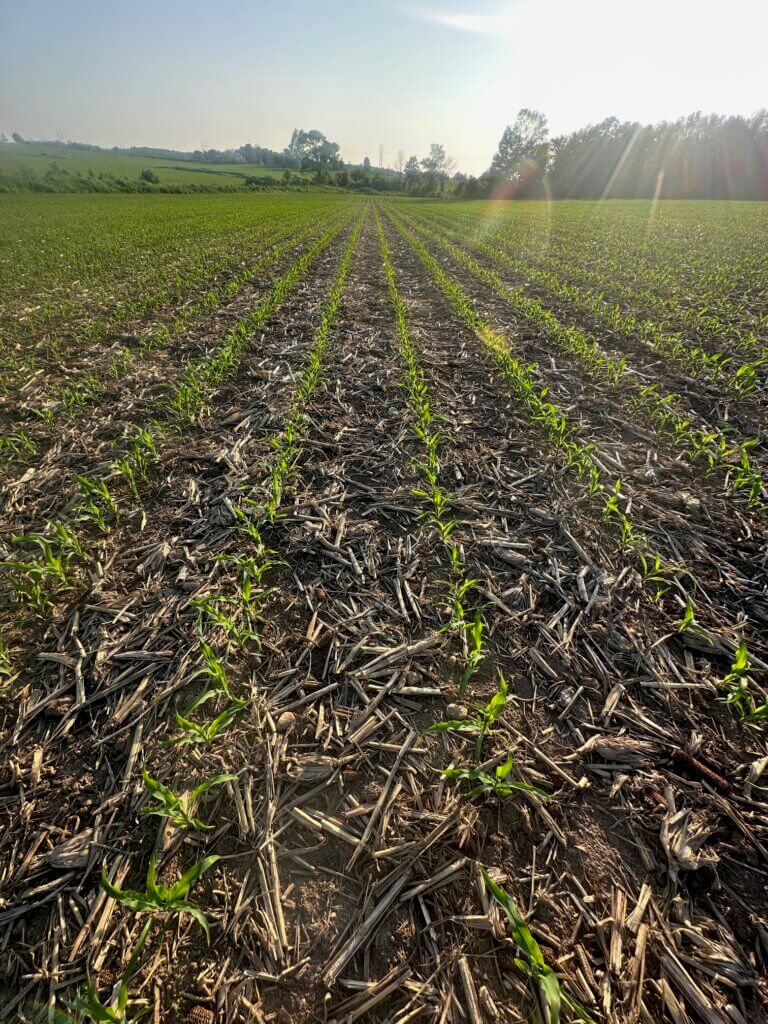
Category: Boom Sprayers

Main category for sprayers with horizontal booms

  • Tank mixing Urease and Nitrification Inhibitors in Corn Weed-and-Feed Applications

    Tank mixing Urease and Nitrification Inhibitors in Corn Weed-and-Feed Applications

    This 2023 article is based on work performed by Mike Schryver, BASF Technical Service Specialist.

    Nitrogen is an essential nutrient required throughout a plant’s lifecycle. It is commonly applied to corn in either a granular form as urea or in a liquid form as urea-ammonium nitrate (UAN). Depending on soil type and precipitation, significant amounts of nitrogen can be lost to leaching, denitrification and volatilization as N2O (a greenhouse gas). Learn more about nitrogen in soil in this excellent overview by University of Minnesota Extension.

    With the 2020 announcement of Canada’s Strengthened Climate Plan, Ontario is committed to a 30% reduction of 2020 N2O emission levels by 2030. Adding urease and nitrification inhibitors (aka stabilizers) to nitrogen fertilizer applications is an environmentally sustainable practice that reduces nitrogen losses and improves yield.

    Another essential plant nutrient, Sulphur, is applied in liquid-form as ammonium thiosulphate (ATS). Primarily used to increase corn yields, high rates (approx. >10% by volume) of ATS can also inhibit urease and nitrification, albeit not as well as other nitrogen stabilizing options.

    In the pursuit of productivity, UAN and ATS are often combined to serve as an herbicide carrier in corn weed-and-feed applications. However, liquid fertilizers are dense solutions that contain charged ions and exhibit a reduced capacity for solubilizing pesticides. This complicates the tank mixing process. When micronutrients like sulfur are added to nitrogen-based formulations, physical incompatibilities can arise that cause uneven applications and can even clog sprayers.

    Given the known compatibility issues, questions have been raised about the best way to introduce urease and nitrification inhibitors to tank mixes of UAN, ATS and herbicide. Specifically:

    1. Stabilizer Compatibility: What is the impact of adding nitrogen stabilizers to UAN carriers containing leading corn herbicides formulated as emulsifiable concentrates (EC) or suspension concentrates (SC)?
    2. Mixing Order: When UAN and ATS are premixed, does their ratio, or the addition of nitrogen stabilizer affect tank mix compatibility with herbicides?

    To answer these questions, we performed a series of jar tests.

    Method

    300 ml jars with magnetic stir bars were mixed to reflect a 10 gpa application. UAN was chilled to approx. -5°C and herbicides were added at 2x the labelled rate to simulate a worse-case scenario. Nitrogen stabilizer was added at a ratio per manufacturer’s instructions. Products were introduced at 1 minute intervals to provide sufficient time for solubilization. Jars were left to rest for at least 1 hour after mixing, and then agitated to simulate interrupted spray jobs. The solution was then poured through a 100 mesh screen to simulate a worst case scenario for sprayers that typical employ 50 mesh filters.

    HerbicidesFertilizer carriersStabilizers
    Leading EC HerbicideUAN: 28%eNtrench NXTGEN (Corteva)
    Leading SC HerbicideATS: 12-0-0-26% SUAnvol (Koch)
    Tribune (Koch)
    Agrotain (Koch)
    Neon Surface (NexusBioAg)
    SylLock plus (Sylvite)
    Excelis Maxx (Timac)
    Table 1 Herbicides, carriers and stabilizers used in the study

    Results

    Stabilizer Compatibility

    EC herbicides have active ingredients that are soluble in water and include immiscible solvents. When added at 2x label rate to chilled UAN, followed by a stabilizer, agitation created an acceptable suspension (Figure 1). The EC separated to the top of the mixture following an hour rest but was easily reintegrated. There was no appreciable residue left behind when poured through a 100 mesh screen.

    Figure 1 UAN + EC Herbicide + Stabilizer after 1 hour rest. Image A is a control with no stabilizer and image B is the same control after agitation. The arrow indicates where ECs separate at the top of each jar. All products resuspended with agitation.

    SC herbicides have active ingredients that are water insoluble, but stable in an aqueous environment. When added at 2x label rate to chilled UAN, followed by a stabilizer, agitation created an acceptable suspension (Figure 2). The SC flocculated and formed a sediment at the bottom of the mixture following an hour rest but was easily reintegrated. There was no appreciable residue left behind when poured through a 100 mesh screen.

    Figure 2 UAN + SC Herbicide + Stabilizer after 1 hour rest. Image A is control with no stabilizer and image B is the same control after agitation. The arrow indicates where SCs settled, as depicted in the inset images showing the bottoms of each jar. All products resuspended with agitation.

    Best Practices

    • Contact manufacturers and conduct a jar test to confirm compatibility
    • Ensure thorough agitation (with or without a stabilizer, and especially after tank has settled)
    • Components may separate to the top (ECs) or settle on the bottom (SCs)

    Mixing Order

    Mixing order was tested using chilled UAN, ATS, and EC herbicide. It is well known that ATS should be added last in the tank mix order, and mixes that include a higher load of ATS relative to UAN exacerbate tank mix issues.

    This is seen in the following video where we combine 203 ml of chilled UAN, 30 ml of SC corn herbicide and 68 ml of ATS. On the left, UAN, then herbicide, then ATS mixes perfectly. However, when we start with UAN, then add ATS (which represents premixed fertilizer) then the herbicide does not suspend, and prolonged agitation does not improve the situation. The video is shown at 2x speed.

    We then added a nitrogen stabilizer to the series to see if it could correct the tank mix issue arising from adding ATS immediately after UAN. This replicates the situation an operator would face when purchasing UAN and ATS premixed. We also reduced the ratio of UAN to ATS from 3:1, to 5:1 to 8:1 to establish a threshold ratio that alleviated tank mix issues (Figure 3). All solutions were poured through 100 mesh screens to capture residue (Figure 4).

    Figure 3 SC Herbicide and stabilizer added to UAN and ATS premixed at different ratios. Agitated after 1 hour and poured through 100 mesh screens (inset images).
    Figure 4 Pouring EC jar test solutions through 100 mesh screens

    Best Practices

    • Contact manufacturers and conduct a jar test to confirm compatibility
    • ATS must be added after the herbicide (EC or SC). The stabilizer can be added last, but preferably ATS is the last ingredient in the tank.
    • Adding stabilizer will not reverse a tank mix error arising from adding ATS prior to the herbicide.
    • The higher the concentration of ATS, the higher the risk of incompatibility. A 5:1 ratio of UAN to ATS failed while a ratio of 8:1 succeeded. The threshold is likely 7:1.
  • Spray Water pH

    Spray Water pH

    The scuttlebut on coffee row is that acidifying a spray mixture improves its efficacy. There are also claims that pesticides break down in the sprayer tank if the pH is too high.

    But it’s not that simple. Low pH has a strong impact on pesticide solubility, and that means mixing and cleanout are affected. Acidifying the mixture can have profound negative effects for many products.

    It’s important to know what you’re doing.

    What is pH?

    pH is defined as the negative log of the molar concentration of hydrogen ions in a water-based solution. The more abundant the hydrogen, the lower the pH. It’s a log scale, so every unit of pH refers to a 10-fold change in the concentration of hydrogen ions.

    Both very low (acidic) or very high (basic) pH can be caustic. But having a low or high pH doesn’t mean it will burn your skin or clothes right away, it might just be a bit unpleasant. But at the extreme ends, protection is needed.

    Why is pH Important in Spray Mixtures?

    In spraying, the main effect of pH is on the pesticide’s solubility. Solubility matters when mixing and becomes important during cleanout as well.

    A minor effect on pH, at least for herbicides, is on chemical breakdown, usually through hydrolysis, when the pH is too high. The effect on breakdown is rarely meaningful during any given spray day, but may play a role if a spray mix is stored overnight or longer.

    The Basics: Strong vs Weak Acids

    Strong acids like hydrochloric acid (HCl) ionize completely in solution. When added to water, only H+ and Cl are present, there is no HCl. The water’s pH does not affect solubility of a strong acid.

    But weak acids do not completely ionize. The water pH affects the degree of ionization and therefore solubility.

    Most herbicides are weak acids. A weak acid is one that does not dissociate completely in solution. A typical example of a weak acid functional group is carboxylic acid (-COOH). In solution, compounds with a carboxylic moiety exist in an equilibrium, with some as -COOH (containing the hydrogen, also called “protonated”) and others as -COO and H+. In the dissociated form, the acid is more water soluble than in its protonated form due to the negative charge that makes it ionic.

    Weak acids have a dissociation constant known as the pKa. When the solution is at the molecule’s pKa, the acid is 50% dissociated. When the solution has a lower pH than the pKa, there is less dissociation and the protonated forms of the molecule dominate. That has two important implications for herbicides.

    • the molecule becomes less water-soluble at lower pH
    • the molecule has fewer opportunities to interact with positively charged items

     pH Dependent Solubility

    Water-solubility is a two-edged sword. On the one hand, having a highly water soluble product makes it easier to dissolve in water. This pays dividends when mixing a batch or cleaning a sprayer because a product formulated as a solution will easily go into a true solution and will stay mixed. Examples are glyphosate, glufosinate, and salts of 2,4-D, MCPA, and dicamba.

    On the other hand, most pesticides need to enter a plant to reach their site of action. And a plant cell, with its waxy cuticle and oily membranes, creates an effective barrier for water, and for water-loving molecules dissolved in it. As a result, a formulation that allows the water-soluble product to interact with an oily barrier is needed.

    The products that can do this are surfactants. Acting like detergents, surfactants have regions in their structure that are oil-loving (lipophilic) and other regions that are water-loving (hydrophilic). Surfactants can therefore bind to both oil and water and provide a bridge for water-soluble products across oily barriers.

    That’s also one of the reason that the most water-soluble products such as glyphosate and glufosinate contain a lot of surfactants in their formulation, reducing the concentration of active ingredient in the jug and possibly leading to foaming with agitation.

    Pesticides have a wide range of solubilities, and for some, water pH will play an important role. Below is a table of some water solubilities of selected herbicides.

             Solubility (ppm)
    Trade NameActive IngredientMode of Action GrouppH ~ 5pH ~ 7pH ~ 9
    Selectclethodim1535,45058,900
    Ally 2metsulfuron25502,800313,000
    Expresstribenuron2482,04018,300
    Pinnaclethifensulfuron22232,2408,830
    Everestflucarbazone244,00044,00044,000
    Simplicitypyroxsulam21632,00013,700
    Frontlineflorasulam20.1694
    Varrothiencarbazone2172436417
    Raptorimazamox2116,000 >626,000>628,000
    Pursuitimazethapyr22,570 12,8707,500
    2,4-D2,4-D salt429,93444,55843,134
    dicambadicamba salt4>250,000>250,000>250,000
    Roundupglyphosate9>500,000>500,000>500,000
    Libertyglufosinate10>500,000>500,000>500,000
    Heatsaflufenacil14302,100 >5000
    Distinctdiflufenzopyr19635,90010,550
    Infinitypyrasulfatole274,20069,10049,000

    Compare the solubility at pH 7 to that at pH 5. For most of these herbicides, water solubility is worse at lower pH. That is because they are more protonated and become more lipophilic.

    I’ve placed a lot of Group 2 products in this table because those products are most often implicated in tank cleanout issues. All Group 2 products in this table, with the exception of Everest (flucarbazone-sodium) have lower solubility at pH 5 than they do at pH 7. For some, like pyroxsulam and floarsulam, it’s a big change. Those products, when acifified, are prime candidates for poor mixability and poor cleanout.

    When it comes to dicamba, low pH has another side-effect. It makes the molecule more volatile, increasing danger to sensitive plants nearby. For that reason, acidification of dicamba in its Xtendimax and Engenia formulations is not permitted.

    Note that the Group 4 examples, 2,4-D salt and dicamba salt, as well as glyphosate and glufosinate, are highly water-soluble and pH has very little effect on that.

    Particularly for glyphosate, the claim that it becomes more oily at low pH and will therefore be taken up more easily, is not supported by these data. Considering that the most acidic pKa for glyphosate (it has four acidic groups) is 0.8, pH would need to be much lower for any noticeable impact on oilyness.

    Tank Mixability

    Given today’s environment of herbicide resistance, applications with multiple mode of action tank mixes are very common. Acidifying a spray mix to benefit one herbicide may create problems for its tank mix partners.

    If there is a concern that spray water is too alkaline, it is recommended that the pH of the finished spray mix be measured. Since many herbicides are weak acids, they will lower the pH of the mixture by themselves. For example, the addition of glyphosate to water with pH 7.5 will drop the pH to about 5 or so, depending on the water’s buffering capacity.

    As a result, glyphosate tank mix partners that are pH sensitive may suffer in the presence of glyphosate, and pH may actually need to be raised.

    pH Dependent Half-life

    Herbicides

    There are a lot of claims that pesticides break down rapidly in alkaline spray water. And yet, in my career working primarily with herbicides, I do not recall this ever being a problem in practice.

    Below is a table of herbicides for which I could find half-life information, with the help of this comprehensive list produced by Michigan State University.

    ProductActive ingredientHalf Life
    AtrazineatrazineMore stable at high pH
    BanveldicambaStable at pH 5 – 6
    BromoxynilbromoxynilpH 5 = 34 d; pH 9 = 1.7 d
    Fusiladefluazifop-p-butylpH 4.5 = 455 d; pH 9 = 17 d
    Libertyglufosinate-ammoniumStable over wide range of pH
    GramoxoneparaquatNot stable at pH above 7
    ReglonediquatpH 5 = 178 d; pH 7 = 158 d; pH 9 = 34 d
    MCPAMCPApH 9 = < 5 days
    PoastsethoxydimStable at pH 4.0 to 10
    PrincepsimazinepH 4.5 = 20 d; pH 5 = 96 d; pH 9 = 24 d
    ProwlpendimethalinStable over a wide range of pH values
    RoundupglyphosateStable over a wide range of pH values
    TreflantriflularinStable over a wide range of pH values
    2,4-D2,4-DStable at pH 4.5 to 7

    Note that all of the herbicides are relatively stable. Some are a bit less stable at high pH, but none of the listed herbicides is in danger of breaking down on the day it is being applied. Only one is actually unstable at high pH – paraquat, a herbicide no longer registered in Canada and resticted in many other countries. Those with short half-lives experience them at quite high pH which are rarely seen in practice.

    Insecticides

    Insecticides are a different story. Several are very sensitive to pH. This table is again adapted from a comprehensive list published by Michigan State University, here.

    Trade NameActive IngredientHalf-life
    AdmireImidaclopridGreater than 31 days at pH 5 – 9
    Agri-MekAvermectinStable at pH 5 – 9
    AmbushPermethrinStable at pH 6 – 8
    AssailacetamipridUnstable at pH below 4 and above 7
    AvauntindoxacarbStable for 3 days at pH 5 – 10
    Cygon/LagondimethoatepH 4 = 20 hrs; pH 6 = 12 hrs; pH 9 = 48 min
    CymbushcypermethrinpH 9 = 39 hours
    DiazinonphosphorothioatepH 5 = 2 wks; pH 7 = 10 wks; pH 8 = 3 wks; pH 9 = 29 days
    Dipel/Forayb. thuringiensisUnstable at pH above 8
    DyloxtrichlorfonpH 6 = 3.7 days; pH 7 = 6.5 hrs; pH 8 = 63 min
    Endosulfanendosulfan70% loss after 7 days at pH 7.3 – 8
    FuradancarbofuranpH 6 = 8 days; pH 9 = 78 hrs
    Guthionazinphos-methylpH 5 = 17 days; pH 7 = 10 days; pH 9 = 12 hrs
    KelthanedicofolpH 5 = 20 days; pH 7 = 5 days; pH 9 = 1hr
    LannatemethomylStable at pH below 7
    LorsbanchlorpyrifospH 5 = 63 days; pH 7 = 35 days; pH 8 = 1.5 days
    Malathiondimethyl dithiophosphatepH 6 = 8 days; pH 7 = 3 days; pH 8 = 19 hrs; pH 9 = 5 hrs
    Matadorlambda-cyhalothrinStable at pH 5 – 9
    Mavriktau-fluvalinatepH 6 = 30 days; pH 9 = 1 – 2 days
    MitacamitrazpH 5 = 35 hrs; pH 7 = 15 hrs; pH 9 = 1.5 hrs
    OmitepropargiteEffectiveness reduced at pH above 7
    OrtheneacephatepH 5 = 55 days; pH 7 = 17 days; pH 9 = 3 days
    PouncepermethrinpH 5.7 to 7.7 is optimal
    PyramitepyridabenStable at pH 4 – 9
    Sevin XLRcarbarylpH 6 = 100 days; pH 7 = 24 days; pH 8 = 2.5 days; pH 9 = 1 day  
    SpinTorspinosadStable at pH 5 – 7; pH 9 = 200 days
    Thiodanendosulfan70% loss after 7 days at pH 7.3 to 8
    ZolonephosaloneStable at pH 5 – 7; pH 9 = 9 days

    Among insecticides, dimethoate, amitraz, and malathion stand out as breaking down rapidly in alkaline water. For these products in particular, it may be important to acifify the spray mix if there is any delay in spraying.

    Recommendations

    I’ve never been a fan of messing with solution pH unless recommended on the product label. Even when there is evidence that lower pH improves efficacy, consider the impact on tank mix partners.

    We’ve seen improvements in solubility and tank cleranout of Group 2 products with raised pH, and ammonia is the most cost-effective way to achieve that. But again, following label recommendations is strongly recommended. The consequences of changes in pH, particularly acifification, can be very detrimental. To be safe, consider doing a jar test before committing to a whole tank to a pH adjustment.

  • How to Interpret a Water Quality Test Result

    How to Interpret a Water Quality Test Result

    It’s common advice: Test your water before using it as a spray carrier. You dutifully sample the well or dugout and await lab results. And what comes back is a whole lot of numbers. How to make sense of it all?

    Three examples of water test results conducted by labs in Canada

    All three of these tests report a large number of properties and identify specific minerals and other solutes. Which ones are important in spraying? Here is the order in which I look at the numbers.

    Conductivity: This property is usually expressed as micro Siemens per cm (µS/cm) and simply identifies how many ionic solutes are in a sample (watch for alternate units such as mS/cm and convert if necessary). It doesn’t differentiate between any minerals or other molecules, and therefore has limited information. But it does tell us if there is a large or small issue with water quality. If conductivity is below 500 µS/cm, the water is probably good for spraying. If the value is around 1000 to 2000, further investigation is necessary. Some water samples return conductivity of more than 10,000 µS/cm, and it’s important to identify which salts are causing that problem.

    Note that Total Dissolved Solids (TDS) are often listed, and these are related to conductivity. A common way to get TDS is to multiply conductivity by 0.65. The conversion factor depends on which salts are dissolved but the bottom line is that TDS and conductivity are closely related.

    Bicarbonate: Bicarbonates are HCO3 and their concentration is measured in milligrams per Litre (mg/L), which is the same as parts per million (ppm). Bicarbonates can antagonize Group 1 modes of action and the common threshold is 500 ppm. Research at NDSU has shown that Urea -Ammonium-Nitrate (UAN or 28-0-0 liquid fertilizer) can reduce bicarbonate antagonism in some Group 1 herbicides.

    Bicarbonates are negatively charged and are associated with a positive ion, often the hard water cations sodium (Na), calcium (Ca) or magnesium (Mg). As such, waters that are high in bicarbonates are often also hard.

    Total Hardness (calculated): This is one of the important parameters. Hardness antagonizes most weak acid herbicides, most importantly glyphosate and g;ufosinate, and also ties up surfactants and emulsifiers which can result in problems with mixing and compatibility. Hardness is caused by metal cations, in order of strength these are iron (Fe++), magnesium (Mg++), calcium (Ca++), sodium (Na+), and potassium (K+). Of these, Mg and Ca are typically most abundant, although some water is high in Na.

    The Total Hardness (ppm) reported in water tests is done by taking the most common two cations, calcium and magnesium, and using this formula: 2.497*Ca + 4.118*Mg. Note that some tests report hardness in Grains per Gallon, in this case, multiply grains by 17.1 to get ppm.

    While this calculation usually gives an accurate prediction of hardness, you may need to have a look at iron and sodium as well. Iron is less common, but some well waters are high in sodium or potassium. These minerals are not captured in the Total Hardness measurement. A water test low in Total Hardness may still be high in sodium, these are typically the samples with high conductivity.

    The threshold for Total Hardness depends on the herbicide, its rate, and the water volume. The most common quoted values are 350 ppm for the lower rates of glyphosate (1/2 L/acre equivalent), and 700 ppm for the higher rates. Lower water volumes increase the concentration of herbicide, and reduce the impact of water hardness or bicabonates.

    pH: This parameter is a bit over-rated because it is later affected by the herbicide and adjuvant dissolved in it. There is usually no concern with pH between 6 and 8, and water is rarely outside this range. It is best not to change the pH of water unless it is required on the label for mixing, because some products require low, and others require high pH for optimum solubility. Compatibility is an ever greater concern as our tank mix complexity increases.

    Water Conditioners

    The most common water conditioner is ammonium sulphate [AMS, (NH4)2 SO4]. In its pure form (21-0-0-24), a concentration of 1% to 2% w/v (8 to 17 lbs AMS/100 US gallons of spray water) solves most hard water and bicarbonate issues. Be cautious of using too much AMS (>3%), when added at high concentrations to some herbicides it can burn crops.

    Research has shown that AMS works in two ways: The sulphate ion binds with hard water cations, forming an insoluble precipitate that prevents the antagonistic cations from binding to, and inhibiting, the herbicide. The ammonium ion has been shown to improve cellular uptake by weak ion herbicides.

    Some product labels call for UAN as an adjuvant. UAN contributes ammonium, but not sulphate ions. As a result, while it may improve herbicide performance, it does not remove antagonizing cations from the mixture.

    Acids have been used to combat hard water. Most common herbicides are weak acids, and the acid constituent, usually a carboxilic acid, has a unique pKa. The pKa is the pH at which half the molecules are protonated (contain a hydrogen atom, resulting in an uncharged acid constituent) and the other half are not protonated (negatively charged). If the spray mixture has a pH below the pKa, the weak acid herbicides become protonated. This means the herbicide becomes less water-soluble, but also that it has less chance of interacting with a hard water cation. Acids that work in this way are less effective at ameliorating the effect of hard water than AMS.

    A small group of acids that includes citric acid and sufphuric acid can sequester or bind with hard water cations. But they do not contribute the ammonium ion that assists in weak acid herbicide uptake.

    If your water is questionable for spraying, there are four common choices:

    • Select a different well or dugout
    • If the problem is barbonates or hardness, treat water with a conditioner such as Ammonium Sulphate (AMS), available in pure form as 21-0-0-24. Some acids (citric, sulfuric) can form conjugate bases with hard water cations, removing them from solution. But the associated significant lowering of pH should be treated with an abundance of caution as it may affect solubility of some pesticides.
    • Reduce water volumes or increase herbicide rates.
    • Use a municipal treated water source or invest in a reverse-osmosis (RO) system. RO is neither cheap nor fast and requires additional investment in storage, and a way to deal with solute-enriched waste water. But it may be the best option for some.

    An Ammonium Sulphate calculator, originally developed by Winfield United using data from NDSU, can be downloaded here:

    An excellent resource for adjuvant and water quality topics is this addendum in the North Dakota State University Guide to Weed Control.

    Using good quality water lowers the likelihood of problems with mixing and overall performance and that pays significant dividends later.

  • Green-on-Green in Ontario: A Custom Operator’s Experience with See & Spray Premium

    Green-on-Green in Ontario: A Custom Operator’s Experience with See & Spray Premium

    In the summer of 2025, Todd Frey of Clean Field Services (Drayton, Ontario) and I participated in the Elora Weeds Tour. We discussed his new John Deere See & Spray Premium and the practical considerations for implementing green‑on‑green spraying in Ontario (Figure 1). With that first season squarely in the rearview mirror, I reached out to Todd to ask about his experience.

    To be clear, we had a lot of questions then and we still have questions now… but we’re optimistic. This article summarizes the original topics from the Weeds Tour, Todd’s 2025 learnings, and considerations for the year ahead.

    Figure 1 – JD See and Spray Premium at the 2025 Elora Weed Tour. Todd Frey (left) and Brendan Bishop

    Challenges Identified in 2025

    Label Language and MRL Constraints

    Optical spraying introduces uncertainties when interpreting pesticide labels written for broadcast applications. For example, an operator might elect to concentrate a herbicide beyond the common broadacre rate while technically adhering to the label. Depending on the active, this risks excessive residue levels that can cause crop replant issues. A few Canadian labels already address this grey area by specifying water-to-product ratios in addition to per‑hectare limits. Most do not.

    Australia’s experience offers a possible way forward: optical systems in Australia are commonly calibrated at 100 L/ha (~10 gal/ac), and labels specify whether they permit higher concentrations for spot and patch spraying. Additionally, most labels state the operator must revert to a conventional broadcast application when fields have more than 30% weed cover.

    Tendering and Mixing Logistics

    Estimating product and water needs is, perhaps, one of the most difficult operational challenges. Traditional field scouting cannot accurately predict how much spray solution an optical sprayer will apply. This leads to logistics issues, increased risk of unnecessary leftovers, and subsequent disposal/clean out problems.

    Nozzle Availability and Performance

    Nozzle choice is central to realizing the full benefit of precision application. Ideally, operators require low‑drift, narrow‑angle nozzles with an appropriate dynamic range (i.e. travel speed vs. flow rate) to spray small weeds efficiently. Perhaps it goes without saying that a stable boom is critical in this equation, but we’ll say it anyway. Nozzle options are currently limited and we’ve written about this subject in a previous article.

    Cost–Benefit Realities

    While herbicide savings are an obvious appeal, the actual economics are more nuanced. The See & Spray Premium model adds a $6/acre CDN fee for unsprayed acres, which can diminish savings in very clean fields. A fall broadcast herbicide application improves the success of spring green‑on‑green passes, but this added cost must be figured in. Of course, there are many other benefits to a fall burndown that shouldn’t be dismissed, and you can read about them here.

    On the other hand, perhaps good agronomy should be the motivating factor. Any savings from reduced broadcast spraying may allow operators to upgrade to more effective, higher‑value tank mixes, improving weed control and contributing to long‑term seedbank reduction. Regarding the later point, there have been recent studies that suggest using low sensitivity may adversely affect the seedbank.

    New Chemistry Possibilities

    It’s a stretch, but there could be a silver lining to increasing herbicide costs and resistance pressures: chemistries once considered too expensive for broadcast use could become economically viable for spot or patch applications. This would expand chemical options.

    The 2025 Experience

    Cost savings

    To evaluate performance under Ontario conditions, Todd conducted a structured trial on his own 125‑acre corn field. In 2024 the field received a fall application targeting annual grasses and broadleaf weeds. Todd’s intention was to leave perennial sow-thistle and Canada thistle for targeted control in the spring.

    He used the See & Spray Premium to apply Lontrel + glyphosate at 13 GPA. The John Deere Operations Center map (Figure 2) shows a distinct high‑pressure zone in red. This corresponds to 2–3 acres recently reclaimed for production —significantly weedier (Figure 3) than the remaining acreage (Figure 4). This work was performed using the Deere TSL8005 nozzle, with sensitivity set to 3 (medium) and buffers set to medium in both directions.

    Figure 2 – John Deere Operations Center weed pressure map
    Figure 3 – High weed pressure in the reclaimed section of the field
    Figure 4 – Low weed pressure in the majority of the field

    Download a copy of the as‑applied data. You’ll see the See & Spray treated only 25.8% of the field. If Todd had broadcasted Lontrel at 65 mL/ac and charged his typical $14.50/ac it would have cost $4,139.36. However, even with his premium spot-spray rate of $17/ac and passing on the $6/ unsprayed acre, the total cost was $3,507.96. This represents a net savings of $631.40, and the surprise twist: he used the 100 mL rate of Lontrel and still saved money.

    So, in fields with moderate but uneven perennial pressure, See & Spray Premium can produce meaningful savings while enabling more robust chemistry.

    Scouting Limitations

    As expected, visual scouting underestimated real weed density. Figure 4 might seem clean at first blush, but the cameras see a different story hidden in the stover (Figure 5). This is why predictive tank‑mix planning is unreliable.

    Figure 5 – Weeds may hide from a scout, but not from clever optics.

    Optimizing Tendering Through Job Planning

    Todd found that the best approach to minimizing leftovers was to group farms with similar pre‑emerge programs and weed spectra. He would then book them from the smallest to the largest fields, allowing leftover spray mix from smaller jobs to feed into larger ones. His goal was to finish with <5 acres worth and broadcast it at the end of the last job.

    This kind of planning starts with the fall burndown and should be firmly in place by March. It’s already challenging to accommodate last-minute requests during spring spraying, but this approach makes it particularly difficult.

    Customer Scheduling Challenges

    There was some frustration along the learning curve. A few customers experienced delays waiting on sprayer availability and then paid the premium on a field that ended up requiring a broadcast application. Experience will help refine expectations and scheduling.

    Looking Ahead: 2026 and Beyond

    In 2025, the See & Spray machines in Ontario sprayed mostly soybean, but in Todd’s region it was predominantly corn. One reason was that most of his soybean customers weren’t quite sold on the fall application. Todd has plans to get into soybeans in 2026, but his strategy involves IP beans.

    Traditionally, IP beans get a spring application timed to catch as many weeds as possible, perhaps too late for some and too early for others. Then Todd takes his phone off the hook as customers fret over burned beans while they inevitably grow out of the visual injury. But this time, Todd will make two targeted passes with a more expensive tank mix to do a better job of controlling weeds at the right stage, while avoiding burning the IP beans. If his projections are correct, he believes he can accomplish this more economically than a single broadcast pass.

    We’ll update this article with the outcome. Be sure to check back and see if he succeeds 🙂

    Conclusion

    Ontario’s early experience with green‑on‑green optical spraying suggests that while the technology is promising, it requires substantial logistical planning, label awareness, and nozzle optimization. Under the right conditions—particularly where weed pressure is irregular but significant—operators can achieve both economic savings and precise weed control.

    As adoption increases and equipment evolves, we’ll learn more about where spot and patch spraying technology fits in changing weed management programs.

    Thanks to Todd for sharing his experience and insights.

  • Ecorobotix’s ARA Sprayer: A targeted sprayer that’s finding its place in Ontario vegetable fields

    Ecorobotix’s ARA Sprayer: A targeted sprayer that’s finding its place in Ontario vegetable fields

    Targeted spraying is a technology that enables the site-specific application of plant protection products and liquid fertilizers based on sensor readings. Some of the latest machines incorporate computer vision and processing capabilities that can distinguish between different types of weeds and crops based on multiple adjustable criteria.

    The Swiss-made ARA Sprayer by Ecorobotix, has recently generated significant interest among Ontario growers. This article provides a technical overview of the machine, including a detailed explanation of its main features and capabilities.

    The Sprayer

    The sprayer is a two-component system, mounted directly onto the front and back of a tractor. The front unit consists of two separate tanks: one dedicated to the chemical solution and the other to fresh water, which can be used for rinsing or refilling the chemical mixture tank. The front component also includes the pump and processing unit (Figure 1).

    Figure 1- Front-mounted unit.

    The boom section is mounted via three-point hitch to the rear of the tractor (Figure 2). The shrouded boom folds for transport and storage and features 156 individually controlled nozzles (Figure 3).

    Figure 2- Rear unit deployed.
    Figure 3- Closeup of the boom.

    The unit can be controlled and monitored from a tablet or smartphone connected through the machines’ own Wi-Fi. External data connection through internet is only required for occasional maintenance and updates but not for regular field operations. Regardless of the complexity embedded in the smart operating system, the interface is intuitive and easy to manage. Most of the parameters are automatically optimized by the software (Figure 4).

    Figure 4- Tablet interface.

    Capabilities

    Since the intelligent vision system acts as the central controller for each individual nozzle, it enables a wide range of operating modes and potential applications. Depending on user needs, the system can process information and respond in various ways. The following list outlines the currently available and tested features, which may be expanded in the future.

    Banded Spraying

    In this mode, parallel bands of variable width are sprayed, which might include or exclude the crop (Figure 5), depending on the objective. The lines are defined based on AI detecting a planting pattern, which will lead to the automatic definition of the spraying swaths.

    Figure 5- Banded application options: in-row or inter-row.

    Size-Exclusive Spraying

    This option allows targeting the spray based on the plant size. It can either be used to:

    • Detect and spray weeds larger than a small emerging crop.
    • Detect smaller emerging weeds in an advanced-stage crop. Weeds similar in size or larger than the crop will be missed in this case. (see figure 6 – left).
    • Spray only the crop with fertilizers or pesticides when no-specific algorithm has been developed to differentiate it from the weeds. The crop must be significantly larger or smaller than the weeds for this mode to work efficiently. (see figure 6 – right)
    Figure 6- Only plants smaller (left) or larger (right) than a specified target are sprayed.

    Green on Brown Spraying

    The machine will spray all detected green material (Figure 7). This is particularly useful for improving chemical use efficiency in stale seedbed and insecticide applications. It also offers an interesting option to reduce the risk of herbicide carryover in pre-plant, post-weed-emergence control, especially when weed cover is low and the product may persist in the soil long enough to affect the crop.

    Figure 7- Green on brown spray.

    Green on Green Spraying (Six Scenarios)

    The vision system and processing capabilities can identify the crop, distinguish it from weeds, and selectively target either, regardless of plant size. Additionally, a variable safety buffer can be defined to determine how close a spray can be applied to the nearest crop leaf. If this feature is inactive, any overlapping weeds will be sprayed, even if the herbicide contacts the crop. If active, the sprayer will avoid targeting weeds that are closer than the defined safety buffer distance, which can be set up to 16 cm (6.3”).

    The parameters can be configured to cover six difference scenarios:

    1. Selective herbicides when no safety buffer is required

    All weeds will be sprayed, regardless of their proximity to the crop. If they’re very close, the crop might receive part of the spray (Figure 8). This mode is suitable for selective herbicide applications.

    Figure 8- Herbicide application with zero safety buffer.

    2. Non-selective herbicides when the contact with crop canopy should be minimized

    In this case, depending on the potential damage caused by the chemical contacting the crop, a variable buffer can be programmed. Only weeds that can be sprayed while maintaining the defined buffer distance from the crop will be targeted (Figure 9). Inevitably, weeds in very close proximity or overlapping with the crop will be missed.

    Figure 9- Weed target spray with a safety buffer.

    3. Crop-targeted spray

    The machine will detect the crop and will not spray anything else (Figure 10). This can be useful for insecticide or foliar fertilizer applications.

    Figure 10- Crop-targeted spray.

    4. Application of weed pre-emergence herbicides post-crop-emergence

    In this case the entire surface, except the crop canopy is sprayed (Figure 11). It can be utilized to spray herbicides with soil residual activity post crop emergence.

    Figure 11- Pre-emergent herbicide application excluding the crop/

    5. Monocots vs dicots weeds differentiation

    This mode is limited only to onion fields for now. It can be configured to spray only monocots weeds (grasses, sedges) or only dicots weeds (broadleaf). This can be useful to increase the efficiency of post-emergence broadleaf or grass selective herbicide applications.

    6. Specific weeds targeted

    In this mode only the target weeds will be sprayed. As of now, it’s only available for thistles, docks, and common ragwort. It can be used when a specific herbicide is used to target hard-to-control species.

    Speed and Accuracy

    For all applications, the company claims to have a spray accuracy of 6 cm by 6 cm (2.4”x2.4”). The speed of operation will be dependent on the weed size. The larger the weed size, the lower the recommended speed to allow for an optimal spray coverage of the weeds, increasing the treatment efficacy. The speed operating range is 0 to 7.2 km/h (0-4.5 mph).

    Weed coverage or density does not affect the maximum recommended speed, as the machine can process images at such high rates that it is capable of scanning and spraying 100% of the area when moving at full speed. In other words, the processing unit does not need to slow down to detect, differentiate, and target weeds, even when they are present at very high densities.

    Ecorobotix claims the machine can cover 2.8-3.2 ha (7-8 acres) per hour under typical conditions and can run 24/7 independent of light conditions.

    Crop Portfolio

    As of August 2025, the company has developed the following algorithms for specific crop recognition:

    Vegetable Crops:

    • onion
    • carrot
    • lettuce
    • endive/chicory
    • beans
    • spinach
    • broccoli (beta)
    • cauliflower (beta)
    • leek (beta)
    • other cabbages (beta)
    • potatoes
    • sweet corn

    Field Crops:

    • sugar beet
    • rapeseed (canola)
    • corn
    • soy (beta)
    • cotton (beta)
    • wheat (beta).

    For the crops not listed, the equipment can still be used but not with the features that required crop identification for targeted sprays.

    Technical Specifications

    • Minimum weed size required for weed detection: 4 x 4 mm.
    • Maximum plant height: 40 cm.
    • Minimum crop size for proper identification: at least two true leaves.
    • Minimum tractor power: 90 HP
    • PTO: 540 RPM, 4 HP (3 kW) max
    • Three-point hitch: cat 2 front and back.
    • Weight:
      • Front unit: 705 lb or 320 kg (empty), 2,645 lb or 1,202 kg (full)
      • Rear unit: 2,257 lb or 1025 kg
    • Dimensions (Figure 12):
      • Front unit: 5’7” x 4’7” x 5’7” (W x D x H)
      • Rear unit: 21’4” x 8’10” x 4’3” (W x D x H)
    Figure 12- Dimensions.

    Cost of Purchase and Operation

    At the time of writing, the purchase cost for a complete unit is around $300,000 USD, depending on the algorithms purchased and shipping fees. In the following years, there is an annual fee associated with the operating system maintenance and development. The basic subscription includes algorithms for three crops, as well as access to all beta-stage models currently in development. Additional crop algorithms can be purchased. For accurate pricing, contact their Canadian partner, Univerco.

    According to the manufacturer, the equipment does not require regular replacement of expensive components beyond standard sprayer preventative maintenance. While some components are standard and readily available, the company also keeps a regular stock of specialized parts at its warehouse in Pasco, WA, available for immediate shipping. Comprehensive service and maintenance support is provided locally by Univerco.

    Testimonial

    Wendy Zhang is the head agronomist for Keejay farms. She oversees more than 5,000 acres of diverse vegetable crops, predominantly carrot and onions. In her own words, the machine is “easy to operate, very accurate, and fast enough for a large-scale farm.” She also highlighted substantial savings on chemicals and the significant advantage of being able to safely spray close to the crop using products that cannot be broadcasted due to the risk of unacceptable crop damage.

    The most important benefit, she says, is the ability to apply treatments very close to the crop canopy, using effective rates and chemistry without compromising crop safety. No other practical tool offers this capability. A clear demonstration of its effectiveness is that no other spray equipment is currently being used for their large onion operation.

    The Grower Magazine published an excellent article about this machine, featuring other grower testimonials.

    Thanks to Olivia Soares de Camargo, Business Development Manager at Ecorobotix, for providing much of the information used in this article.