Category: Spray Basics

  • Fundamentals of Spray Drift

    Fundamentals of Spray Drift

    The year 1989 marked my first spray drift trial under the watchful eye of Dr. Raj Grover and John Maybank. We evaluated the performance of several spray shrouds, Flexi-Coil, AgShield, Brandt, and Rogers, and wanted to measure just how effective they were. But in my heart I wasn’t interested in drift. I wanted to study herbicide efficacy. Anyway, I thought, we’ll do this trial and I’m pretty sure we won’t have to revisit the topic.

    It’s now thirty-two years later and spray drift has interwoven itself into all my projects, remains one of the most powerful drivers of regulatory activity, is likely the most visible consequence of poor stewardship, and will stay as one of the dominant creators of public opinion around modern agricultural practice.

    Drift has not gone away. And yet our understanding of it is far from complete.

    Spray drift is defined as the wind-induced movement of the spray cloud away from the treated swath. Droplet drift can occur for all sprays, and it happens within minutes of the spray pass. Its cousin, vapour drift, is limited to active ingredients that are volatile, that is, they can evaporate from dry deposits after application. Vapour drift happens after the spray application is complete and can last several days.

    Droplet Drift

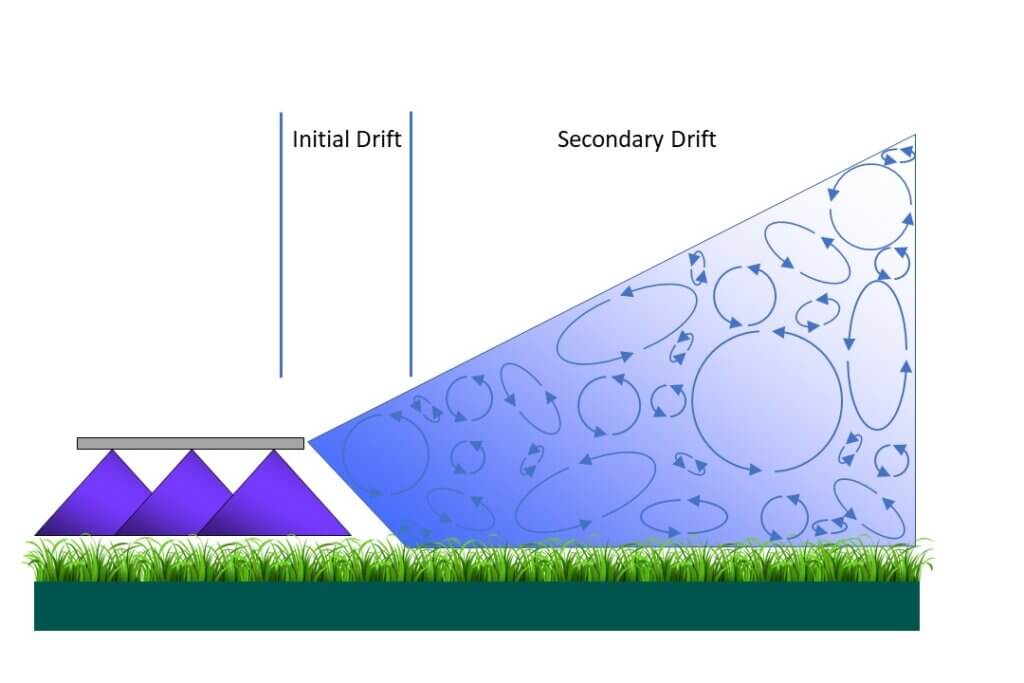
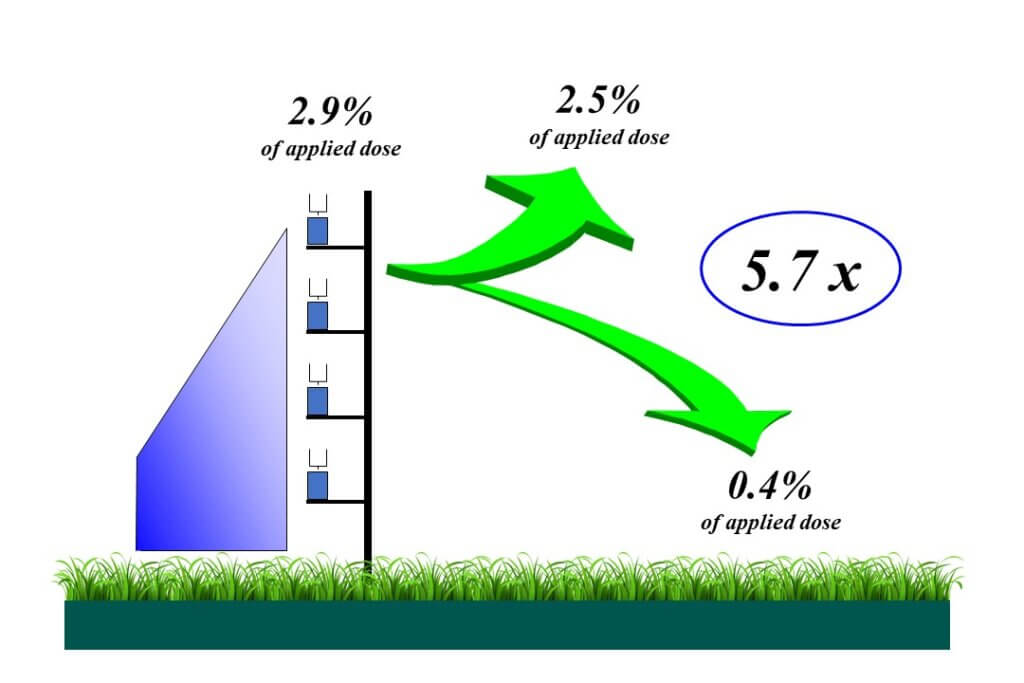
    Droplet drift can be divided into two phases that are separated by about 1 second and that are measured differently. “Initial drift” happens first and refers to the product that leaves the treated area immediately after atomization. It is airborne and can be measured by placing air-samplers (any device that can capture droplets in air) close to the downwind edge of the spray swath.

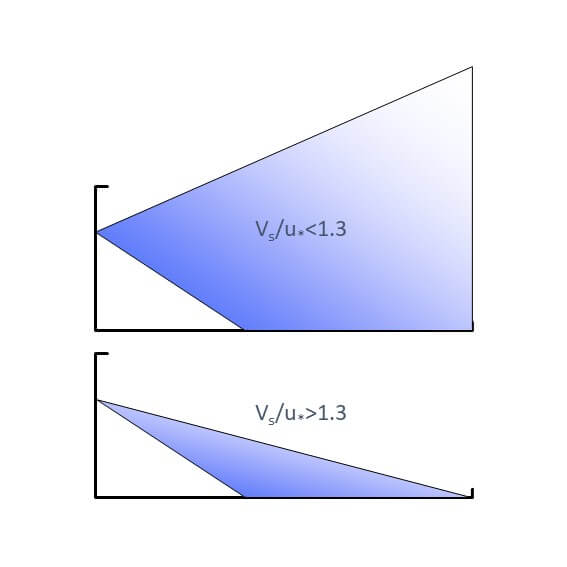
    Figure 1: Initial vs Secondary drift. Once the drift cloud leaves the treated swath, the relative strengths of turbulence and sedimentation determine the amount that remains airborne and the amount that lands downwind.

    Secondary drift describes the airborne spray cloud that continues to move downwind from the swath edge, where it either remains aloft or deposits on the surface below it. It is typically measured using samplers placed on the ground that capture sedimenting spray droplets. The difference in method is important because it goes to the heart of the problem of understanding spray drift.

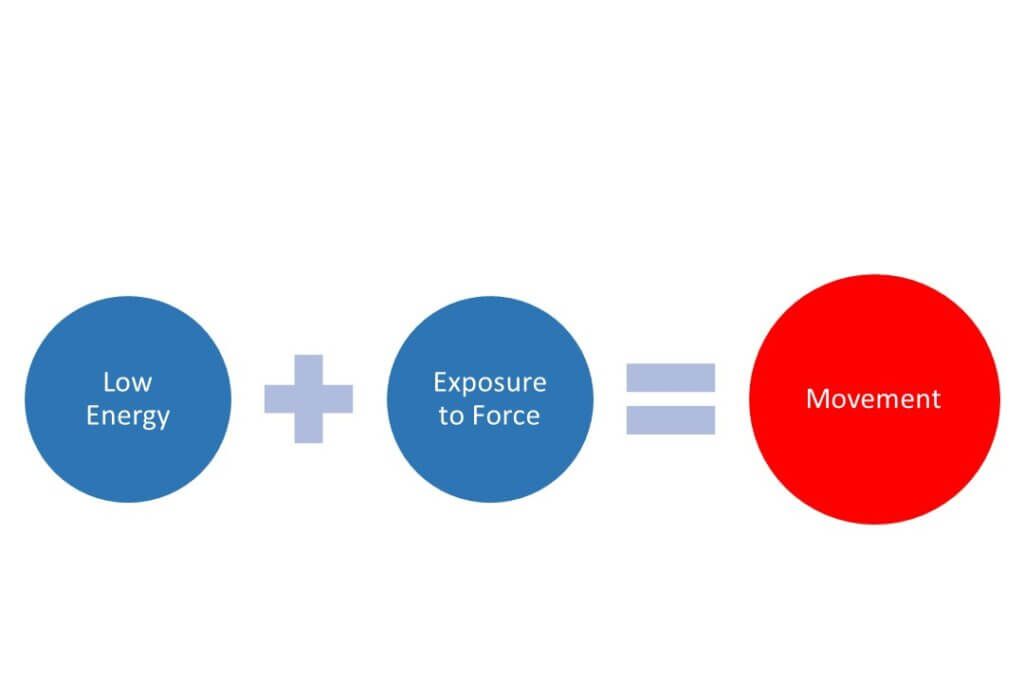
    Figure 2: Droplet drift occurs when displacement energy exceeds droplet energy. The droplet’s combination of mass and velocity cannot withstand the energy presented by moving air.

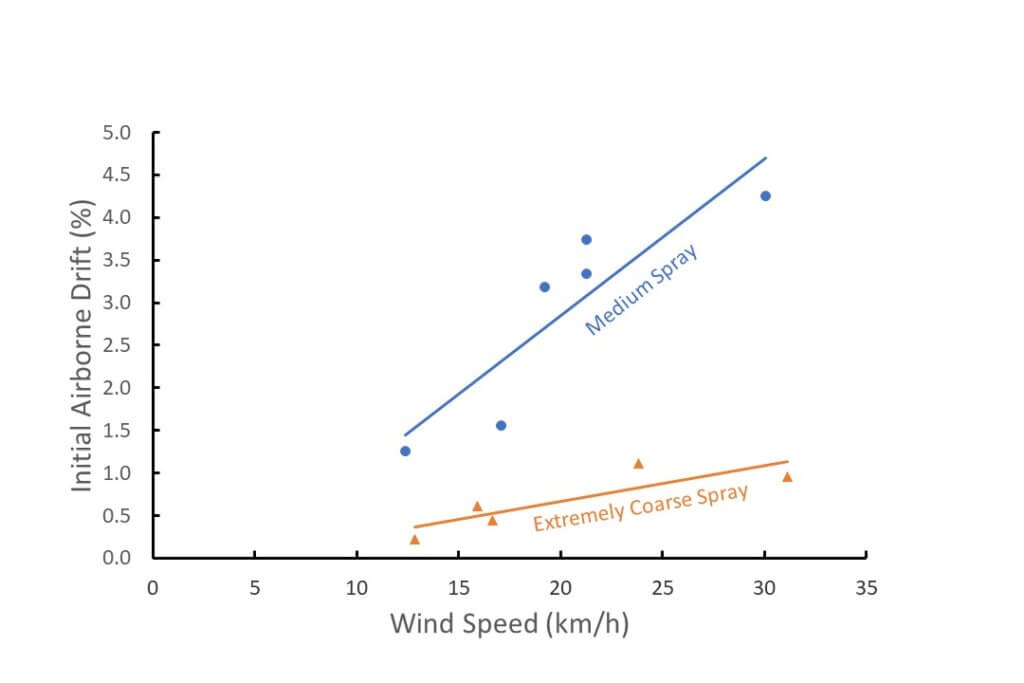
    Initial drift is actually quite easy to understand because its creation is intuitive. The displacement of droplets from the spray plume is a function of balancing two types of energy. The first, droplet energy, is the product of droplet diameter and velocity. The more energy in the droplets, the more difficult they are to displace, and that’s why larger, heavier droplets or fast-moving air assist are useful drift reducing tools.  The second, displacement energy, comes from relative air movement, either from forward travel speed or wind and the associated turbulence. More wind or turbulence means more power to displace.

     Figure 3: Initial drift follows an expected response to greater wind speeds and coarser sprays. Data from a pull-type sprayer travelling 13 km/h with 60 cm boom height.

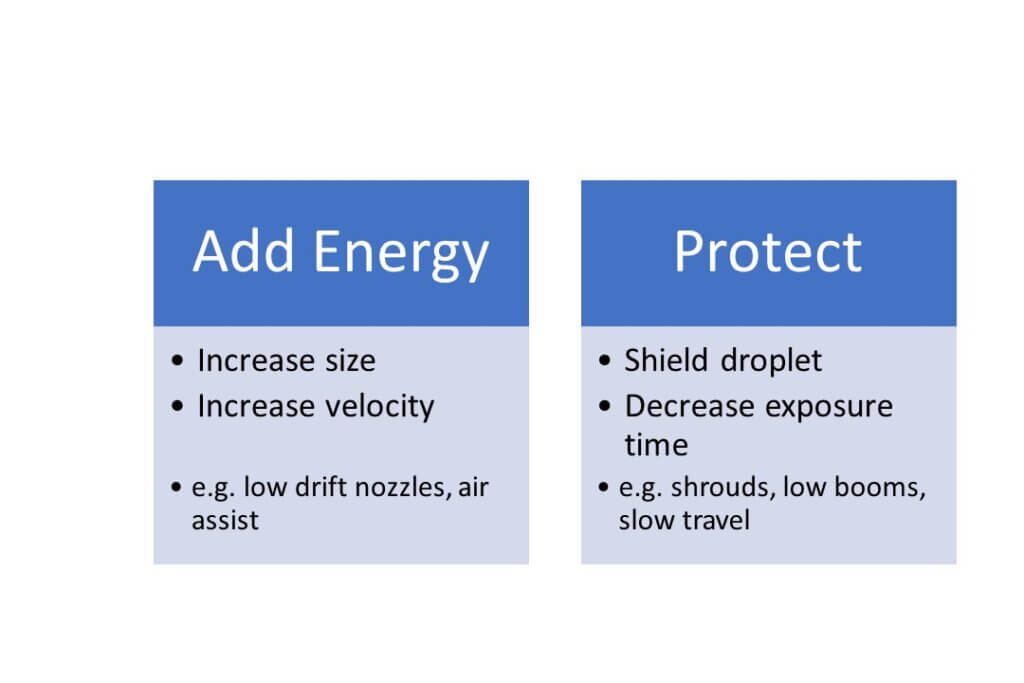
    Because initial drift is easier to understand, our most common advice for reducing drift is based on maximizing droplet energy and minimizing displacement energy. Lower booms, larger droplets, slower travel speeds, shrouds, or properly implemented air assist all help reduce initial drift. It makes sense that creating less initial drift will also reduce downwind deposition arising from secondary drift.

    Figure 4: Management of initial drift is intuitive. We reduce drift by adding energy to the droplet and by protecting the droplet from exposure to moving air.

    Downwind Deposition

    After leaving the spray swath, the moving secondary drift cloud has two main options. It can deposit or it can remain airborne. Basic physics suggest that all objects eventually fall to the ground, and since smaller objects need more time, they drift further. But when atmospheric turbulence and topography are considered, it’s not quite that simple. These two complicating factors control what proportion of the drift cloud remains airborne, and what proportion deposits.

    Drift trials show that about 20% of the initial drift amount returns to the surface within the first 100 m or so of the sprayer. The rest remains and rises in the atmosphere where it evaporates and gets mixed further.

    Figure 5: The majority of secondary drift remains airborne. Data are for Medium spray quality from a pull-type sprayer with 60 cm boom height and 13 km/h travel speed

    It happens quickly. Just 5 m downwind of the spray swath, the cloud is already 4 m tall. At 100 m downwind, we’ve measured its height to be 30 m.

    The proportion of the spray that remains airborne depends on the spray quality and the nature of the atmosphere. If it’s windy and sunny, or if the spray is finer, turbulence sends more into the air. If it’s cloudy and the wind is low, we have little atmospheric mixing. As a result, a smaller proportion will remain airborne and more will sediment, and overall, we may actually have more potential to damage downwind areas.

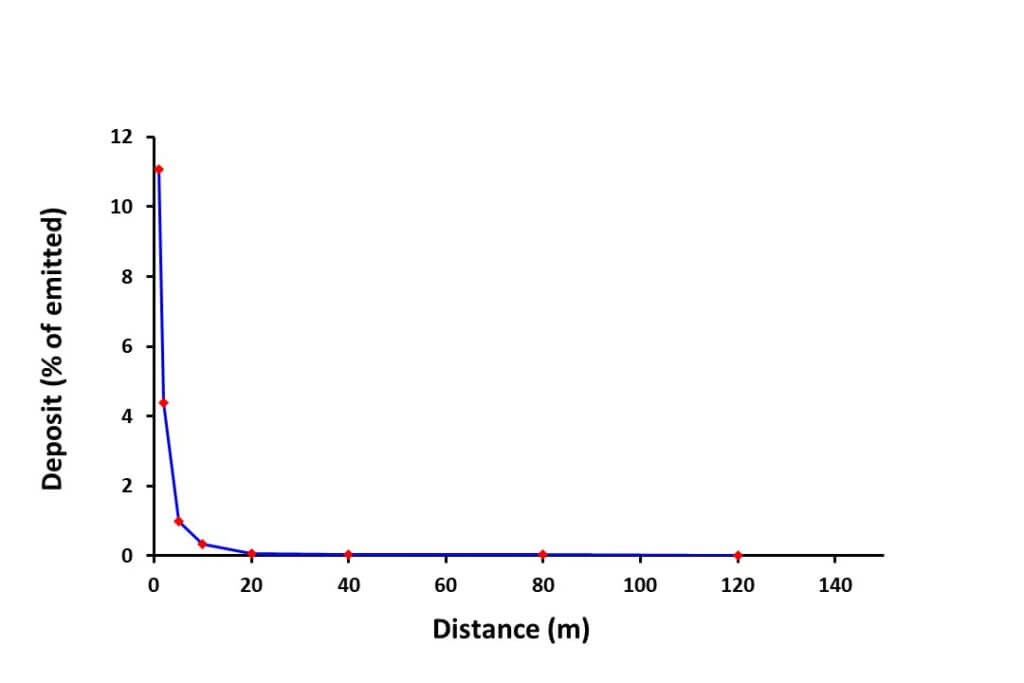
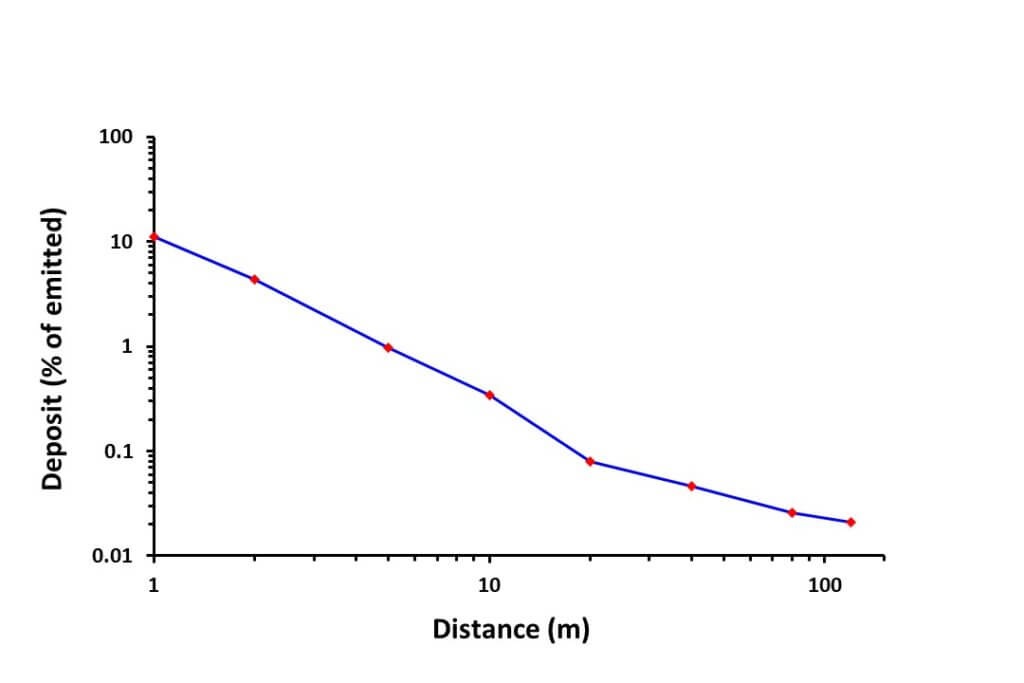
    When we graph spray drift deposit data from a windy day, the deposit amount decreases exponentially with downwind distance. Usually, drift damage follows the same pattern. The larger droplets that contain the majority of the dose deposit first. The smaller droplets go further and are more likely to mix in the atmosphere and rise with thermals.

    Figure 6: Deposited drift decreases logarithmically with distance. Top, linear axes. Bottom, log axes.

    Under temperature inversion conditions that are common on calm summer evenings, overnight, and early mornings, the damage from the drift cloud does not decrease the same way. The cloud containing the buoyant mist lingers over a large area. Without atmospheric mixing and its resulting dilution with time and distance, large areas can be damaged.

    The Effect of Turbulence on Deposition

    We’ve established that the more atmospheric mixing we have, the less spray will deposit on the ground, at least in the short term. How does this affect our thinking on the role of wind?

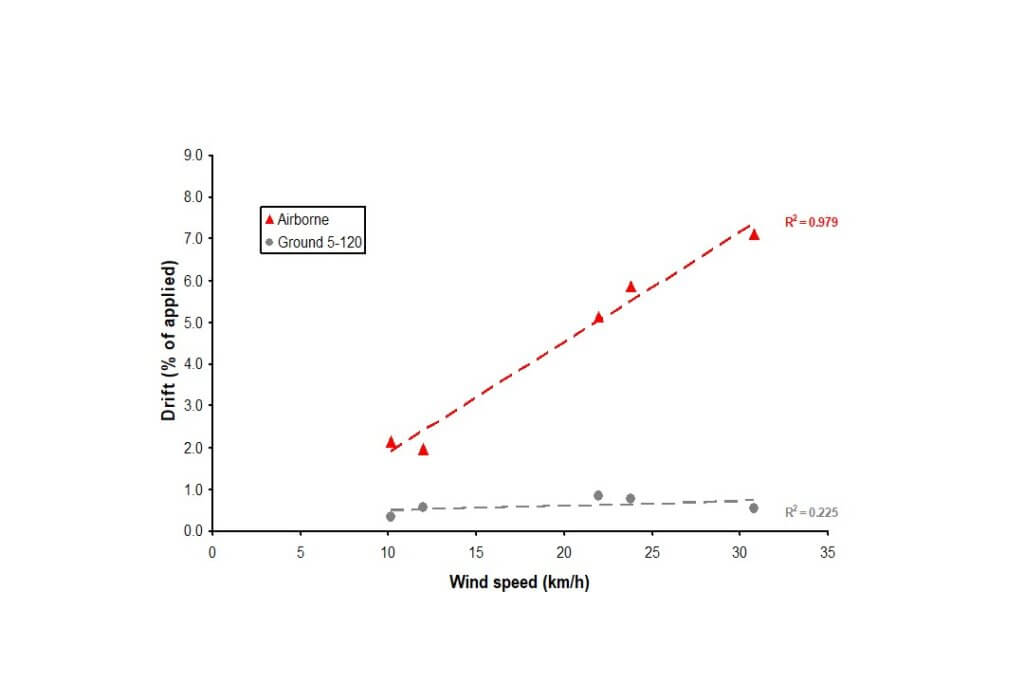
    When we evaluated drift data from a number of trials, we always saw more initial drift with higher wind speeds, as expected. However, the downwind deposit did not usually increase significantly. We attributed this observation to turbulence generated by wind which lifted more of the initial drift higher into the atmosphere. To be clear, deposited drift did not go down with higher wind. It just didn’t rise as fast as initial drift.

    Figure 7: The effect of wind speed on airborne drift (top line) vs deposited drift (bottom line) from a high clearance sprayer travelling 23 km/h and emitting a Very Coarse spray.

    The effect of turbulence can be viewed as a good thing because it protects downwind objects. Rapid dilution reduces immediate drift damage. We can use turbulence to protect objects on the ground. It’s certainly better than the alternative, emitting sprays when the atmosphere can’t dilute them, such as in an inversion. In that case, downwind areas remain at risk for a long distance, and for a long time.

    But we have to also consider what happens to airborne spray droplets. Some pesticides degrade in sunlight and stop being a problem. But others are more stable and may persist in the atmosphere for days or longer. During that time, they may move significant distances, ultimately returning to the earth’s surface in precipitation or in dust. Even though the atmosphere has diluted them, these deposits are measurable, and will show up in environmental monitoring of air, soil, and water.  We may not be able to find out where they originate, but the public knows who to blame. Agriculture.

    Vapour Drift

    Vapour drift is another issue altogether. It occurs hours and days after application, as long as the volatile product remains on a surface and conditions that allow formation of vapours persist. Vapour pressure is related to surface temperature, and losses increase with warmer surfaces. Some products enter the vapour phase when in contact with water, and release vapour after a rainfall.

    In situations where vapour is released for several days after application, it becomes impossible to control its subsequent movement. For droplet drift, if we know the wind direction at the time of spraying, we know where the impact is likely to be. But vapour movement depends on conditions that may occur between now and three days from now, and these could include high temperatures, various wind directions, and even inversions in which vapours accumulate. Ultimately, the best way to avoid off-target vapour movement is to avoid using volatile products.

    The Public Good

    Spray drift is one of agriculture’s most important stewardship challenges, and our industry needs to continue to improve its track record. Sprayers have a difficult task of converting a relatively small volume of liquid into a spray that offers good target coverage yet doesn’t move off the treated area. Favourable weather combined with droplet size management are at the heart of making this system work, but there isn’t a lot of wiggle room. Once again, an emphasis on sprayer productivity is one of the most fruitful areas to invest in, as this makes the best of the sometimes rare conditions in which spraying conditions are optimal.

  • Venting Liquid-Filled Pressure Gauges

    Venting Liquid-Filled Pressure Gauges

    Liquid-Filled or Dry?

    Small-plot agricultural sprayers should have a pressure gauge on the wand or boom to ensure accurate application rates. Most are added after-market and the operator has the choice of buying liquid-filled or dry gauges.

    Glycerine- or silicone-filled gauges are preferred because they dampen pressure spikes, pulsation and mechanical vibration. Compared to dry gauges, they are available in higher ranges and are less prone to moisture problems (which cause corrosion, accuracy and visibility issues).

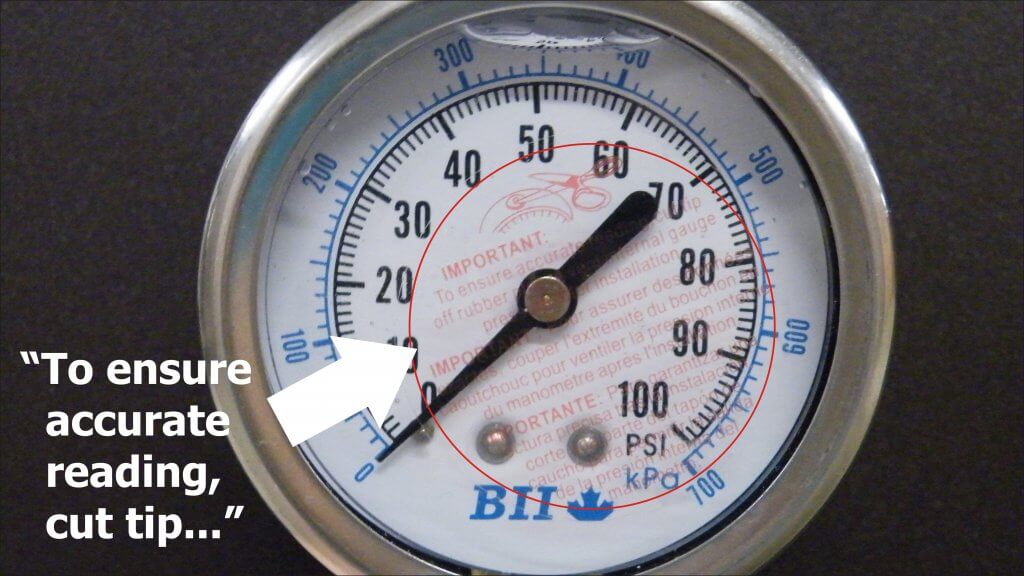
    We use 100 psi (~7 bar) liquid-filled gauges for our handheld sprayers. Only recently did we acknowledge the sticker affixed to the glass advising the user to cut the nipple off the rubber plug located at the top. Preferring to avoid messy leaks, we have always left it intact.

    We wondered what impact, if any, this was having…

    What are Vents?

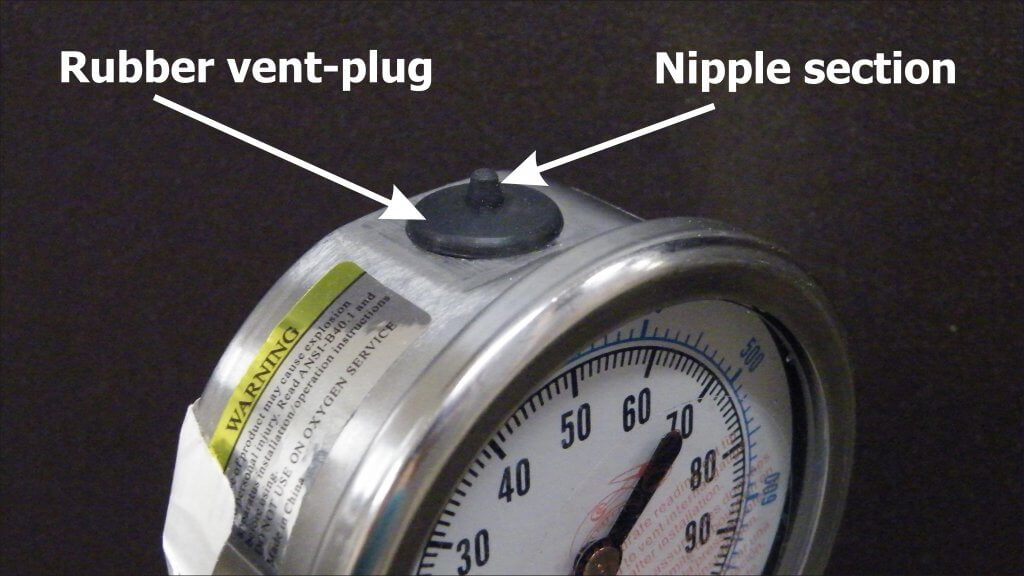
    Expensive gauges have mechanical vents that can be opened prior to use and closed to retain liquid when stored. More commonly, there is a rubber plug with a protrusion (referred to as a nipple).

    Why Vent?

    Mechanical, liquid-filled gauges are sealed to keep the liquid in. When there are temperature fluctuations, the liquid expands or contracts and creates “case pressure”. This exerts a force that interferes with the pressure reading.

    According to Marshall Instruments, case pressure can offset the accuracy by approximately 1 psi (0.07 bar) for every 35˚F (20˚C) temperature change, but is only noticeable when measuring lower pressures (0-15 psi or 0-1 bar). Nevertheless, they advise all gauges should be vented prior to use.

    The plug can be removed to allow the user to refill the gauge, maintaining an air space of about ½” at the top of the window. If the nipple is cut off, the gauge is permanently vented and will leak if the gauge is not kept vertical.

    Testing

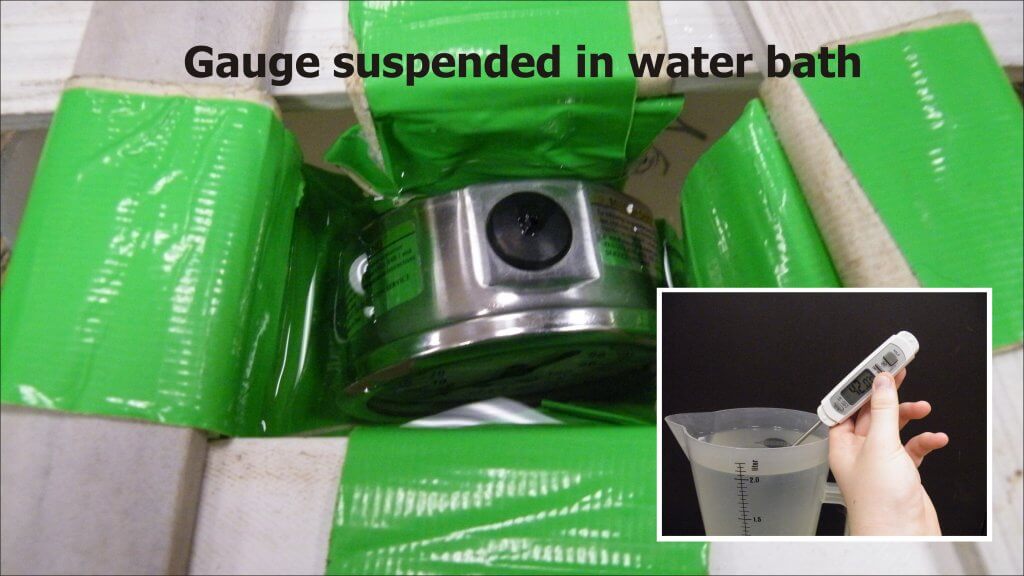
    We performed an experiment to see if typical working temperatures had a practical impact on the accuracy of an unvented gauge. We suspended an unvented, liquid-filled gauge upright in a water bath at approximately 15˚C, 30˚C or 45˚C (59˚F, 83˚F or 113˚F) until it equilibrated. The high temperature may seem unreasonable, but gauges left in trucks on summer days get far hotter.

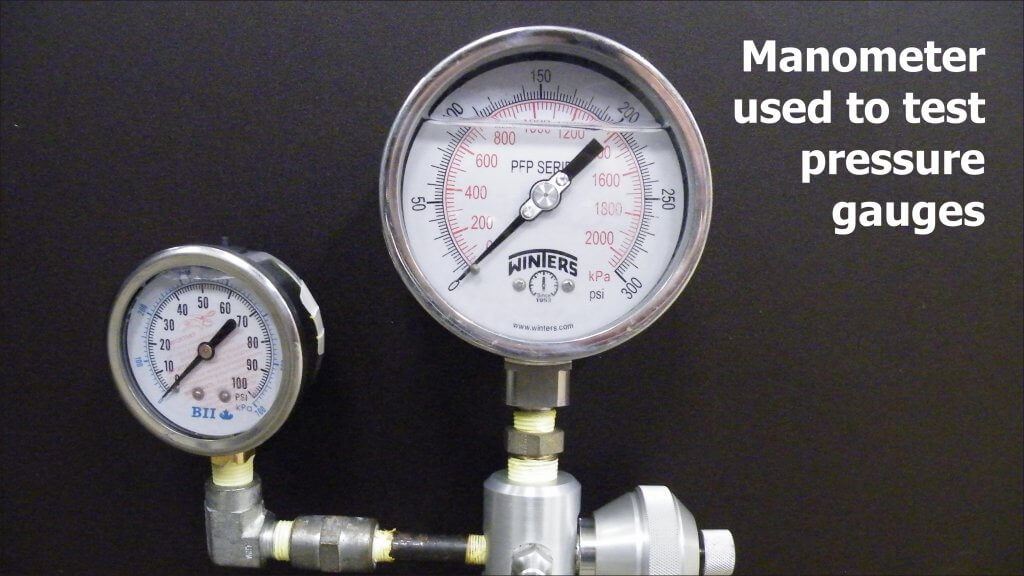
    The gauge was quickly removed and placed in a manometer (Ametek T-975) where it was subjected to pressures of 15, 30 and 45 psi (1 bar, 2 bar and 3.1 bar) and readings recorded. This was repeated five times. We then vented the gauge and repeated the process.

    Results

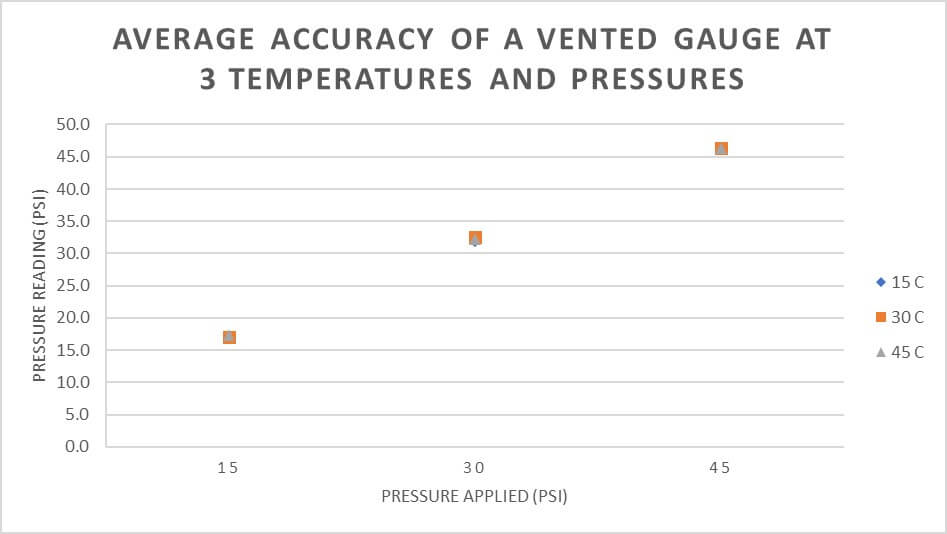
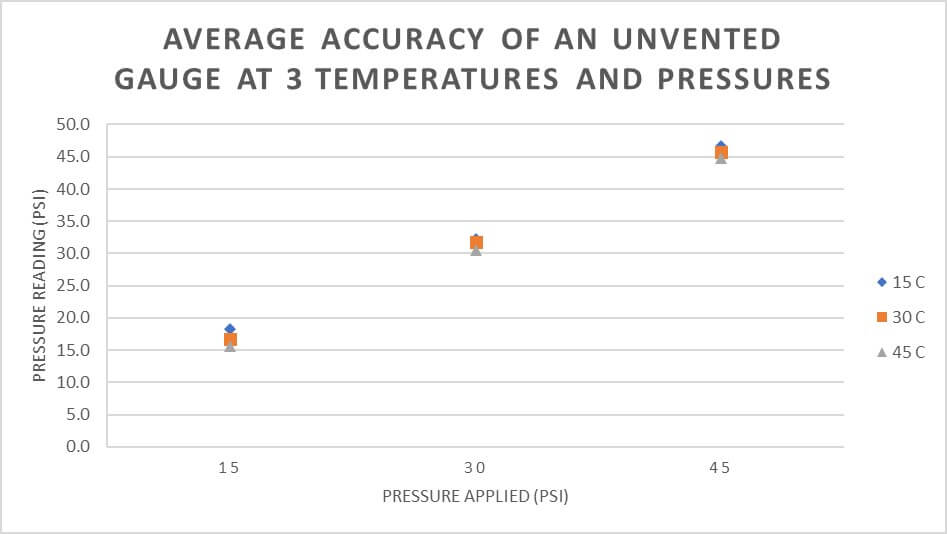
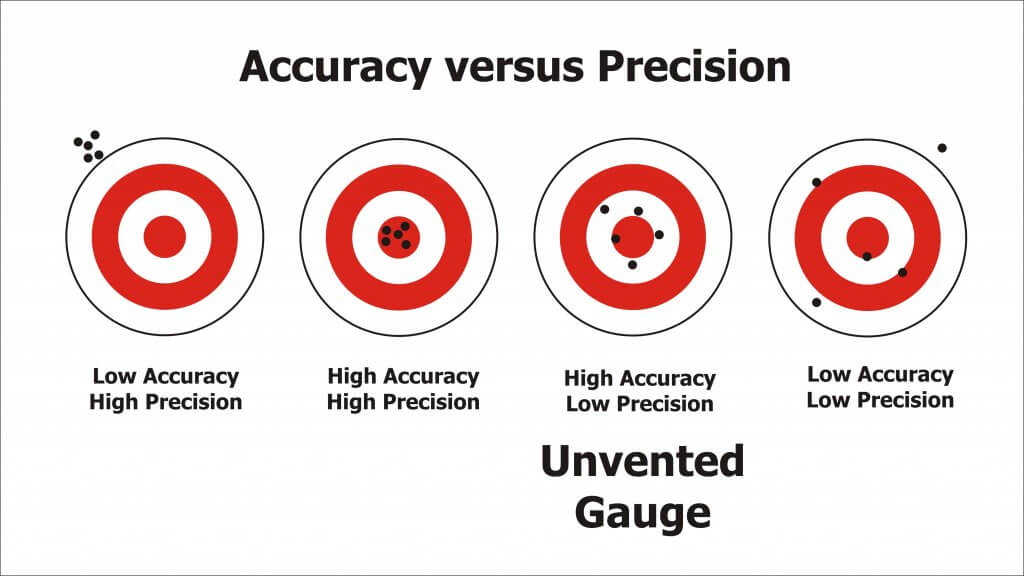
    At first, there appeared to be very little difference in average accuracy of vented and unvented gauges. Accuracy refers to the closeness of a measured value to a standard or known value. Perhaps there was some small increase in the pressure reported by an unvented gauge, but very little practical difference.

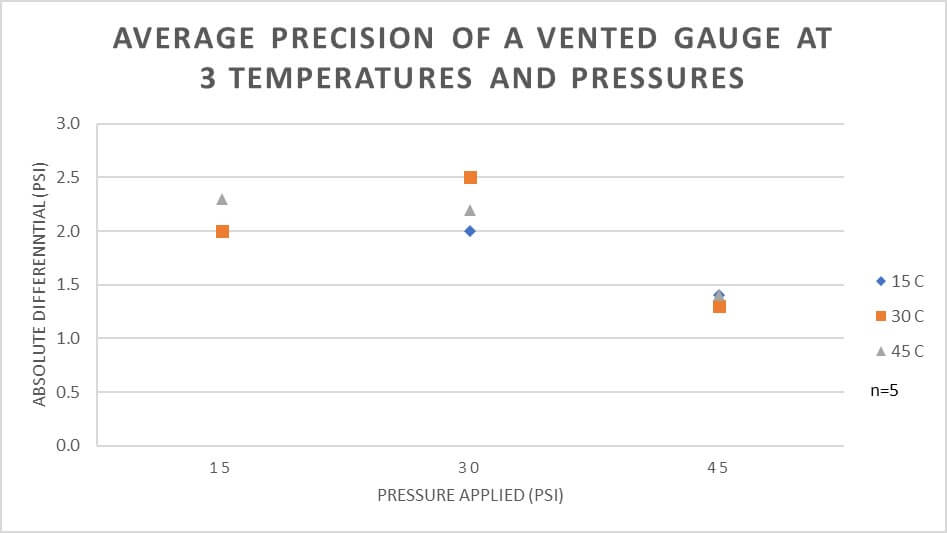
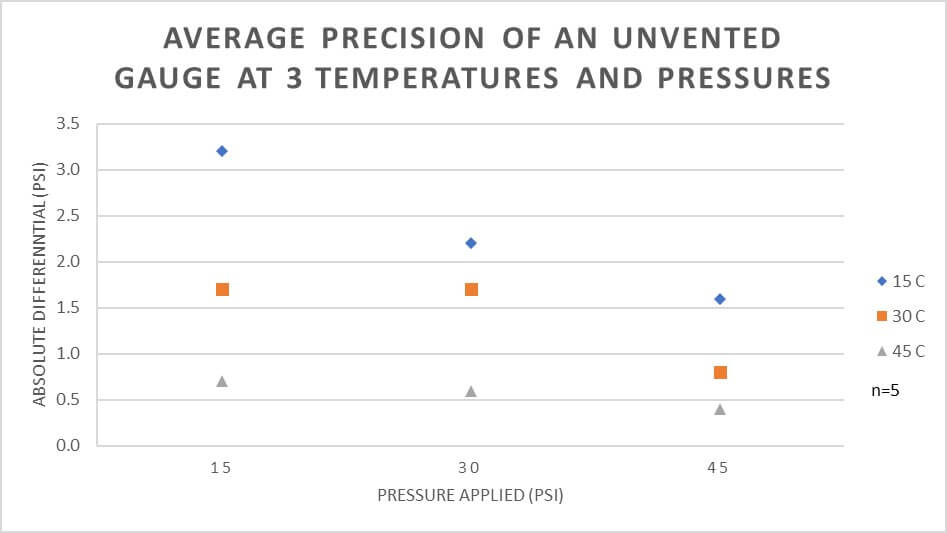
    However, when we look at variability we get a different picture. Variability is a measure of precision, which refers to the closeness of measurements to one another. The graphs show that an unvented gauge has greater variability (less precision) at lower temperatures and lower pressures.

    A good way to think of accuracy and precision is using the classic archery bulls-eye metaphor. The unvented pressure gauge is best represented by the third image, where it is accurate (on average) but not precise (variable).

    Real-World Example

    What does this mean in practice? Consider someone spraying a small plot using a TeeJet XR8002 nozzle on a CO2-powered hand boom at 30 psi. The difference in output between 30 psi and 40 psi is about 0.003 gpm / psi.

    An unvented pressure gauge used on a hot day may read 1.5 psi lower, causing you to overcompensate and raise the pressure 1.5 psi higher than intended. That would result in 0.0045 gpm (0.5%) more applied. Compensating for an unvented gauge on a colder day might be closer to 0.009 gpm (1%) more applied.

    Assuming a walking speed of 3.1 mph (5 km/h) and a swath of 20” (50 cm), the nozzle should emit about16.3 gpa at 30 psi. Unvented in the heat, that’s 16.7 gpa. At 33 psi, that’s 17.15 gpa. That’s almost 1 gpa more than intended. Potentially, the lack of precision could make a significant difference.

    Conclusion

    • Liquid-filled gauges are preferred over dry gauges.
    • To ensure precision, the gauge should be vented prior to use.
    • Permanent venting on a hand-held sprayer causes leaks, which is a nuisance, so we suggest simply lifting the edge of the plug with a screwdriver or fingernail to vent the gauge prior to each use.

    This work was performed by OMAFRA summer student, Aidan Morgan.

  • Paint it black – Parody

    Paint it black – Parody

    Never fail, as spring turns to summer we get questions about algal growth in water tanks. There are lots of suggested solutions, but questions about pH antagonism and phytotoxicity seem to linger. In 2021/22 we ran trials to explore how well home-grown algicides like copper, bleach, and ammonia work, and whether they cause antagonistic responses when that carrier water is used on crops. You can see the results here.

    Anticipating those results, we wrote this parody on a Stone’s classic. Not long after it was brought to life by the brilliant minds behind Michigan’s epic podcast “The Vegetable Beet” (Go subscribe right now!). You can hear it in the link below, where Ben Phillips is accompanied by his daughter’s toy tambourine. Crank it up to 11!

    You can even download Ben’s sheet music here.

    I see a white tank and I want it painted black
    No algae anymore, I want my water back
    I see the cart drive up while spraying summer rows
    I have to dump it out until the algae goes

    I see my neighbours’ tanks and they’re all painted black
    With copper sulfate they claim algae won’t come back
    I see them turn their heads and quickly look away
    They see my algae grow in sunlight every day

    I look inside the tank to see if it is black
    I could park it in the shed, or in the shade out back
    Maybe then it’ll fade away and I can face the facts
    It’s not easy filling up when your filters plug with crap

    I wish that my green sea would turn a deeper blue
    If you try chlorine pucks it will clear up for you

    I’ll store my tanks away from that bright summer sun
    Then I’ll spray algae-free before the mornin’ comes

    I see a clean tank ‘cause I had it painted black
    No algae anymore, I got my water back

    I see the cart drive up while spraying summer rows
    Clear water coming out, and no more clogging woes

    Hmm, hmm, hmm
    Hmm, hmm, hmm
    Hmm, hmm, hmm
    Hmm, hmm, hmm

    I want to see your tank painted black!
    Black as night!
    Black as coal!
    I wanna see the bugs, knocked right out of the sky
    I wanna see it painted, painted, painted black, yea!

  • How Spot Spraying will Affect Sprayer Design

    How Spot Spraying will Affect Sprayer Design

    Some years ago, a friend recommended that I read The Tipping Point by Malcolm Gladwell. In this book, Gladwell tries to understand why some things catch on, and others don’t. It’s a compelling read full of Gladwell’s trademark stories and his knack to deftly interpret scientific studies. He talks of connectors, mavens, and salesmen, as well as the “stickiness factor”, a measure of how memorable something is, as keys to success of products and ideas. I think of the book often as I ponder the many good ideas in agriculture, many of which never see widespread adoption.

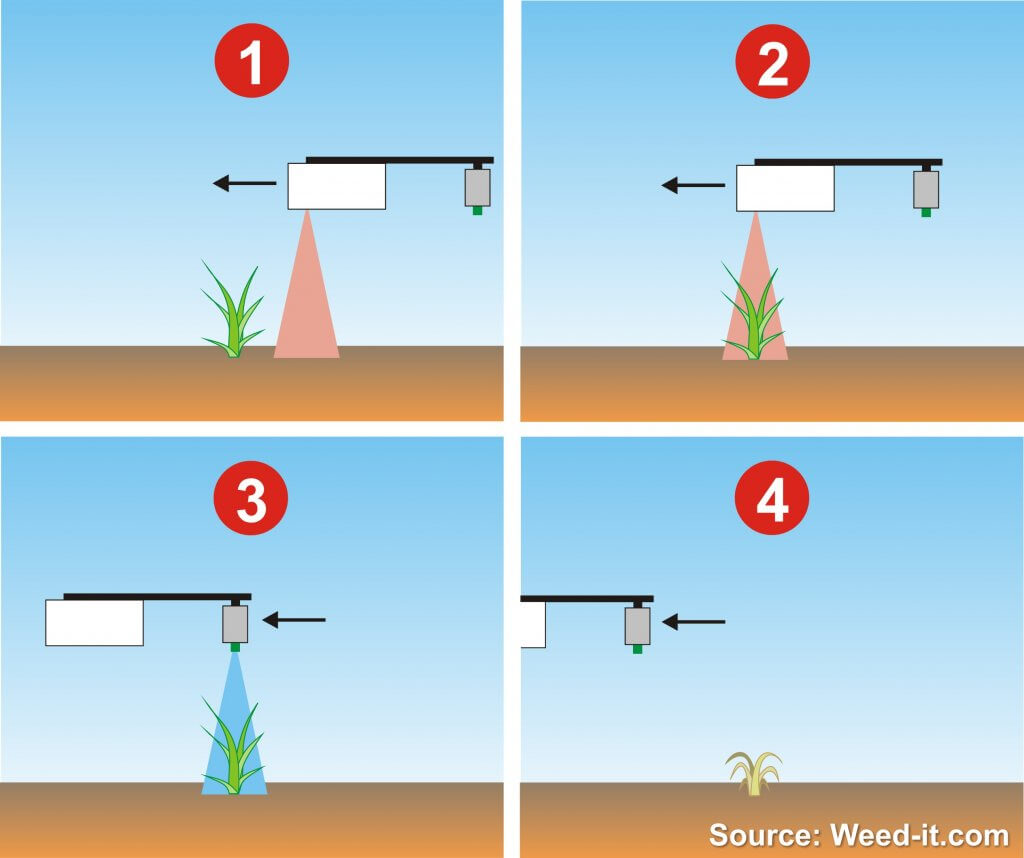
    One of these good ideas is spot spraying. Green-on-brown detection was first introduced in the early 1990s. Anyone remember the Concord DetectSpray? It was great but had bad timing, as resistance wasn’t a big issue and glyphosate prices were about to slide. Green-on-brown grew to the NTech (later Trimble) WeedSeeker a few years later. Rometron’s WEEDit built on Trimble’s success and found widespread adoption in Australia in the past ten years. Spot spraying did not gain any traction in North America during this time.

    Australia is unique in many ways, not the least of which is their summer spraying practice. Summer is the hot, dry season where land is typically fallow and weeds are kept in check with herbicide sprays (aaaah, the serenity). Making several passes over a field, combined with the need to control some larger and hardy plants, is expensive, and a spot spray saves much of the cost. The savings can be put to use with more effective herbicide tank mixes that delay the onset of herbicide resistance. Spot sprays pay for themselves in short order Down Under.

    It’s more of a challenge in the northern plains of North America, where the fallow season involves snow cover and burnoff occurs in a short window before seeding and sometimes after harvest. But nonetheless, spot sprays have a fit for many of the same reasons.

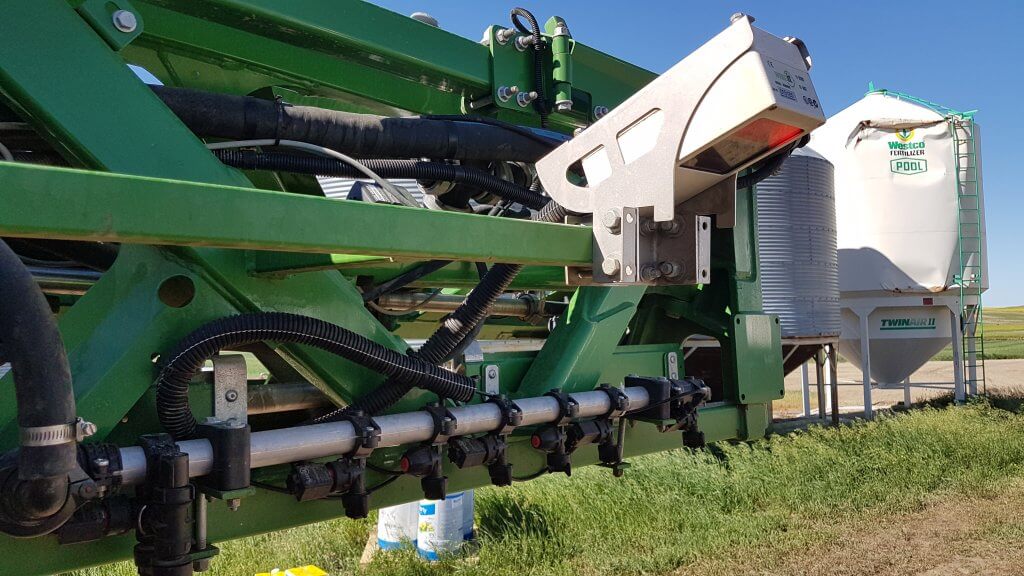
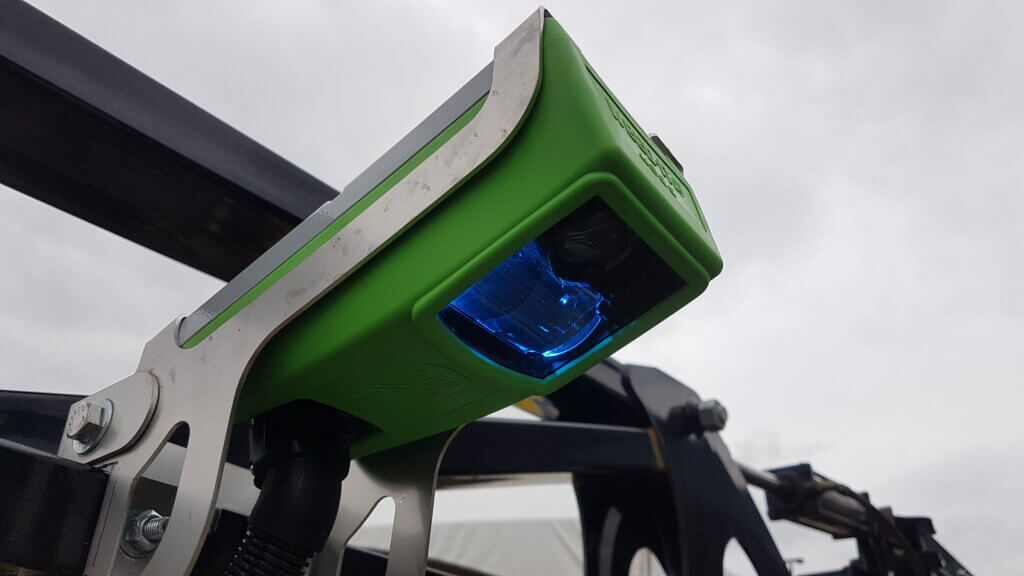
    WEEDit is the first system to make serious inroads in North America, with several dozen systems having been retrofitted to high-clearance sprayers. High detection accuracy and hardware reliability is proven in three seasons.

    On March 2, 2021, John Deere entered the Green-on-brown spot spray area with See & Spray Select. This not to be mistaken as competition. Instead, the entry of a major brand provides validation of the concept like only a large manufacturer can. Yes, we’ve reached a tipping point.

    While the first Green-on-brown units are becoming established, Green-on-green, the ability to detect weeds within a crop, continues to be developed around the world. French startup Bilberry has made enough gains in Australia to bring its product to market with Agrifac, where it’s called AIC Plus. In farmer field trials, they have achieved 90 per cent detection accuracy of wild radish in Western Australia, and claim that they are ready for broadleaf weed identification in wheat, barley and oats. Bilberry’s technology will also be seen on Australia’s Goldacres and France’s Berthoud. Other startups, notably Israel’s Greeneye Technology, plan to introduce a Green-on-green system in the U.S. in the near future. Amazone, the German farm equipment giant, partnering with Xarvio and Bosch, announced plans at Agritechnica to have a commercial unit for sale by 2021.

    This technology will have significant impact on sprayer design philosophy. At present, productivity is synonymous with capacity, and large tanks with commensurate heavy and powerful tractor units dominate. Spot spraying savings will depend on weed density and hardware resolution, but 50 per cent to 90 per cent reductions in spray volume can be expected. A 1,600-gallon tank would no longer be necessary. The savings in frame weight and horsepower would be significant, as would the time savings from less intense tendering demands. These savings would offset the lower driving speeds that accompany sensing technologies, and, overall, provide a lower bar for autonomous operation. We may see lighter specialty spot sprayers.

    The savings in brute size will be countered by increased sophistication. Better boom height management is essential for spot spraying, not just for the sensor to properly see the target and estimate the time needed for the boom to reach that spot, but also for the spot spray itself to deliver the right dose. In any fan spray, band width at ground level changes with height, and that, of course, is related to dose. Trailed booms can address this issue easily.

    But not everyone wants a specialty spot sprayer that would require an extra pass over the field. With growing utility of soil residual herbicides, dual tank sprayers—small tank for the spot spray, large tank for the broadcast residual—make sense. Large sprayer frames can accommodate an additional smaller tank, second pump, and plumbed boom easily.

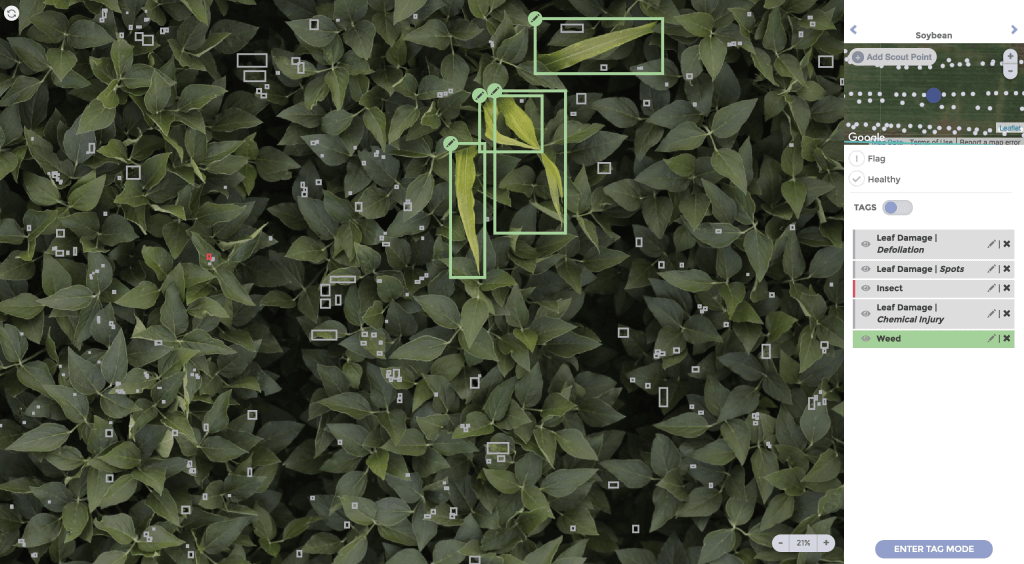
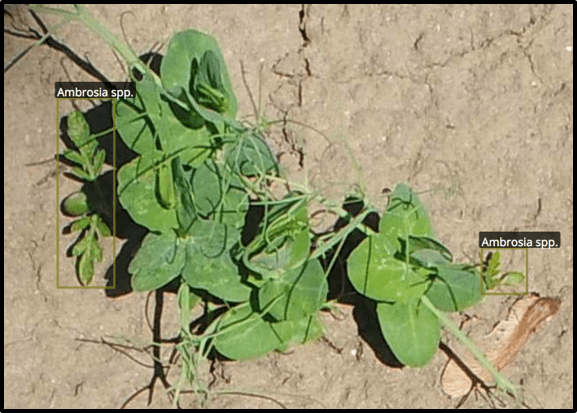
    Plant detection and identification bring other opportunities. Adjusting dose for plant size is one of the first, or for harder to control weed species.

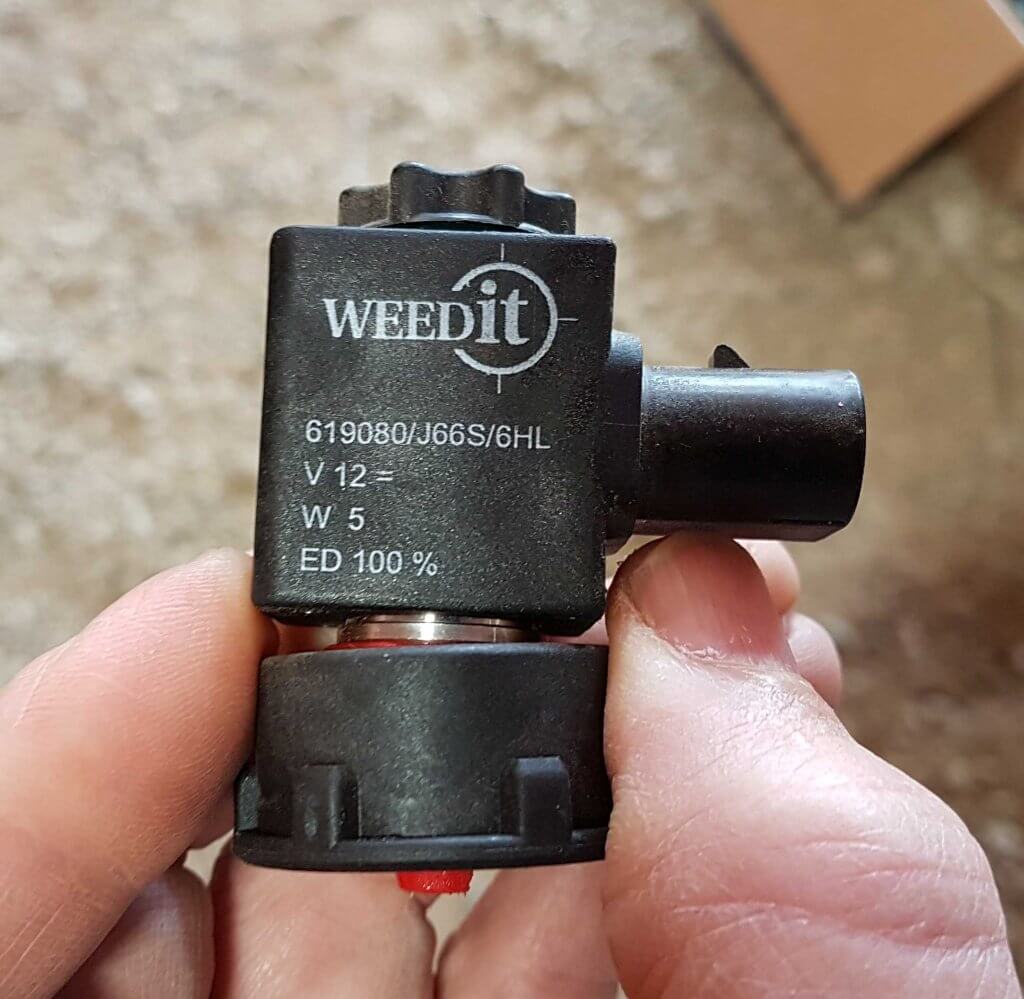
    Spot sprays rely on fast, precise response of the nozzle, and this provided by fast-reacting solenoids that are part of pulse-width modulation (PWM) systems. On a broadcast sprayer, these solenoids can change the emitted dose instantly, within a certain envelope, by altering the duty cycle of the pulse. This, however, works best in the context of a boom with overlapping spray patterns. A single band spray would not change dose with duty cycle as easily.

    Higher dosing would be an opportunity for multiple nozzle bodies that are able to spray one, two or more nozzles in the same spot simultaneously. These are already widely available and popular in Europe.

    This also brings direct injection into play. Current systems introduce the active ingredient into the boom upstream of the nozzles, affording it time to mix into the water. For true spot spray utility, though, direct injection ought to be at the nozzle. Only then can custom mixes and rates be applied on a spot basis. It’s been done before, if only to show how difficult it would be to deliver uniform doses to a spot spray machine.

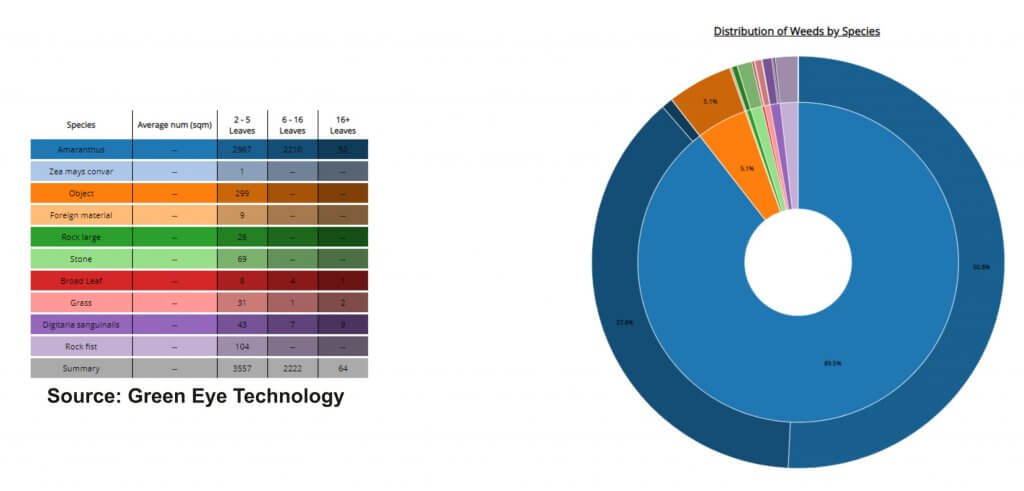
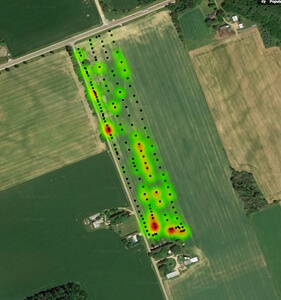
    Spot spray sensors have agronomic benefits. By recording the location sprayed, weed patches can be mapped. As plant identification becomes possible, it’s conceivable to obtain plant species and stage distribution maps from the spray pass That would turn the sprayer into a high-resolution crop scouting tool. As machine learning and sensor sophistication grows, other plant and soil parameters can be mapped. The agronomic value of such maps, especially if created over the course of the growing season, is immense. Of course, data density, handling, storage, and analysis will constrain this.

    If the past has taught us anything, it’s that there seems to be a appetite for investment in farm equipment. Sprayers have been the most-used implement on the farm for some time, and their popularity continues despite sharp price increases. These new capabilities will only add value to these implements. Prepare for sticker shock, followed by acceptance and adoption.

    What will a future spot sprayer look like? Although it will have tanks and booms, the level of electronic sophistication will make it so much more versatile we can’t yet imagine all the ways in which it might be used. But it seems to me the situation has tipped and we’re already accelerating toward that future.

  • John Deere See & Spray Select

    John Deere See & Spray Select

    On March 2, 2021, John Deere entered the optical spot spray (OSS) market with its first product, See & Spray Select™. This “Green on Brown” system identifies green material on a non-green background and is thus suited for pre-seed burnoff, chem fallow, or post harvest. It is competing for the same market space as Cropland’s WEEDit and Trimble’s WeedSeeker, but uses a slightly different approach.

    At the heart of the See & Spray system is a relatively simple RGB camera that is mounted directly to the boom and looks about 1.5 m ahead.  When this camera detects a spot of green colour, it assumes that this is a plant and activates a nozzle in line with that plant. John Deere says the weed size threshold is about ¼” (6 mm), and is evaluating its experimental data to identify exceptions to that rule of thumb.

    See & Spray Select uses an RGB camera to detect weeds (Image courtesy John Deere)

    In 2017, John Deere conducted a highly publicized acquisition of Blue River Technologies, a start up that pioneered artificial intelligence (AI) plant identification and coined the term “See & Spray”. However, the technology John Deere announced this time originated with the University of Southern Queensland near Toowoomba, Australia. The university’s Centre for Agricultural Engineering had received some initial seed financing from Sugar Research Australia, Cotton Research and Development Corporation, and Hort Innovation, and eventually partnered with John Deere. This is yet another example of the value of farmer investments in research.

    Blue River contributed to this project but remains committed to its path of developing Green on Green OSS through machine learning. John Deere says this first product is part of an evolution of spraying with ever-increasing precision that will culminate in spot spraying weeds within a canopy.

    The pixels in the See & Spray camera chip are mapped during its initial calibration, allowing the processor to know which nozzle to turn on. There are two user-selected modes. In “Single Nozzle” Mode, the system turns on as few nozzles as possible. If the weed is directly under a nozzle, just that nozzle is turned on. Should the weed be in between two nozzles, both will be turned on. In “Overlapping” Mode, a detection will turn on at least three, and up to six adjacent nozzles. This mode is intended for herbicides that contain specific nozzle recommendations on the label, such as dicamba. By fitting these tips on the spot spray location, the required overlap and subsequent coverage can be guaranteed to be compliant with that label, a unique feature of See & Spray.

    The number of nozzles activated by a weed detection depends on the location of the weed relative to the nozzles, and the mode selected by the user (Image courtesy John Deere)

    In all modes, the user can specify the distance before and after the detected plant that the nozzle will spray. This feature is useful when boom height varies or when travelling faster to provide extra assurance that the target will be covered by the spray. The boom height range for See & Spray is 26 to 47” (66 to 120 cm), and the maximum travel speed with nozzles pointed down is 12 mph.

    Installation of a 40 degree angled adaptor allows sprays tom be emitted backwards, and increases the spray speeds to 16 mph due to the extra distance and time afforded the sensors andoin processors to make a decision.

    See & Spray has a built in contingency for suboptimal conditions, for example when the boom falls outside its height range, or the nozzle speed (not tractor) exceeds the 12 or 16 mph maximum in a turn, or a light or sensor or processor fault occurs. Called “Fallback Mode”, the boom can be configured to shut off, or to go into broadcast mode (using the spot spray nozzles) at that time. These types of insurance are a necessary part of an OSS on the market today.

    To prevent fallback mode from occuring unecessarily, operators often choose to reduce their tractor speed one or two mph to allow for yaw without triggering all the nozzles.

    No OSS system is perfect. Tiny weeds, or those obscured from camera view by crop residue, may be missed. The contingency for WEEDit is “Combined Mode”, where the entire boom emits a broadcast spray at a user-determined fraction of the full dose, while still maintaining spot spray capability at the full dose when a detection occurs. The reduced dose is sufficient to control the smallest weeds, whereas the spot spray is emitted at the full label rate for the larger ones. This capability is made possible through Pulse-Width Modulation (PWM) control of each nozzle.

    John Deere has developed a mode of its ExactApply system to create the same outcome. Called “A & B Mode”, the rear nozzle (B location on the ExactApply nozzle body) is being activated by See & Spray. The front nozzle (A location) can be asked to spray simultaneously over the entire boom width. By choosing a smaller nozzle, a fraction of the label rate can be applied as a broadcast while maintaining spot spray capability. The broadcast boom is pulse-width modulated and retains the swath control and turn compensation of ExactApply. This mode also makes it easier to ensure coverage of these smaller weeds by selecting a finer, wider (110 degree) angles spray on the broadcast boom, and retaining a coarser, narrower fan angle banding nozzle for the spot application. The spot spray does not use PWM, relying on conventional speed and pressure to ensure the correct rate.

    If planning to use A & B Mode, a user would first need to decide if they will calculate the spot spray dosing on a single or a multiple activated nozzle system. If priorizing the single nozzle actiation, one would first determine the band width of that nozzle, and size the nozzle accordingly. The band width should be ar close to the nozzle spacing as possible to maximize savings. Say the sprayer has 15″ spacing, and the nozzle’s band width is 20″. Now, whenever multiple nozzles are activated, they would operate as a 15″ spacing and would over-apply 20/15 = 1.33, or 33%. Say you want to apply 15 gpa (you may need to boost the spot spray volume to allow you to cut that with the broadcast feature). You can do it with the band (and overdose when using multiple nozzles, or apply 15 gpa with the multiple nozzles, underdosing by 28% when a single nozzle is activated. Or split the difference.

    The next step is to select the application rate of the broadcast. If you want to apply 30% of the spot spray rate using the broadcast nozzles, size these accrodingly to apply 5 gpa.

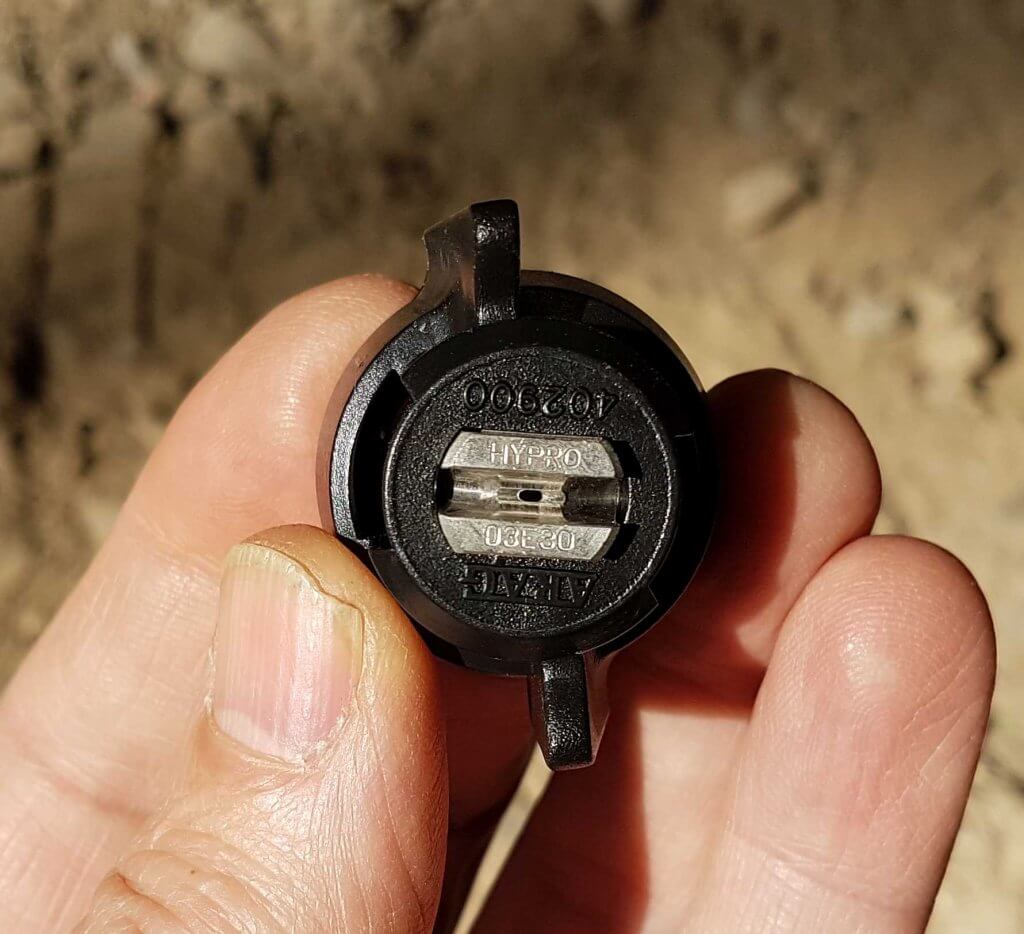
    For band- and spot-sprays, the width of the spray pattern at the target height determines the dose, therefore careful selection is advised. A worksheet that shows boom heights at various fan angles and nozzle spacings is downloadable here. TeeJet and Hypro offer a selection of narrower flat fan tips, but none yet in a low-drift design. Other nozzles are in development. Agrotop has already developed a low-drift “Spot Fan”, and MagnoJet, a Brazilian ceramic nozzle supplier, has 30 and 40 degree low drift tips for sale. Wilger has develped the DX series ComboJet tips in 20, 40, and 60 degree fan angles, in a low drift (pre-orifice design that works with PWM.

    The camera sensing threshold can be adjusted to optimize a specific target. For example, to specify a certain weed size, that weed can be held in view of the sensor and the user can adjust the sensitivity until the weed is properly detected. As with any higher sensitivity, this runs the risk of more false detections, resulting in over-application. But it gives the user some knowledge that an important weed stage is being targeted properly.

    The See & Spray camera relies on ambient light conditions, and John Deere recommends it not be used within 30 minutes of dawn or dusk. Both WEEDit and WeedSeeker, in contrast, can operate under any light conditions.

    One of the challenges of running a OSS boom is the unpredictable fluctuation in flow requirement, which can theoretically range from just a few nozzles spraying to the whole boom activated in less than one second. While this extreme example is rare, a sophisticated and fast-responding pressure-based flow capability is nonetheless required. WEEDit uses a Ramsay Valve into their units to handle this challenge, whereas John Deere is relying on its existing plumbing design.

    As a factory install, the See & Spray is fully integrated into the Series 4 display and is tied into JD Link. As a result, it can generate a high resolution map that shows each spot spray activation, by nozzle. The agronomic utility of this capability is significant, as it provides a very high resolution plant density map. This capability is also inherent in WEEDit and most green on Green systems available..

    See & Spray Select is a factory option and comes integrated into the 4600 series monitor (Image courtesy John Deere)

    It’s no secret that I believe optical spot sprays represent the future of pesticide application (see here). And it’s great news to see John Deere enter the OSS area with a factory installed option. As an influential force in ag, it lends credence to the concept and will benefit all other companies vying for this space. As they say, a rising tide raises all ships.