As Canadian farmers begin to adopt closed transfer systems (CTS), growing pains are to be expected. Instructions for installation and use are primarily European and field-sprayer centric. We’ve seen precious little in the way of practical advice for incorporating CTS into airblast operations.
This is a “live” article which we’ll update periodically. We encourage readers to contact us and share their observations and experiences (and photos) so we can all learn from them. We’re happy to keep contributions anonymous if that’s preferred.
This article does not intentionally imply any brand preference. Our experience is limited at this point and we are using any information we have access to. As the article grows, so will the combinations of sprayer and CTS. Also, we are not recommending or endorsing any of the following approaches. It’s still unclear if modifying the sprayer is the purview of the manufacturer / dealer of the sprayer or the CTS. At this point, we suspect it’s likely the owner that accepts any responsibility.
Does it matter where the CTS is relative to the sprayer?
If the system is gravity-fed, the coupler, the fill line and the connection to the tank must be higher than the fill level in the tank. Liquid won’t flow uphill unless it’s pushed from behind (pressure) or pulled (suction or siphon). Be aware this means the entire fill line should be above the tank’s fill level; sags will prevent fluid transfer. If we’re observing best practices, the tank should be half-full of water before you start adding products.
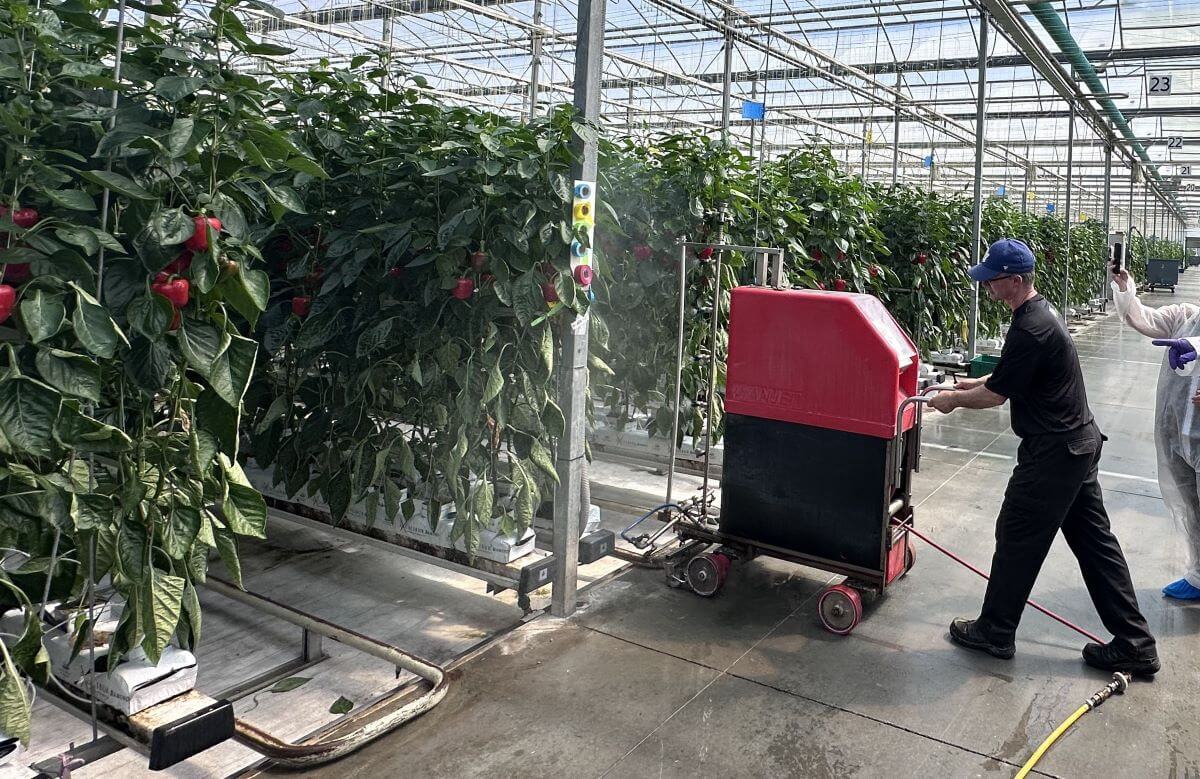
If the coupler uses suction from the sprayer itself, or employs a pump, relative height won’t affect filling. In this case it is likely part of a separate transfer system (i.e. not permanently mounted on the sprayer). It might be simple, or part of a larger and more sophisticated affair, but in either case it should be level, stable, and easily accessed without the operator having to reach or squat. Two examples are pictured below.
Here, a CTS is mounted to a hand cart so it can be wheeled into place and then put away. The sprayer provides suction via venturi to pull in the chemistry and a simple garden hose supplies municipal carrier / rinse water. Note the cinder (concrete) block used to stabilize the unit. Simple and effective.Here, a coupler is part of a larger tender system. Carrier / rinse water is pumped from an onboard tank, through the coupler, and then into the sprayer.
How do I plumb the CTS to the sprayer?
If the CTS is mounted directly on the airblast sprayer, it’s typically a smaller, gravity-fed coupler. The rinse / carrier water is often from an external source (e.g. water tank, tower, pond or municipal water), but there are cases where an onboard water source can be used.
Provide Agro has attached a gravity-feed coupler to the secondary tank hatch. This is above the fill line, sealed tightly, and it uses an onboard rinse / carrier water source. If considering cutting into a hatch, be aware of the filter basket or any onboard rinse system. Also, note that letting the lid flop open (or setting it aside) should not damage the coupler itself.No matter the rinse / carrier water source, it should match the manufacturer’s prescribed pressure range (generally between 3 – 6 bar or 45 – 85 psi) and have an anti-backflow device. There is no such device in this photo.
Some have suggested cutting a hole in the tank itself, above the highest possible fill line, and sealing the coupler in place. This is not simple. If you find a flat horizontal surface and you are equipped to cut poly, Fiberglas or steel (listed in ascending order of difficulty), doing so could undermine tank integrity and create potential for leaks. We won’t even entertain what would happen to your sprayer warranty… assuming someone still has one.
If the intent is to couple a fill line to the sprayer, the best approach is to tee a fitting into the suction-side of the sprayer plumbing to draw product in through the pump. Consider accessibility and safety first: Can you safely and easily reach the suction side of the sprayer plumbing? Is the PTO shaft too close for comfort? Will anything stick out past the sprayer that might create a risk of snagging a crop canopy or trellis? If a tee can be plumbed in, will it need to be secured to the chassis in some way to create stability?
There is no easy or universal answer to these questions.
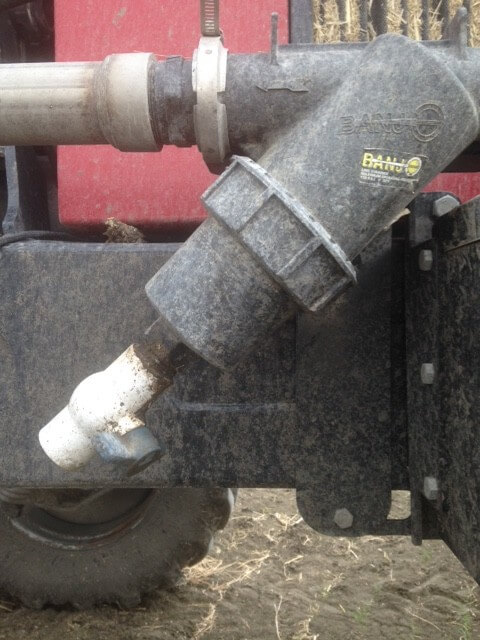
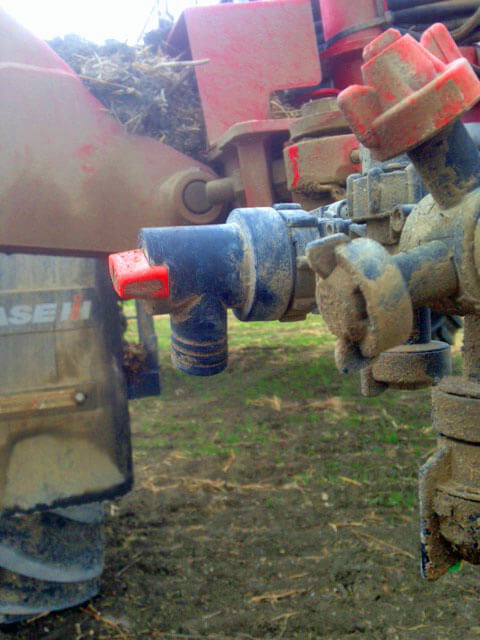
On this sprayer, the only easily-accessed point is between the suction filter and pump. Creating a tee that would accommodate a dry poppet fitting is challenging.In the case of this 3-pt hitch sprayer, there is no simple way to access the suction side of the plumbing. Perhaps a tee could be added and the fitting extended up-and-out from under the chassis. Securing the fitting might require strapping it to the back of the tank, or to a mast of angle iron (or similar) attached to the chassis. Imagination required. Apply within.
As for the fitting, what style is best? A cam lever style fitting will work, but it will leak a volume of liquid when it’s detached. A quarter-turn valve will also be required on the sprayer, and preferably another on at the end of the feed line, so that’s two more valves in play when loading. And, for the sake of safety, best practice would to be to use a cam cap on the sprayer just in case the quarter-turn valve gets snagged and opens. Far safer and more efficient, a dry poppet style fitting will ensure minimal spillage when the hose is disconnected, with no additional valves or caps required.
Finally, what of the fill line itself? We’re seeking confirmation, but we have been told of a situation where the pump suction was sufficient to collapse the feed line. This is why some CTS manufacturers provide the hose and fitting with the units. At minimum, check the CTS manufacturer’s instructions and ensure the hose is rated for the degree of suction created by the pump.
Send us your experiences
And that’s all we have for now. We encourage you to reach out to us with your successes and failure and we’ll update this article for others to learn from.
Alternate Row (aka Alternate Row Middle [ARM]) spraying is an application method where the air-assist sprayer does not pass down every alley during an application. The sprayer operator is relying on the spray to pass through one or more rows and provide acceptable coverage to the entire canopy (or canopies) on a single pass.
Some state agencies promote this spraying strategy to various degrees, and many sprayer operators (whether they admit it or not) have used this method of spraying. I have advised it myself for very young and/or very sparse vineyard and orchard plantings, but never without confirming coverage. When I tell operators that I have serious reservations about alternate row spraying, they defend it. Here are the most common justifications I’ve heard over the years, and my response:
Justification
Reply
“I do not have enough spray capacity to spray every row when time is short.”
You need more sprayer capacity. Get another sprayer so you can get spray on in time or invest in a multi-row sprayer is possible.
“ARM spraying saves money and reduces environmental impact because I use less pesticide.”
Technically, if you travel every second row with a sprayer calibrated to travel every row, you have indiscriminately reduced your carrier and chemical inputs by half (or more). Without close monitoring you may compromise your efficacy.
“I only perform ARM spraying early in the season when canopies are empty, or only on young plantings.”
I grudgingly grant this one as long as coverage is closely monitored. I’ve prescribed it myself in young or sparse plantings where I couldn’t get the sprayer output low enough to prevent drenching the targets.
“The spray plume in the alley beyond the target row must mean the spray is providing adequate coverage. More is better!”
If the spray is blowing through the canopy, it isn’t landing in the canopy. Further, if the air speed/volume is too high, droplets can ‘slipstream’ past the target without impinging on them. I’ve removed water-sensitive paper from canopies with barely any spray on them despite the plume in the downwind alleys. It looks like a magic trick, albeit an unhappy one.
“Uncooperative weather doesn’t always leave me enough time to spray the entire crop, and it is the lesser of two evils to spray alternate rows than not at all. I’ll make sure I come back to spray the other rows later.”
Choosing to do half a job requires an understanding of the products’ mode of action. If you are spraying an insect at a particular stage of development, there’s no “coming back later” to get that generation – if you missed, your window has closed. If it’s a protective fungicide that offers no kick-back, then once the disease has infected tissue, the damage is done. Get the spray on as best you can, but if it washes away before it has a chance to dry sufficiently, be prepared to reapply at the earliest opportunity as long as the label allows it.
“ARM has always worked in the past.”
Would you mind picking my lotto numbers for me? You’re a very lucky person!
My reservations about ARM spraying come from published research and personal experience that show that coverage is almost always compromised when spraying from one side of a canopy. The spray must pass through the canopy to reach the far side, and the canopy filters droplets from the air as it passes through. This reduces the number of droplets available to cover the far side. In addition, high velocity spray will create “shadows” where any targets on the immediate far side of a leaf or branch become shielded and receive little if any coverage. Further still, fine droplets slow quickly as they leave the nozzle and take a long time to settle. As the entraining air slows and becomes erratic, the droplets float and change course, making their behaviour hard to predict.
The cumulative impact can be seen in this infographic I built in 2016. The orchardist was a dyed-in-the-wool ARM applicator and he was resistant to driving every row because it took so much time. I wanted to show that he could claw back some of the lost time by spraying less pesticide every row versus his current volume every second row. He would need fewer refills, and save a LOT of unnecessary pesticide. The water sensitive paper does the talking, and while I’d like to think I’ve convinced him, I’ll bet he’s still out there dicing with fate.
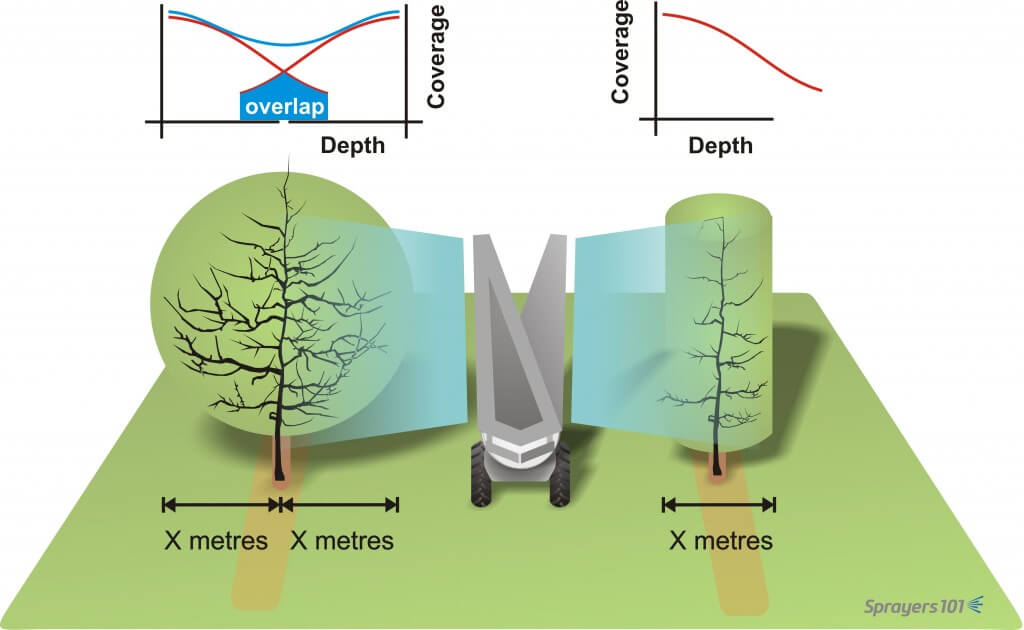
A very popular argument in favour of ARM spraying comes from orchardists that are shifting from semi dwarf to high-density plantings. They ask “How it is different to spray a four foot diameter tree from one side compared to an eight foot diameter tree from both sides”?
Well, we know coverage is reduced as a factor of distance. Spraying from one side gives a single opportunity to cover the middle and far side of a canopy, whereas spraying from both sides provides an opportunity for an overlap in coverage. Essentially, the centre of a canopy receives the cumulative benefit of two sprays. Coverage is therefore always improved when spraying from both sides, period.
Spraying from one side gives a single opportunity to cover the far side of a canopy. However, spraying from both sides provides an opportunity for an overlap in coverage. In other words, the centre of a canopy receives less spray than the outside, but is essentially sprayed twice resulting in a compounding effect.
Why, then, do some sprayer operators claim that alternate row applications work? Because sometimes, they do! Just because coverage is reduced doesn’t mean it isn’t sufficient to protect the crop. It simply means that the potential for poor coverage and reduced dose is dramatically increased by alternate row applications. A sprayer operator might perform alternate applications successfully for years before conditions conspire to defeat the application: unfavourable wind, poor timing, increased pest pressure, poor pruning practices, excessive ground speed, high temperatures, low humidity, insufficient spray volume, and several other factors might occur simultaneously and reduce coverage below a minimal threshold for control. This confluence of bad luck may not happen the first year, or the second, but eventually…
Product failure isn’t the only concern. Repeated reduced dosages may play a role in developing resistance. In those situations where the operator recognizes insufficient coverage, they may have to spray more often to compensate, negating any savings in time or product. Reduced dosage is a common error when a sprayer operator elects to use ARM.
If you still aren’t convinced, at least perform alternate row spraying the “right” way. Here are three situations that I’ve heard operators refer to as alternate row spraying. Situation 1 is most common, but to my mind only Situation 2 would be considered acceptable. Even then, confirming coverage is a must.
Situation 1:
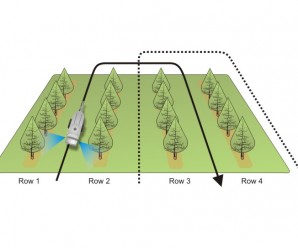
The sprayer has a typical calibration for spraying every row, but only drives alternate rows. The first application (solid line) covers different rows from the second application (broken line). The operator will claim to spray more frequently, but generally does not perform the second application unless there is high pest pressure. The result is half-a-dose per hectare per application.
The sprayer has a typical calibration for spraying every row, but only drives alternate rows. The first application (solid line) covers different rows from the second application (broken line). The operator will claim to spray more frequently, but generally does not perform the second application unless there is high pest pressure. The result is half-a-dose per hectare per application.
Situation 2:
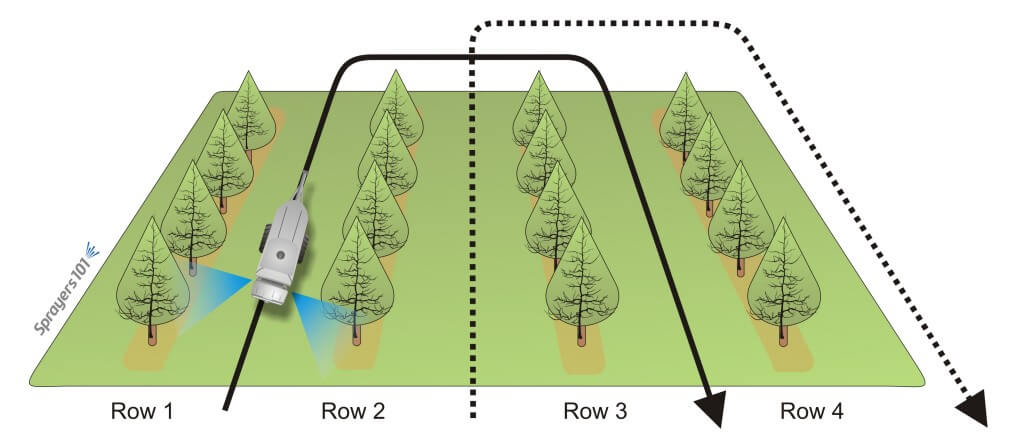
The sprayer is calibrated for double output compared to a typical every-row situation, and the operator drives alternate rows. The result is that the hectare gets the whole dose per application, but coverage is always inconsistent.
The sprayer is calibrated for double output compared to a typical every-row situation, and the operator drives alternate rows. The result is that the hectare gets the whole dose per application, but coverage is always inconsistent.
Situation 3:
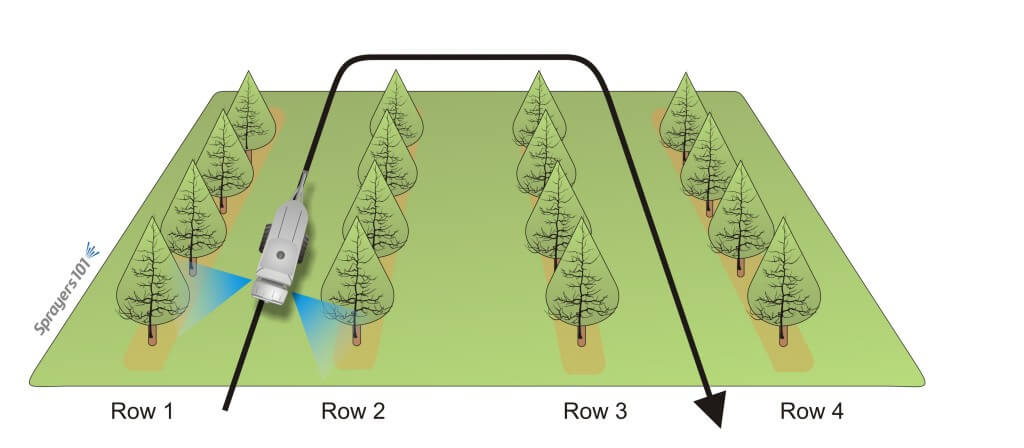
Since the sprayer will only drive alternate rows, the operator mistakenly sets the sprayer to emit half the output compared to a typical every-row situation. The first application (solid line) covers different rows from the second application (broken line). The result is a quarter-dose per application, and if the operator chooses to spray a second time, the hectare will only ever get half-a-dose. Yes, this happens.
The sprayer has a typical calibration for spraying every row, but only drives alternate rows. The first application (solid line) covers different rows from the second application (broken line). The operator will claim to spray more frequently, but generally does not perform the second application unless there is high pest pressure. The result is half-a-dose per hectare per application.
So, my final word on alternate row applications is that they should be performed with extreme caution. I’ve used them myself in early season applications in new plantings, but never without confirming coverage with water-sensitive paper, and never in conditions that might further compromise coverage to the point that the application does not give control.
Caveat Emptor!
Well, I thought it was funny. My apologies to J. Luymes from British Columbia (pictured) and Obi Wan Kenobi (not pictured… or is he?)
Some springs are tougher than others. This article was originally written in 2019, which was particularly challenging. The frequency and duration of rain events left limited opportunity for orchard sprays. Even then, the periods between rains were transitions between warm and moist conditions and cold fronts, which makes wind gusty and changeable. These same periods leave wet alleys prone to rutting and compaction, and conditions that favour spraying may also favour pollinator activity.
In response, applicators get frustrated. Some may be tempted to spray in sub-optimal conditions and risk drift thinking even a little coverage is better than none. But the adage that “there is no wasted fungicide spray” does not apply here. Some may disagree, but spraying in wet and high-wind situations:
greatly reduces coverage and subsequently, crop protection.
may result in repeated sub-lethal doses that can encourage resistance.
greatly increases the degree of surface run-off and off-target drift, risking environmental, commercial and residential contamination.
The argument itself may be moot because the decision to
spray is not strictly a consideration of economics, productivity, and risk
tolerance. When environmental restrictions exist on a pesticide label they are
inviolate. That is, they are not suggestions but legal requirements. Statements
might include:
Not spraying when rain is forecast within 12 hours following application. This is, in part, to prevent water-soluble products from moving in surface or channel run-off.
Not spraying in calm conditions (generally <3 km/h, as measured at the top or outside of the orchard). This is to prevent airborne spray from moving in unpredictable directions during a thermal inversion, or downhill with stratified air.
Not spraying in gusting or windy conditions (generally >10 km/h, but there is no Canadian standard). This is to prevent airborne spray from moving with the wind. This is of particular import when there are sensitive downwind areas that can bring buffer zones into play
Technologies exist that extend the spray window, but they require
long-term planning and may not be economical (or even completely proven). They
are generally a combination of orchard architecture and sprayer design. Examples
include:
Tented orchards (more common in Australia) designed to exclude pests and insulate against hail, wind and inversions.
Shrouded vertical booms (e.g. Lipco) designed for trellised orchards.
Solid-set emitters (more common in Europe and still experimental in parts of the northern US) that reduce drift and can spray large areas quickly.
Vertical towers with downward-oriented fans (e.g. Curtec Proptec or Sardi sprayers) that rely on the orchard itself to filter lateral/downward-directed spray.
Assuming the pesticide label does not prohibit application, there are adjustments that can improve coverage and reduce drift in sub-optimal conditions, but only marginally. These are compromises that sacrifice time, money, effort and/or the level of crop protection. Further, they are only intended for sprayers with towers (i.e. not low-profile axial sprayers):
Convert to air induction nozzles (at least in the top two nozzle positions, and likely at one rate higher than you usually use).
Be certain to turn off any nozzles spraying excessively over the top of the canopy. A little can’t be helped and is actually a best practice to ensure spray reaches the treetop. Be reasonable.
Reduce fan speed to only reach just past the middle of the canopy on the upwind side.
Turn off the boom on the downwind side of the sprayer and adjust airspeed and nozzle rates for upwind alternate row spraying only. Especially on the last three downwind rows, which you may have to leave unsprayed entirely.
The best advice is unpopular: Park the sprayer until conditions improve. Like hail, there are environmental factors that are out of the farmer’s control. They are inconvenient and highly frustrating, but do not be tempted to takes risks on what might ultimately result in poor coverage and accusations of pesticide drift.
In April 2025 we visited Cedarline Greenhouses to assess their spraying methods. Our hosts invited us to examine their practices and then graciously agreed to let us share the process (and the results) so others could learn from the experience. Every greenhouse is different, but with a little imagination the process we used should translate to most operations. I want to be clear that this operation was already doing a good job before we showed up. It’s just easier for someone from the outside to scrutinize and find little things that might need tweaking. Let’s go through the steps we took that day.
1. Measure the crop canopy and the planting architecture
The objective of any spray application is to achieve sufficient coverage of the target with as little waste as possible. Achieving this goal means understanding the interaction between the sprayer, the spray droplets, and the crop canopy.
Start by measuring the the planting architecture. These values allow us to calculate application rates and to calibrate the sprayer. Cedarline is a 16-acre pepper operation. The crops are strung vertically in double rows for a total canopy depth of about 1 m, leaving roughly 0.5 m clearance in the alleys. Spraying takes place while the crop is between 1.5 and 3.5 m high. Each row is 102 m long.
2. Consider the target from the droplet’s perspective
Stand between the rows and face the canopy. Where is your spray target relative to the nozzle? Is it in line-of-sight, or are there parts of the canopy in the way? In this case, our primary targets are sucking insects found predominately on the under-side (abaxial) surface of the leaves, and not the waxier, above-side (adaxial) faces.
As we look through the double row, we see the adaxial sides face out towards the alleys, and the abaxial sides face the canopy interior. Bad luck. But, as we peer through that first row to the second row, we can see the abaxial sides of those leaves. So, perhaps enough of the spray can penetrate past the first row to deposit on the abaxial surfaces of the far row? This is a tricky plan because of the physics of droplet behaviour.
We know that coarser droplets move ballistically (e.g. like cannon balls), so perhaps they could span the distance from the first row to the next. But they are prone to bouncing and running off surfaces, which means they’d likely drench the waxy adaxial side of the first row before any get to the abaxial side of the far row… and those that do might not stick to the target.
On the other hand, finer droplets are less prone to run off, so they’re much better at sticking to hard-to-wet surfaces like peppers and waxy leaves. Additionally, thanks to the cubic relationship between droplet size and volume, the smaller the average droplet size, the more droplets we have working for us. However, finer droplets don’t have a lot of mass, so they move erratically, and they are prone to evaporation. Maybe they won’t reach deeply enough into the row.
Fortunately, greenhouses are humid places, so finer droplets don’t evaporate quickly. Plus, greenhouses tend to spray at relatively high pressure (200 psi or more), which imparts momentum to finer droplets. Also, when enough tiny particles move in a single direction, they create air currents – essentially a light wind. This side-effect is sometimes enough to move leaves, creating holes in the canopy and exposing the abaxial sides of leaves as they twist. So, there’s hope. Now let’s look at the sprayer.
3. Examine the sprayer and the nozzles
Cedarline uses semi-automatic “robot trees” (Wanjet model S55). This sprayer has a vertical, 2 m high boom with nozzle bodies spaced every 25 cm. When the crop grows higher than the boom, an extension is added to bring it to 4 m. Flange wheels allow the sprayer to ride the hot water pipes between the rows like a train on rails at a rate of 60 m/min.
The sprayer is manually placed in the row. Then it trundles along, spraying one side, until it reaches the end of the row. Then the vertical boom turns to spray the other side on the return trip, where it is retrieved and placed in the next row. The sprayer is fed from a portable tender unit via a 180 m auto-reeled hose at 200 psi. The question is, does this all work the way we assume?
4. Calibrating the sprayer
4a. Pressure
We started with pressure. If pressure is the force that causes a specific volume of spray mix to exit the nozzles at a specific rate and produces a specific droplet size and spray geometry (e.g. a cone or a fan), then it’s very important to know that it’s accurate.
Remove the gauge with a wrench (never turn it by the face) and test it against a known gauge. You can build a test apparatus very easily. Alternately if the gauge is showing wear, such as the needle not sitting on the zero pin, or it’s opaque, or leaking, maybe just replace it without testing.
In our case, we discovered the gauge was off by 20%. Where the standard gauge read 150 psi, the working gauge read ~120 psi. Plus, the scale of the gauge was far too high. Best practice is to use a gauge rated to about double the operating pressure. This gives better resolution, and a quick glance shows if the needle is pointing straight up.
I prefer a tender system like this over a central spray tank in a header house. In systems where there is a central tank and the sprayer hoses plug in at intervals, the degree of pressure-drop increases with distance from the source. If this is you, install a regulator on your sprayer and adjust it accordingly to hold the pressure constant. In this case, the distance the spray solution travels is always constant, so the pressure doesn’t change. Best practice in either case is to install a pressure gauge on the sprayer at the end (or top) of the boom so you can confirm the operating pressure is correct.
4b. Sprayer speed
We were told the sprayer was set to travel 60 m/minute, but is that true? Certain chemistries will deposit a slick coat on the hot water pipes and the flanged wheels can slip (especially as they wear). There was obvious damage to the rubber surface of two of the flanged wheels that might have affected travel speed. We should have checked, but we didn’t. Use a timer and confirm how long it takes for the sprayer to travel to the end of the row. Don’t include turn time. If it doesn’t match your expectation, then adjust the speed until you get what you want.
4c. Boom and nozzles
Next, we explored the boom and the nozzles. The first thing we saw was that their alignment was wrong. Flat fans in ¼ turn nozzle caps will self-align on the lug to ensure each spray fan does not physically impact it’s neighbours. However, the nozzle bodies themselves can sometimes turn on the threaded boom, and they need to be realigned. We did that before removing a few tips for inspection.
Each nozzle should be oriented 10-15 degrees off vertical and parallel to one another. Here, the top one is correct, but the lower nozzle has twisted and will leave a gap in the swath.
I asked when the nozzles were last replaced and was told the sprayer arrived pre-nozzled with TeeJet visiflo 8002’s. They had never been inspected, other than when they plugged, and their rates had never been confirmed. Upon inspection we found some were physically damaged. This doesn’t mean the nozzle orifice was compromised, but it instilled doubt. You don’t always see obvious damage but know that the orifice is delicate and very precise. As it wears it gets larger (increasing flow), but more insidiously it also changes shape, altering the size of the spray droplets, which we’ve established are critical to our spray strategy.
Best practice is to test nozzle outputs at a known pressure and replace them when they are 5% off the expected rate. Unless a nozzle gets physically damaged, replace them as a set so they wear as a set. When do they wear out? It depends on the nozzle material, the nature of what you’re spraying, the pressure and the amount of time they spend spraying. Here’s a link to an article that suggests several methods for testing nozzle output. Some are cheap and slow, others are fast and expensive, but they all work.
If that’s not appealing, you can mark your tank and see how many rows you should be spraying versus how many you’re actually spraying. Ultimately, given the relatively minor expense of new tips versus the trouble of calibrating them annually, it’s often simpler to replace them at intervals. In this case it’s worth noting that the first 2 m of boom operates all season, while the extension is only added later, so they won’t all wear at the same time.
We examined and then returned the original tips to the boom for the next part of the calibration. We noticed that the gaskets were stretched (crushed). This made it hard to put the nozzles back on, so they would also need replacing.
We turned on the boom to ensure we had everything back in the right place, and noticed that when we stopped spraying, the boom slowly emptied through the lowest nozzles. That meant expensive products were left to dribble out every time the boom stopped spraying, which is wasteful. It hinted that the check valves, which are built into the nozzle bodies, were no longer working. Ideally, once the boom pressure drops below ~15 psi, each check valve diaphragm closes to prevent leaks. It also ensures the boom remains primed for the next pass. We advised that they should be replaced and to ensure the new bodies have the correct thread size. European sprayers rarely have the same thread as North American, so compatibility can sometimes be an issue.
5. Evaluating spray coverage
This is an iterative process, which means we test, evaluate, make a single corrective change, and repeat until we (hopefully) see what we want. Water sensitive paper (WSP) is a terrific tool for this process, but it has a few caveats:
It will react to any moisture, including a humid atmosphere, so handle it with gloves and don’t let it sit for too long.
The WSP surface is only a surrogate for a plant surface. Deposits tend to spread more on leaves, vegetables and fruits, but will always be smaller on the papers. So, only compare papers to other papers and infer that the actual crop coverage is better.
We really don’t know how much coverage is enough. It depends on pest pressure, product concentration and mode-of-action (e.g. contact or systemic). Generally, we like 10-15% of the surface covered with 85 deposits per cm2 on 80% of the targets. Sometimes it’s easier to imagine the pest on the paper – can it fit between the deposits?
5a. TeeJet visiflo 8002 at 200 psi
We started by establishing a baseline using their current nozzles and pressure. WSP was folded and clipped at the petiole so we could assess adaxial and abaxial surfaces. We placed them deep in the canopy so we were looking at the worst-case scenario, and then noted where we left them (use a ribbon or part of the greenhouse as a frame of reference or you’ll never find them again). We sprayed from one side, then examined them in situ, then sprayed from the other side so we could see the impact of cumulative coverage.
After spraying from both sides, we saw excessive coverage on adaxial surfaces and marginal coverage on abaxial. For those that have tools to digitally scan and assess WSP, it worked out to 31% coverage and 225 deposits/cm2 on the adaxial side, and 2% and 16 deposits/cm2 on the abaxial. In fact, the adaxial side was so saturated (>25% coverage) that I don’t trust the deposit counts because of overlaps, but there it is. This is when we brought out the nozzle manufacturer’s catalogue (which you can also find online). We found their nozzle and looked up the flow table, which shows the relationship between pressure, output rate and droplet size.
Those in greenhouses might find that their operating pressures are far higher than what is listed, but that’s no problem. Find the highest pressure and output rate listed in the table and call those “Known Output Rate” and “Known Pressure”. Now use the following calculation to extrapolate flow for a new pressure. It’s also worth knowing that higher pressure tends to mean a wider fan angle and finer spray droplets than are listed in the table:
Unknown Output Rate (gpm) = Known Output Rate (gpm) × (square root of New Pressure (psi) ÷ square root of Known Pressure (psi))
In this case, at 200 psi this nozzle should produce 0.45 gpm. If we go up one size from the yellow 02 tip to a larger blue 03 tip, we can produce a similar flow but using only 100 psi. This would put less strain on the system, but it would also make droplets larger, fewer and perhaps slower.
5b. TeeJet visiflo 8003 at 100 psi
We tried the 8003 at a lower pressure and saw that the deposits were obviously larger on the adaxial side, and not saturating, which is good. However, we saw insufficient deposit density on abaxial, which was a deal breaker.
5c. TeeJet visiflo 8003 at 200 psi
We left the blue 8003s and brought the pressure back up to 200 psi. Now the flow was increased to 0.67 gpm, and the droplets were finer, more plentiful and moved a lot faster. The adaxial surface went back to excessive coverage, but perhaps not as bad as with the 02s. The abaxial deposit density was improved, but still not sufficient. You can see the results of the three trials in the photo below. Go counter-clockwise from 1 (at bottom right) to 3 (at top).
5d. TeeJet twinjet TJ6011003 at 200 psi
It was time for a radical change. We replaced the single flat fan geometry with twinjet flat spray nozzles (TJ60-8003). We tried this because we’ve tried it in the past and it worked well. We retained a blue 03 rate, so we still produced 0.67 gpm at 200 psi. This nozzle also retained the 80° fan angle, but created two of them at 60° to one an other. This would change the spray trajectory, creating new opportunities for droplets to align with the targets. Perhaps most importantly, the twin fan nozzles would produce finer droplets than their single fan cousins, increasing the odds and perhaps and creating more “wind”.
We saw far less differential between abaxial and adaxial surfaces, with deposit density greatly improved on both surfaces. While the adaxial face showed larger deposit diameters, they were close enough to require close inspection to determine which side was which; Coverage was more uniform, with no drenches and no misses. By the numbers we saw 34% and 523 deposits/cm2 on the adaxial side (again, hard to trust the counts here because of overlaps arising from >25% coverage) and 19.5% and 400 deposits/cm2 on the abaxial. We had a winner.
It’s also worth noting that every time we sprayed, we observed the deposit on the fruit and leaves. None of the sprayer configurations caused run-off (e.g. drip points on the bottom of the fruit or tips of the leaves), which would suggest we were not using an excessive volume. Look closely at the following two pictures to see the beads of water and how they deposit. They look great.
We also watched to see if spray passed through the row into the next alley. A little puff here and there is fine, because it meant the spray was reaching the far side of the row. However, spray that blows through the row excessively is wasted becuase it misses the target row and ends up on the greenhouse floor.
Epilogue
We were pleased with the result of half-a-day’s effort. We left our hosts with some homework:
Change the pressure gauge to one that is accurate and spans to 400 psi.
Replace all nozzles and gaskets and ensure they are properly oriented.
Time the sprayer to confirm travel speed is what they assumed.
Using the known speed, pressure, and boom output, do the math to account for the fact that they would now be spraying a higher volume than they were. This will change how much product they put in the tank.
Watch the crop closely to ensure these changes do not compromise crop protection.
Everyone learned a lot from our day together. Cedarline said they would calibrate their other sprayers using this process. They are even going to try a set of yellow 02 TwinJets to see if they can achieve sufficient coverage at their current pressure, which would mean they can continue to mix product at the same concentration. Those are pretty small orifices, guys, so watch out for plugged tips and good luck!
Hopefully this inspired you to look critically at your own operation and to follow these steps to calibrate and optimize your crop protection practices. Happy Spraying.
Everyone here had helpful ideas during this process. Calibration is a team sport so make sure both your operators and managers are involved. Left to right: Ryan Bezaire – OMAFA Summer Student; Paul Brooks – IPM Specialist, Cedarline Greenhouses; Jason Deveau – Application Technology Specialist, OMAFA; Jimmy La Rosa – Operations Manager, Truly Green Farms / Cedarline Greenhouses; Richard Robbins – Technical Representative, Plant Products; Cara McCreary – Greenhouse Vegetable IPM Specialist, OMAFA
Editor’s Note: Changes have been made to this article since its original publication in 2015.
When in-crop spraying is around the corner, sprayer tank clean out is an important topic to address on your farm. Many farms have done the same clean-out routine for years and not had any issues with contaminating residues in the tank resulting in crop damage. Although the old saying “If it ain’t broke, don’t fix it” definitely has some merit, in this case it is good to question whether your cleanout routine is adequate. When you consider the way chemicals have changed over the years, especially the higher reliance on oily surfactants in modern chemicals, it makes sense why we need to pay attention to spray tank cleanout.
The goal of cleaning the tank is to remove and dilute the previous chemical formulation as much as possible to prevent buildup and carryover of residues which can cause crop damage on non-target crops.
Safety First
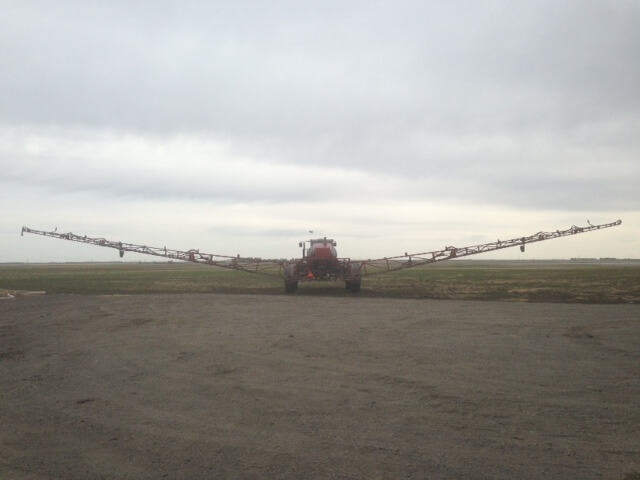
Always wear safety gear before working around chemicals. Although it can be a hassle, we all know that it is no fun spilling chemical on your clothes and skin. What’s even worse is smelling it all day in the sprayer cab. I use a long waterproof coat, a plastic face shield to prevent back splash when spiking jugs, and of course rubber gloves (No judgment on me looking like a total dork please:).
Safety First – Are you looking at my headgear? Are you!?
1 – Get the Previous Product Out of the Tank ASAP
In my experiences spraying, I have always tried to get the previous product out of the tank as soon as possible. Spraying the extra product out of the tank is the safest and most environmentally responsible way to rid your tank of left over product. Dr. Tom Wolf of AgriMetrix Research and Training, states that spraying a crop twice is usually safe, as all herbicides must be registered to be sprayed at twice the rate in order to be registered by the Pest Management Regulatory Agency (PMRA). If one lets the product sit in the tank overnight before beginning the cleanout, there is more time for product to congeal and adhere to the tank and plumbing components.
Ball valve on main filters.
I open the valve ends on my filters to empty the buildup in the bottom of the filter canister. There is often chemical residue or green slime from dug-out water in here. Next I like to go along my booms and empty out all the chemical product within the boom plumbing. Our farm runs a Patriot 4420 sprayer, with valves on each boom section to empty out product. Usually I will go to the sprayer and tip the boom ends up so that gravity allows all of the product to drain out. Then I raise the centre rack, and tip end of booms down to force the product to drain out the other way. You would be amazed at how much product comes out by doing this both directions!
Valves on each nozzle.Tipping the boom ends up with the centre rack down.
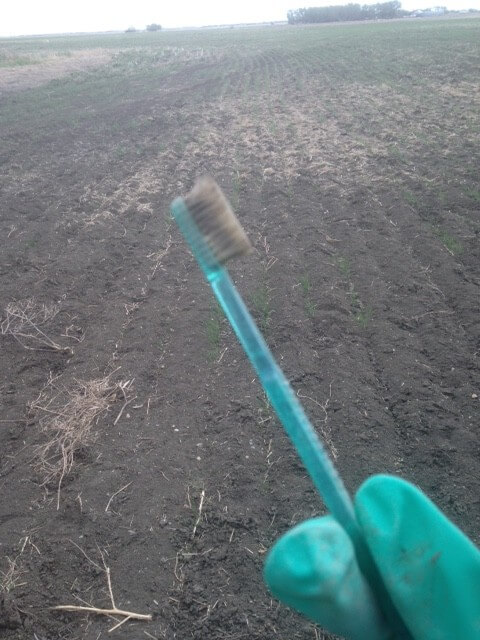
While the tank is empty and no pump is running, I will remove all the filters on the sprayer, and grab the handy dandy toothbrush – this is the most valuable tool in filter cleanout! This brush is just small enough to get it in the centre of the filter and scrub all of the residue and gunk out of the filters. A pail filled with rinsing solution is an easy way to clean filters and nozzles.
Possibly the most important cleaning tool. Don’t put it back in the bathroom afterwards.
2 – Begin Rinsing Process
I used to always put about 1,000 gallons of water to our 1,200 gallon tank, thinking that a larger volume would clean all areas of the tank better, but I’ve since changed my thinking. Research has shown that two or three smaller rinses *aka triple rinsing) is more effective for rinsing the tank than one large volume rinse. I always crank the agitation up to high and allow the cleaning solution to agitate for as long as possible.
Nowadays I try to do three 400 gallon rinses.
1st Rinse
Cleaning product plus 400 gallons water
2nd Rinse
Cleaning product plus 400 gallons water
3rd Rinse
400 gallons of just water to rinse, and run through plumbing system to check nozzles and for leaks
Many labels Recommend leaving the rinsing solution in the tank and lines overnight. This will allow more chemical deposits to loosen up. If an operator is forced to speed up the tank cleaning process due to limited time, they must understand that there are risks involved in doing a less thorough tank cleaning.
Cleaning Products
Detergent or ammonia? Check the label. If the label doesn’t specify, you can consult this table from Winfield United.
Detergent Cleaner
Ammonia
Solution contains an adjuvant
Sulfonylureas (SU’s)
Solution contains a milky looking component (an Emulsion or EC)
Thiencarbazone – methyl
Glufonsinate
Flucarbazone
Imi’s (Group 2)
Dicamba
Simplicity
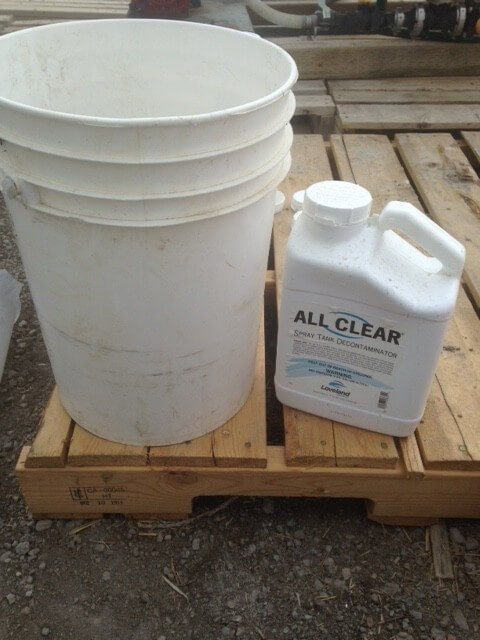
Detergent (e.g. All Clear)
This detergent cleaner is specifically designed to remove pesticide deposits and other debris, including oily substances from booms, filters, and nozzles. Use All Clear (or other detergent cleaner) if the solution is milky-looking (called an emulsion), which means it is oil-based.
Label rate is 0.25 L of All Clear/100 L of water.
If you are adding 400 gal of water, you will only need 3.78 L of cleaning product.
Decontamination rate is double this: 7.57 L of cleaning product. Use this rate if you have had residue issues, or to do a more thorough cleaning.
pH Increaser (aka Ammonia; e.g. Flush)
This is an ammonia based cleaning solution. This product is used to raise the pH to increase solubility of most Group 2 products (from FMC, Bayer, and Corteva but not BASF). Flush contains 7% ammonia. Use Flush (or other ammonia based cleaner) for most cleaning, but especially for Group 2 products listed above, such as Varro, and Velocity M3, Express, Refine, Muster, and Spectrum.
Label Rate is 0.50 L of Flush/100 L of water.
If you are adding 400 gal of water, you will need exactly 7.57 L of cleaning solution.
A pail and detergent are “must-haves” during sprayer cleanup.
Combo Products
Alternately, some solutions raise pH without ammonia. FS Rinseout is sodium hydroxide based, not ammonia based. It is a high alkaline solution that elevates and holds the pH combined with strong surfactants to help clean the tank. Another is CleanOut, which uses potassium hydroxide and disodium metasilicate, a detergent. In both cases they are both pH increases and detergents.
3 – Draining the Rinse Solution
After I have ensured all nozzles are working correctly, and there are no leaks in the system, I drain out all of the rinse water, fold in the booms, and get ready to fill the tank with chemical solution for spraying!
More Information
Learn where residue can hide. This video was filmed for the Environmental Farm Plan with the nice people at Clean Field Services in Drayton, Ontario. Hardly the height of our acting careers, but good messaging nonetheless.