“If you can’t measure it, you can’t improve it”. While the source is nebulous (Peter Drucker, Lord Kelvin, or Antoine-Augustin Cournot), the sentiment is clear.
The status quo
In the world of crop protection, considerable resources are expended to distribute a pesticide over a target. And yet, sprayer operational settings and spray coverage are rarely assessed. As a result, too much time elapses between the application and observing the biological results to evaluate and correct equipment performance. The damage (be it waste or an inconsistent and sub-lethal dose) is done. All sprayer operators know this to be true, so why do precious few perform these assessments?
Perhaps, dear reader, you have personal experience assessing coverage and already know the answer. Perhaps you’ve performed the iterative dance that is placing, spraying, retrieving, assessing and re-placing water sensitive paper (WSP). Perhaps you’ve sprayed fluorescent tracers and hunted for faint glows at twilight using UV lights. Perhaps you’ve looked for residue from diatomaceous earth or fungicides. Or, perhaps, you’ve trusted in the falsely-comforting “shoulder check” and assumed dripping must mean you’ve hit the target.
Existing methods are complicated, subjective, messy and time-consuming. We need an alternative.
The alternative
Consider a permanent, solar-powered sensor that supplies real-time spray coverage data to your smartphone via a cellular connection. The output could be visualised in a simple and intuitive way, and immediately available to both sprayer operators and farm managers. If the sensor was relatively inexpensive, sufficiently hardy, and easy to deploy, its utility would only be limited by your imagination:
Stakeholders could confirm the correct functioning of their equipment before committing to the application. Decisions could be made to change operational settings, repair equipment, or delay until conditions improved.
The sensors would provide coverage data specific to their location and orientation. Units could be installed in difficult-to-spray regions such as treetops, or canopy-centres, or fruiting zones. Sensors could be placed where pest/disease pressure has been historically high, or where wind is a known issue.
Large operations could install them in a test-row, where sprayer operators would perform a gauntlet-style calibration run prior to a day of spraying.
Spray records could inform compliance audits, supplement insurance or CanadaGAP traceability requirements, or be used in agronomic assessments.
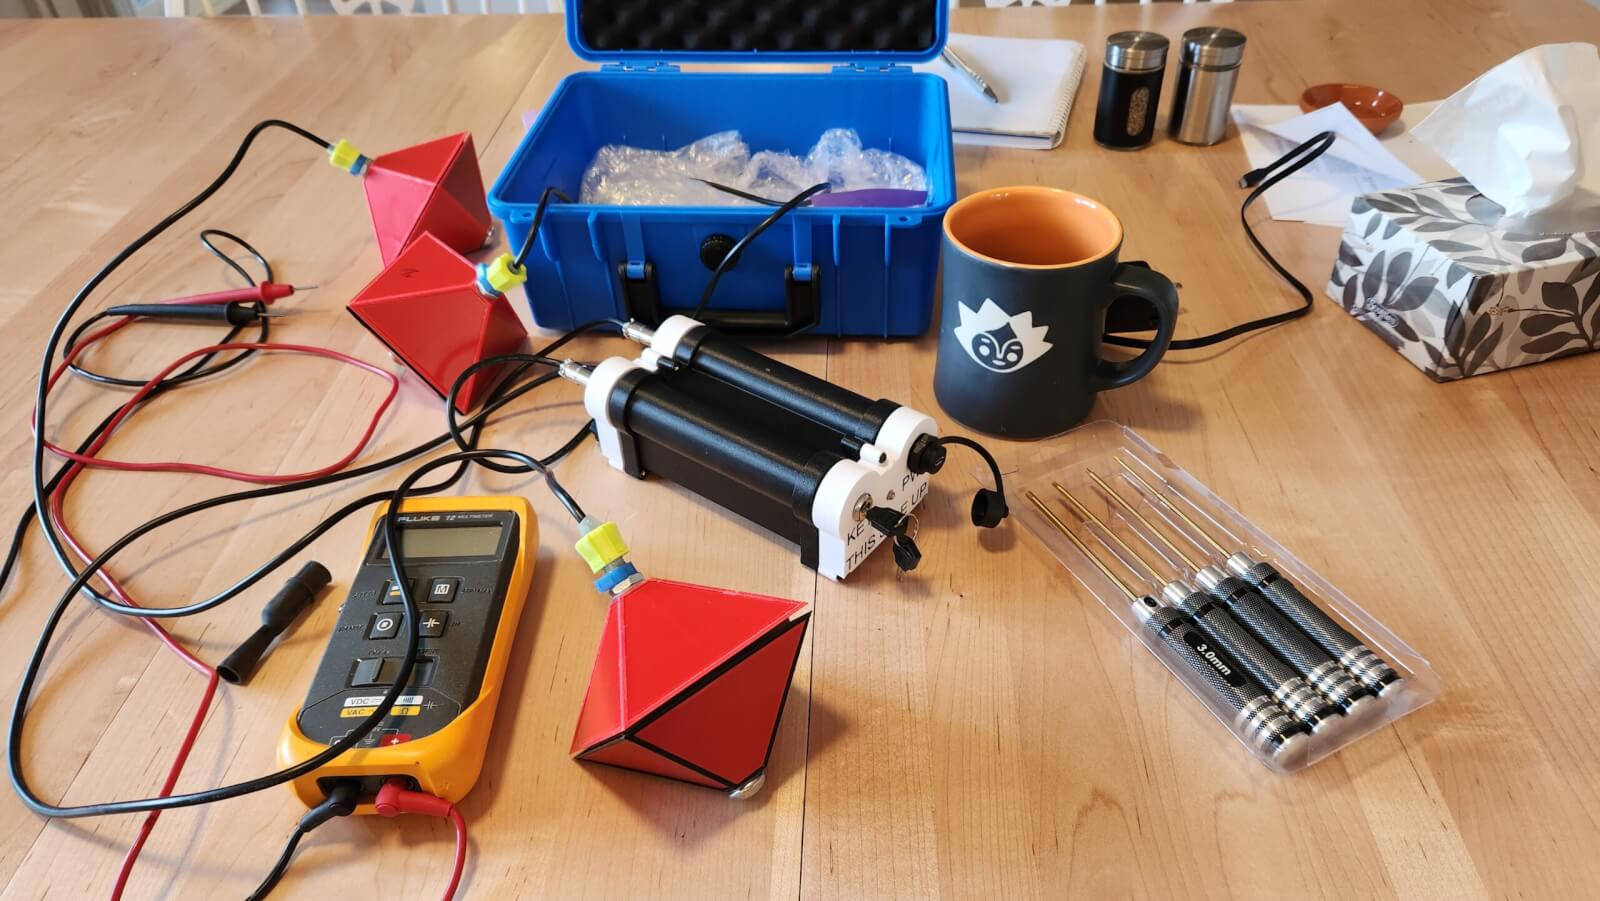
In 2025 I was approached by an Australian developer who claimed he had a device that did all of this. And, if that weren’t enough, it could also monitor certain meteorological factors such as pre-spray moisture levels and temperature and report post-spray evaporation rates. I could barely contain my excitement. A prototype was in my hands a few weeks later.
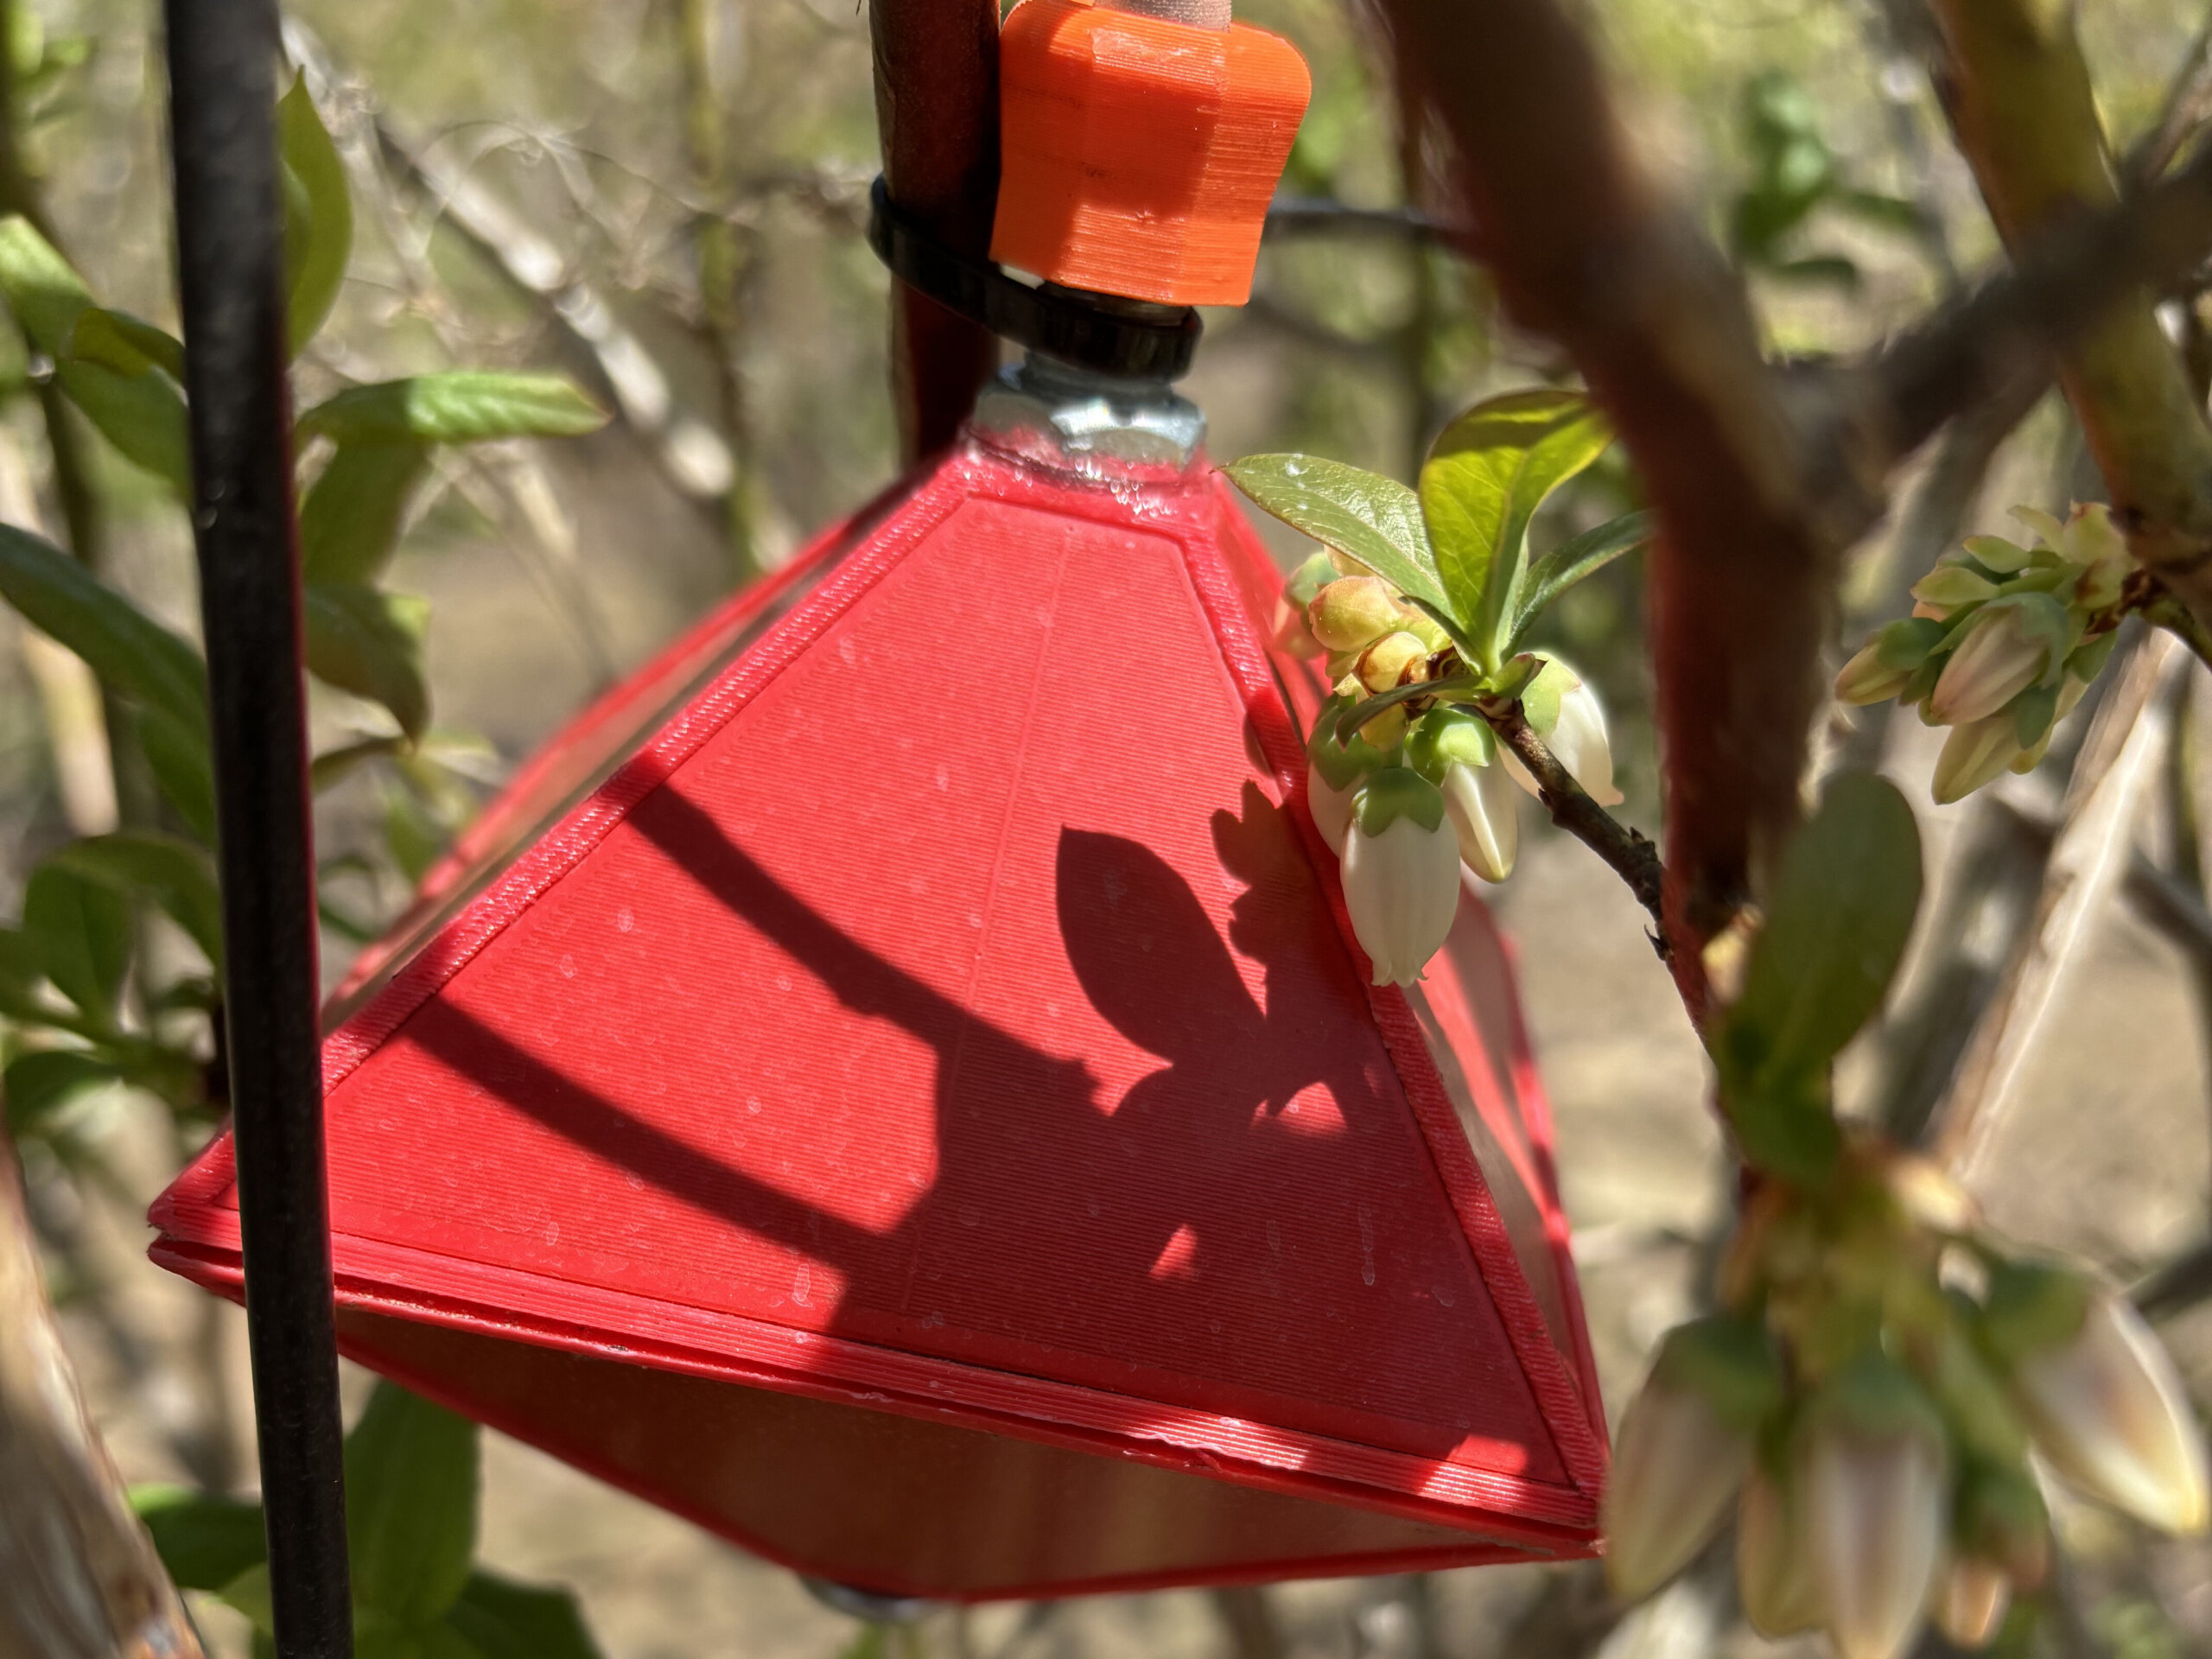
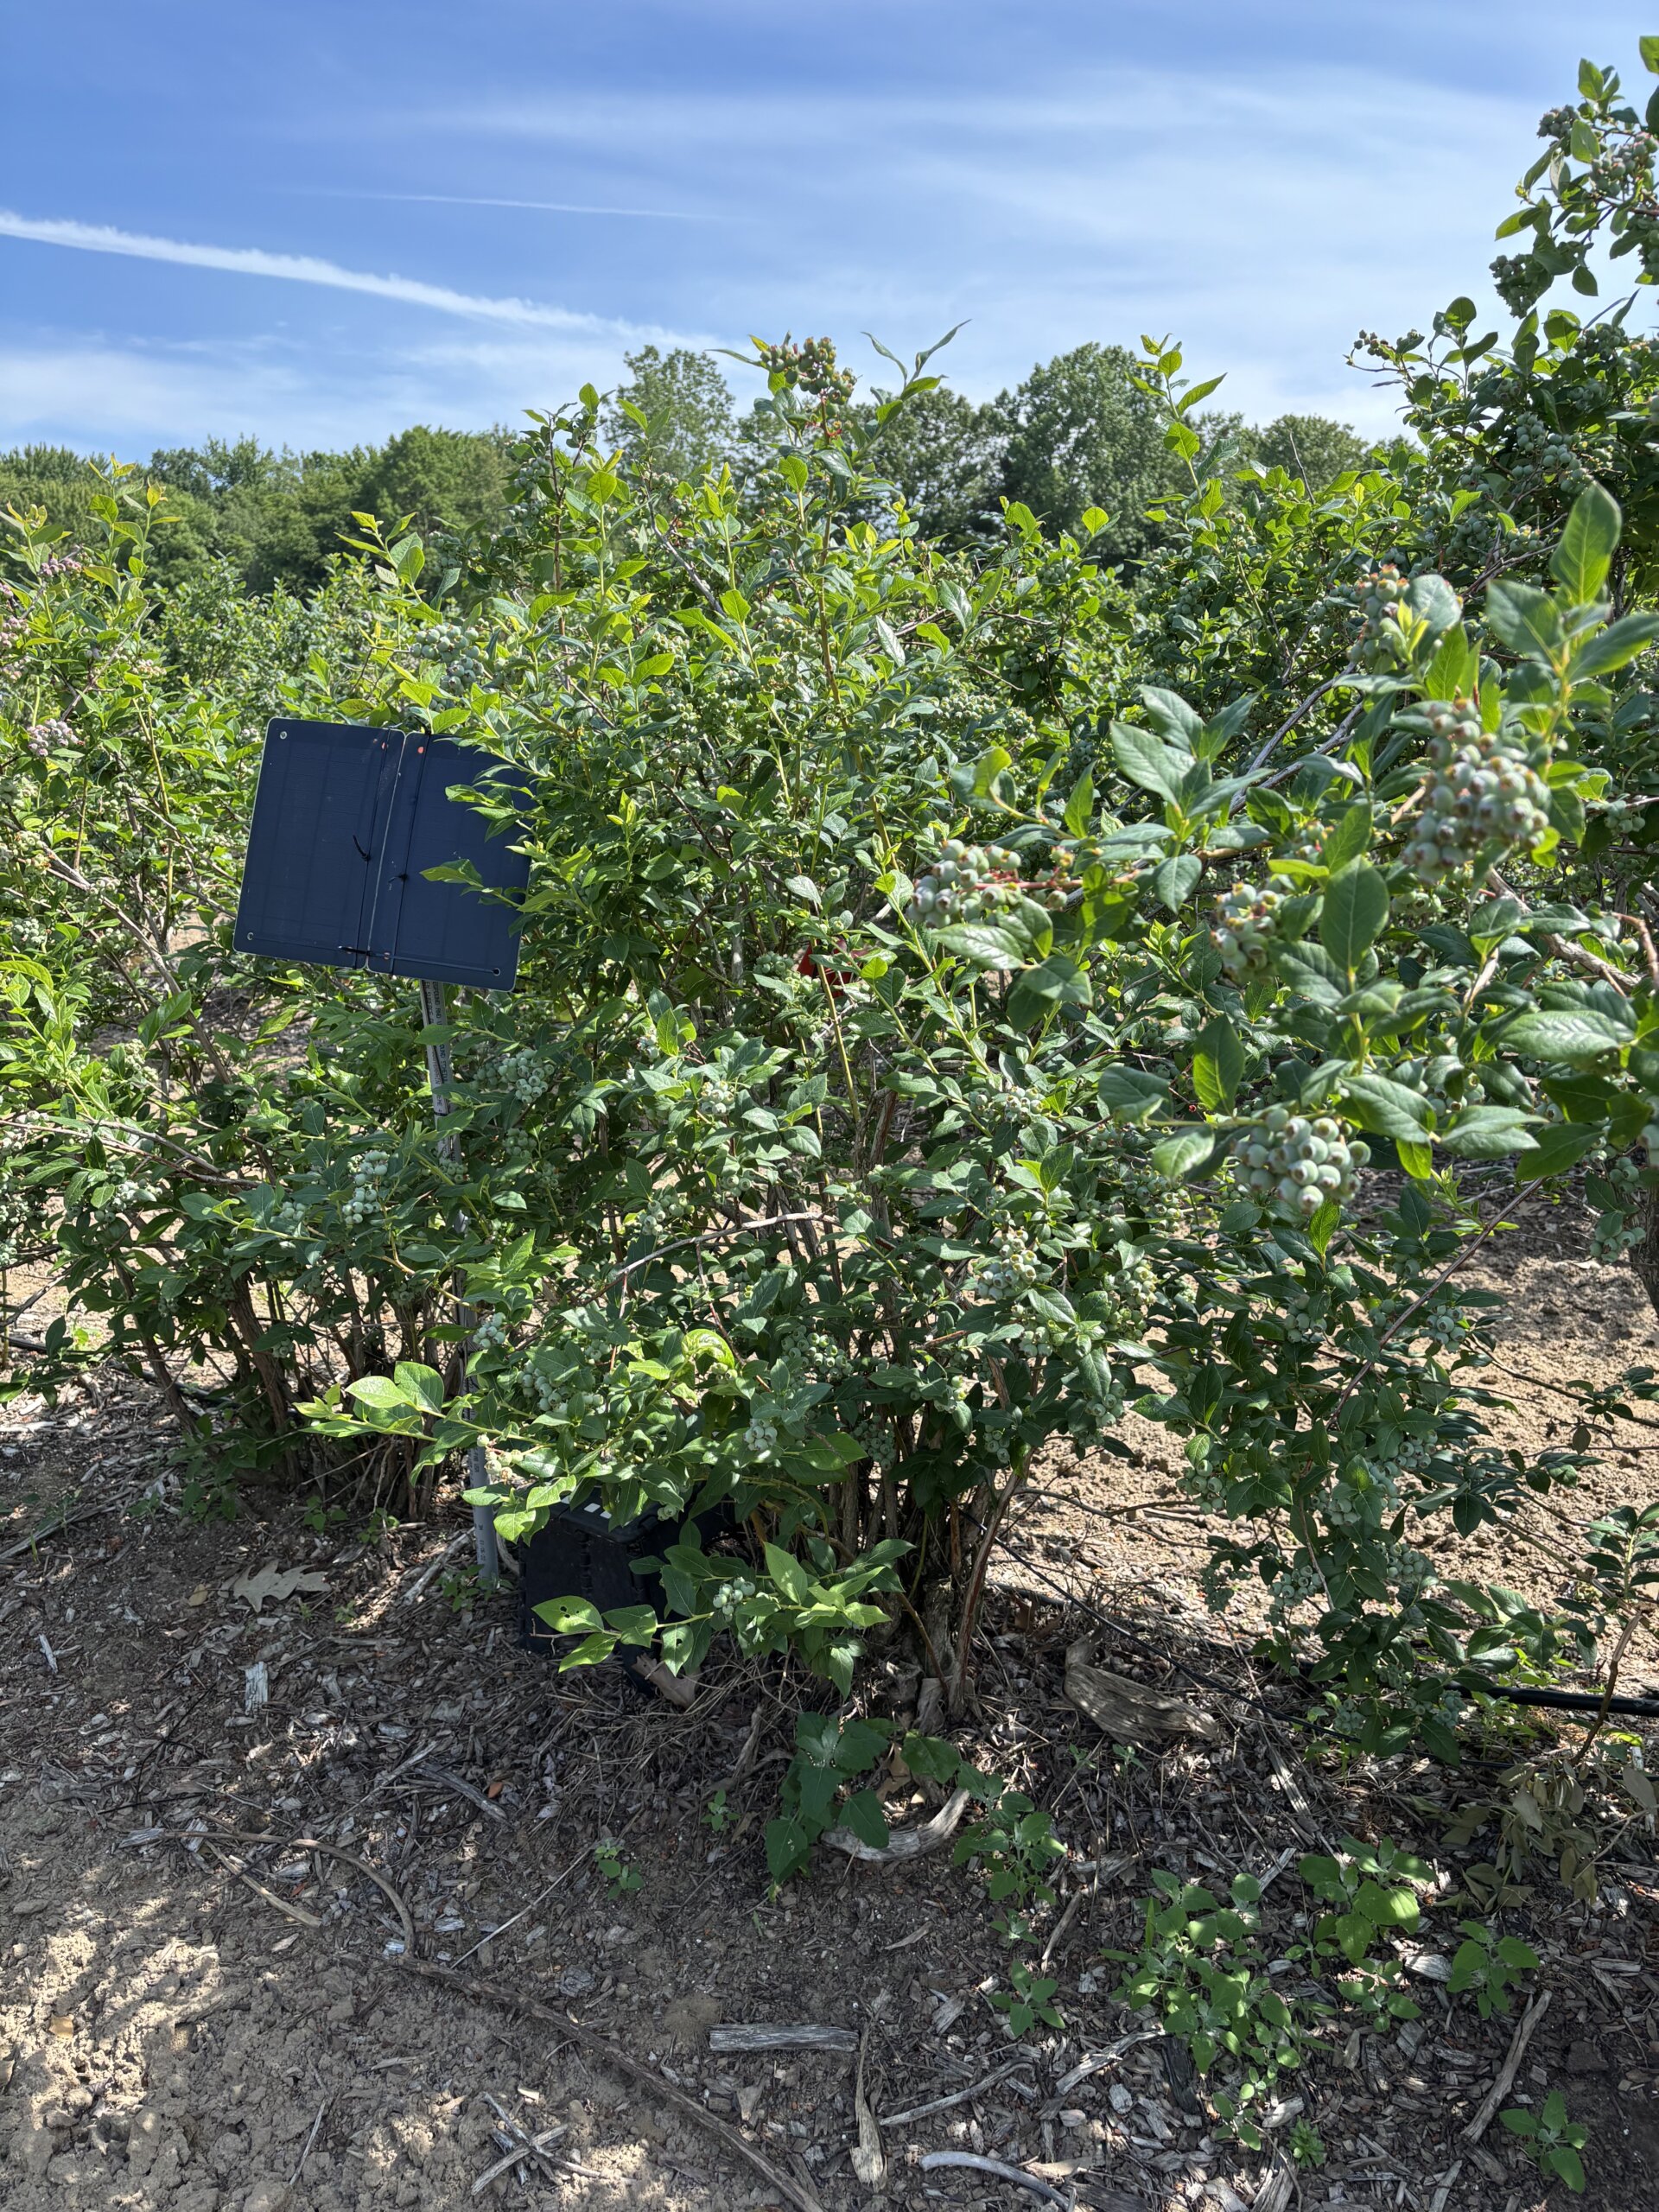
Prototype, 8-sided sensor located in a blueberry bush.Solar panel powering three, 8-sided prototype sensors spanning 10 meters of highbush blueberry.
Benchmarking the sensor
The Spray Doctor (working name for the prototype) started its life as a leaf wetness sensor, evolving into a spray coverage sensor piloted in 2023/24 in Australian and New Zealand grape production. The history of earlier iterations and company schisms is convoluted, and fortunately immaterial to our purposes. All I needed to know was that we weren’t starting from scratch. Several of the questions regarding how accurately the surface could detect spray deposition were already addressed by independent research.
The sensing surface is impregnated with an array of capacitive wetness sensors. The sensor responds to the surface area covered and not deposit density. Researchers reported a reliable response range between ~10% and 50% surface coverage. Given the arguable “ideal” coverage standard of 10-15% surface area, this includes the range of interest for most sprays.
Benchmarking against WSP was part of the foundational assessment. A droplet of water deposited on WSP produces a high angle of contact and very little spread, while the same droplet deposited on plant tissue tends to produce a lower angle of contact and more spread. This means the stain produced on WSP is smaller than would be produced on plant tissue, depending on how smooth, vertical or waxy the tissue surface was.
It was therefore surprising that WSP were found to report a higher degree of spray coverage during water-only sprays than the sensor. It seemed droplets more easily coalesced and ran off the sensor surface. This was ultimately interpreted as an advantage, because the sensor would better emulate how a leaf surface would respond to the influence of surfactants and spray quality.
Adding a surfactant to a spray solution improves droplet adherence, and/or reduces surface tension, improving the degree of contact on plant surfaces. Likewise, it was found that surfactants increased the degree of coverage reported by the sensor, and when actual chemistry was sprayed (e.g. sulphur powder or copper sulfate) there was an effect on the degree of coverage reported. This is unlike WSP, where adjuvants and chemistry do little to increase the spread.
And so, like every method for assessing spray coverage, the sensor has limitations and caveats. If you have some doubt as to the sensor’s accuracy, do not get distracted by the fine detail. Remember, most operators currently have no feedback whatsoever; even a binary response (e.g. hit or miss) would be welcome. The sensor is sufficiently sensitive and consistent to resolve coverage in a range relevant to most sprays, and therefore worth field testing.
The experiment
My role in this story was to work with a grower to evaluate the sensor’s ability to report coverage information in a clear and actionable way. There were three questions:
Does data from the sensor influence a sprayer operator’s behaviour?
Does that change in behaviour lead to improved spray coverage (implying more efficient and effective crop protection).
Could we “dial in” the hardware and the interface based on the grower’s feedback?
In part two, we share our experience installing and using the Spray Doctor, as well as supply answers to these questions. Stay tuned.
Thanks to Brandon Falcon (Falcon Blueberries) for volunteering his time and farm for this evaluation, and the developer for the in kind donation of the prototype Spray Doctor.
Investing in an optical sprayer for horticulture is not a straightforward financial decision. Compared with a conventional boom sprayer, the upfront capital cost is substantially higher, often by an order of magnitude, and most commercial systems require an annual software or service subscription to operate. Despite these barriers, adoption is accelerating, and many growers who have made the investment report very positive outcomes.
To help clarify when and where this technology makes financial sense, I developed a calculator to estimate the return on investment (ROI) of optical sprayers under a range of production scenarios. The goal of this tool is not to promote the technology, but to provide growers and advisors with a structured way to evaluate whether it fits their specific operation.
Note: This calculator was designed for onion and carrot production in Ontario, Canada. Model parameters can easily be adjusted reflect other production systems. However, if you need assistance making these changes you can contact me by email.
New versions may be uploaded as the calculator evolves through experience and based on user feedback, so check back. You can download Version 1.1 (April, 2026), HERE.
How to use the calculator
At first glance, the calculator may appear overwhelming because it requires a fair amount of information to be entered. This is the minimum data required to reflect real-world conditions while avoiding an oversimplification that could lead to misleading conclusions. Cells shaded in yellow are meant for user input. All other values are calculated automatically based on those inputs.
For convenience, the calculator is pre-filled with generic values derived from grower discussions and informal benchmarks. These default numbers are meant only as placeholders and to provide general reference. They are not sufficiently accurate on their own to support financial decisions.
Users should replace all default values with operation-specific data whenever possible. As with any economic model, the quality of the output depends entirely on the quality of the inputs.
The calculator is organized into three spreadsheets (see tabs at bottom).
1. Introduction
This tab provides general instructions and contact information. No data entry is required.
2. Sections Explained
This is a reference tab that explains each section of the calculator in detail. It is intended to help users understand how different inputs affect the results and the intention of each section (small table) withing the sheet. No values should be entered here.
3. Calculation Sheet
This is the main working tab. All data entry occurs here. To prevent accidental changes that could break formulas, the sheet is protected. For most input fields, a brief explanation is provided immediately to the right of the cell. In the results section, short interpretations are often included, such as: “Decrease of 36% ($101,250/year) in hand-weeding cost with optical sprayer.” Within this tab, scenario tables are also provided. These tables are designed to illustrate how different acreages of the two crops analyzed affect each of the calculated financial indicators.
Insights from scenario testing
Even using rough approximations, several consistent patterns emerge from adjusting the calculator inputs:
Herbicide savings alone rarely justify the investment
In high-value horticultural crops, herbicide costs are often a relatively small portion of total production costs compared with labor, equipment, and the overall value of the crop. In many cases, any reduction in herbicide expenditure is largely offset by increased tractor hours resulting from slower operating speeds and narrower effective spray widths typical of optical sprayers.
Labor savings can be decisive
When the technology results in meaningful reductions in hand-weeding, the financial impact can be substantial. This is especially true in crops such as onions, where hand-weeding is both costly and difficult to source reliably. In these situations, labour savings alone can drive a favorable ROI.
Yield protection may outweigh cost savings
Several growers report stand losses and weakening associated with herbicide phytotoxicity as a major production risk. By limiting spray exposure to crop plants, optical sprayers can significantly reduce or even eliminate this issue. In high-value systems, relatively small yield gains resulting from improved crop safety can translate into revenue increases large enough to justify the technology, even if other savings are modest.
Scale matters
When evaluating advanced sprayer technologies, scale becomes a decisive factor. The high capital investment and ongoing service fees may be difficult to justify for small, and in some cases, even medium-sized operations.
What about herbicide resistance?
The long-term implications of optical sprayers for herbicide resistance management are still uncertain. Recent research from the University of Arkansas has raised concerns in field crop systems, suggesting that poorly optimized optical spraying can result in short term gains, but these can be outweighed over time by higher weed escape rates compared with broadcast applications. If these escapes are allowed to grow and set seed, rapid seedbank replenishment and accelerated resistance development may occur.
This highlights an important limitation of short-term ROI calculations. A single-year economic benefit may look attractive, but if the system allows even a small number of weeds to consistently escape and reproduce, the long-term consequences can be severe.
On the other hand, optical sprayers may eventually enable new resistance-management strategies. It is possible that new active ingredients, higher labelled rates, or novel use patterns could be registered specifically for targeted spraying in horticultural crops that would not be feasible with broadcast applications. Such developments could significantly improve resistance management tools. As always, it is essential to remember that the label is the law: only registered products and rates may be used, regardless of perceived crop safety.
ROI implications beyond herbicide spraying
Optical sprayers can deliver value beyond herbicide applications, even though weed control is their primary use. These additional uses may improve overall ROI. However, because their economic impact is still difficult to quantify, they have not been included in the calculator.
Depending on the model, additional value-generating capabilities can include:
Creation of weed maps: Some systems can generate weed maps automatically while spraying, at no additional operational cost. These maps can support future management decisions.
Application of fertilizers and other pesticides: Although optimized for herbicides, optical sprayers may also be used to apply other inputs, such as fertilizers or non-herbicide pesticides.
Crop thinning: Certain manufacturers have developed algorithms for automated crop thinning, particularly in crops like lettuce.
Conclusion
Even using approximate inputs, it is clear why optical sprayer adoption is expanding rapidly in Canada.
For medium to large-scale operations, the ROI can be highly attractive, and the range of potential benefits continues to grow.
As the technology matures, more equipment options are emerging to serve a wider diversity of crops and farm sizes.
Manufacturers are introducing wider and more flexible platforms, and Ontario-based companies are actively developing alternative machines and service-based business models that may better suit smaller operations.
It is difficult to argue that optical spraying is a passing trend. While it’s not a universal solution and must be implemented carefully, the technology is clearly here to stay. It will reshape weed management and production economics over the long term.
This case study is taking place on a 15 acre highbush blueberry operation in southern Ontario. In 2016, considerable pressure from spotted-wing drosophila (SWD) prompted the growers to make changes to their crop management practices and their spray program. They employed a three-pronged approach to improving crop protection:
Significant changes to canopy management and picking / culling practices
Investing in a new sprayer
Adopting the Crop-Adapted Spraying (CAS) method of dose expression
We have been tracking pesticide use, water use and yield compared to historic values. We also monitored spotted-wing drosophila catches both in crop and in wild hosts along the border of the operation for three years.
Canopy Management
In 2016 the operation made the following changes to their canopy management practices:
They performed their first-ever heavy pruning and planned to to maintain an ideal crop density by removing ~30% plant material annually. This more-or-less took place.
They regularly collected and buried culled and dropped berries.
They picked cleanly and more frequently.
Heavy pruning in 2016.Most years, bushes were pruned ~30% to maintain an ideal size and shape.Pickers were educated in how to pick cleanly and dropped / culled fruit was collected and buried.
There were initial concerns that such dramatic pruning would reduce production per acre and require trellising to prevent berries weighing down the smaller bushes. However, in 2017 (and thereafter) they found that the quality of the berries was greatly improved and noted fewer hours spent culling berries during packing. Financially, the growers felt they came out ahead.
Application Technology
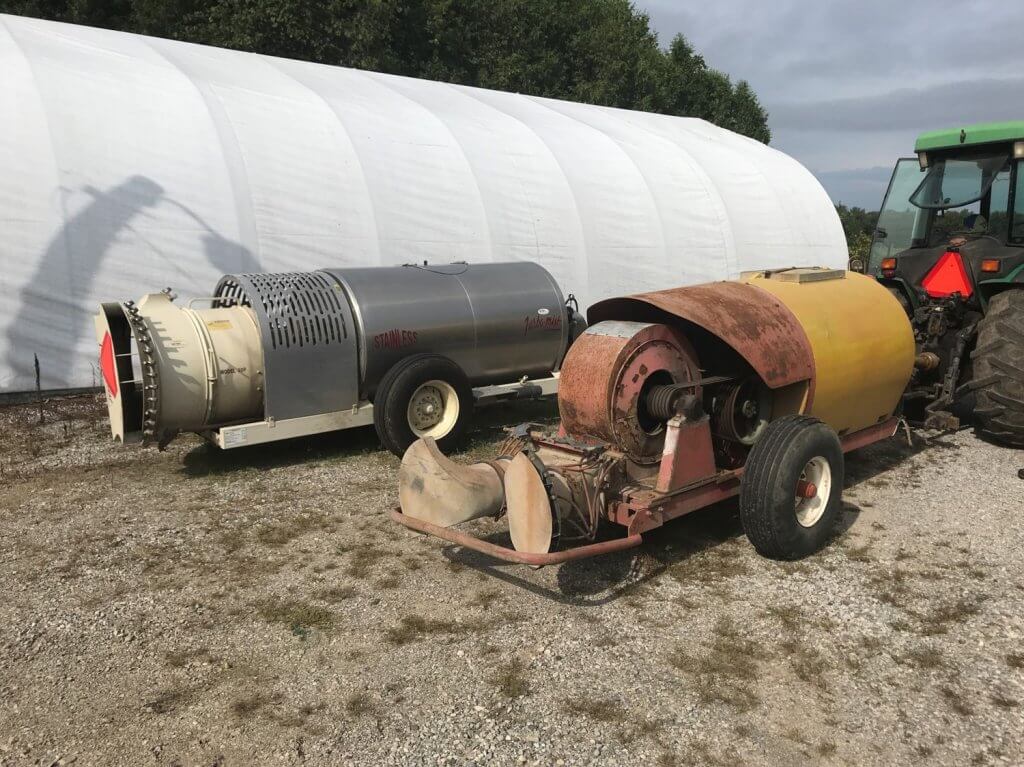
In 2018 they replaced their old, inefficient KWH sprayer with a low profile axial with conventional hydraulic nozzles to permit greater control of the spray. The KWH design was intended for standard fruit trees. It produced >100 mph air and an Extremely Fine spray quality and was therefore a bad fit with the planting architecture and canopy morphology of highbush blueberry.
They considered a cannon-style sprayer hoping to spray multiple rows in a single pass but given the desire for improved coverage and reduced waste, they elected to drive every row using a low-profile axial.
Fore: An old KWH air shear sprayer. Rear: Low profile axial sprayer with conventional hydraulic nozzles.
The new sprayer was more reliable, quieter, and more fuel efficient. Further, the old sprayer leaked and the air-shear nozzles did not respond when shut down at the end of rows. Eliminating these sources of waste represented a savings of ~20% of the spray volume traditionally used per acre.
Crop-Adapted Spraying
The redundancy inherent to product label rates for three-dimensional perennial crops has long been recognized. In response, rate adjustment (or dose expression) methods have been developed to improve the fit between rate and canopy coverage (e.g. Tree-Row Volume, PACE+, DOSAVIÑA). Each has value, but their adoption has been slow because they are region- or crop-specific and they can sometimes be quite complicated.
CAS lends structure and repeatably to the informal rate adjustment methods already used to spray three-dimensional perennial crops (e.g. Making pro rata changes by engaging/disengaging nozzles in response to canopy height or altering travel speed in response to canopy density).
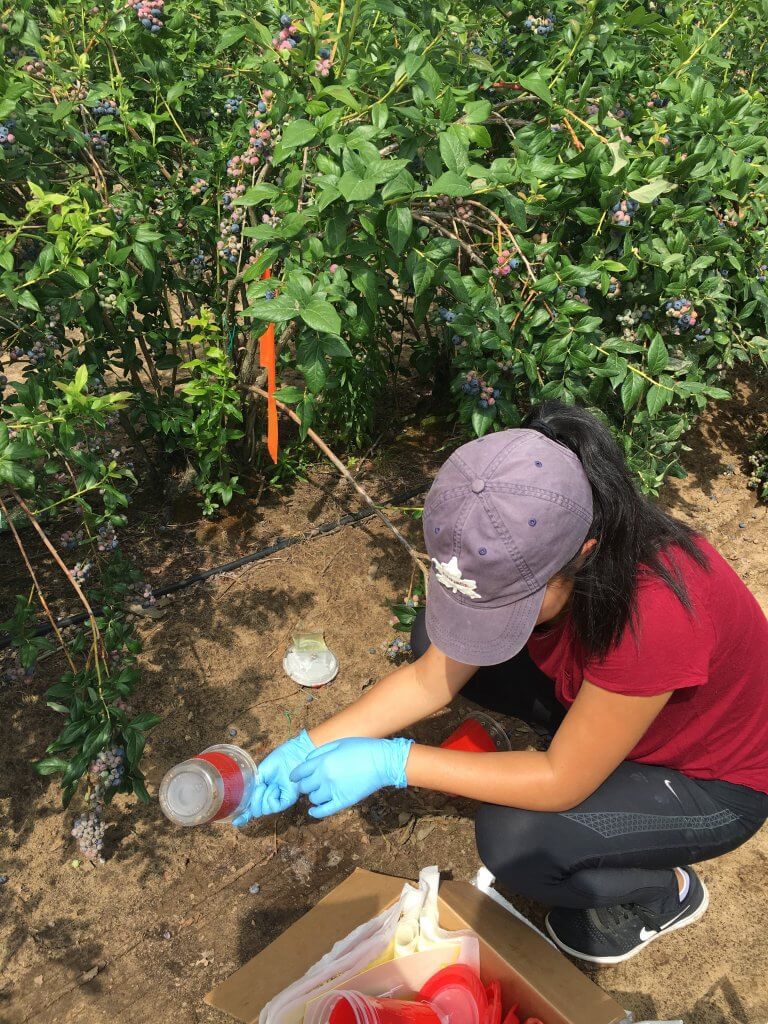
The CAS method relies on the use of water sensitive paper to confirm a minimal coverage threshold of 85 deposits per cm2 as well as 10-15% area covered throughout a minimum of 80% of the canopy. Using this protocol, we calibrated air energy and direction, travel speed and liquid flow distribution. This process is covered in detail here and in the new edition of Airblast101. In that first year we reassessed coverage every few weeks between April and June using water-sensitive paper.
Spray volume / Pesticide
By matching the sprayer calibration to a well-managed canopy, the growers were able to go from ~1,000 L/ha to ~400 L/ha of spray mix. The ratio of formulated product-to-carrier remained the same, but less spray was warranted per acre. Stated differently, the grower mixed the spray tanks per usual, but drove further on a tank.
This also saved an estimated 15 hours of filling/spraying time per year, which translates to reduced operator fatigue and exposure as well as reduced manhours and equipment hours.
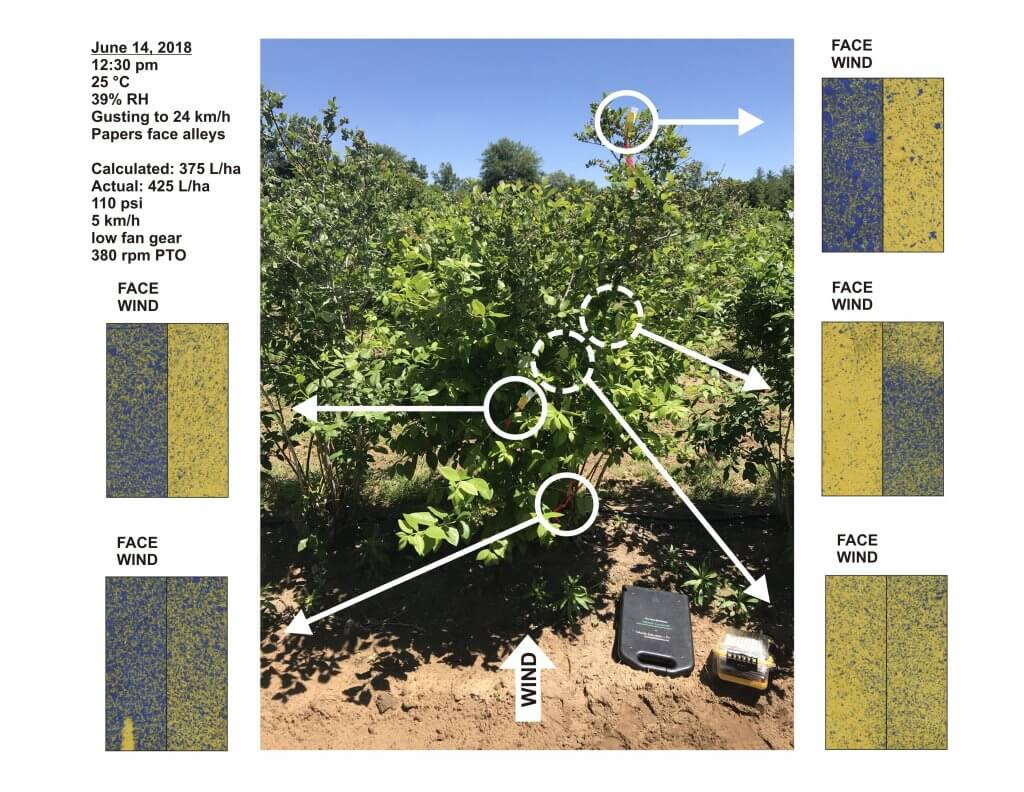
The decision of what and when to apply was at the growers’ discretion. Chemistry was rotated and applications were made according to IPM in early morning (if there were no active pollinators) to avoid potential drift due to thermal inversions. The following image shows what those papers looked like in June of the first year.
Example of water sensitive paper coverage on a windy day (worst case scenario) in June, 2018.
Note how little spray escapes the target rows in the following video. The wind was too high for spraying, but we were only using water and saw it as an opportunity to test a worst-case scenario. Air-induction hollow cones were used in the top nozzle position on each side so droplets were large enough to fall back to ground if they missed the top of the canopies.
SWD monitoring
SWD represents a serious economic threat to blueberry operations. Traps were placed in the operation (three in the crop and one in an unmanaged wild host along a treeline) and monitored weekly. Traps were also placed in surrounding horticultural operations which were employing standard pest control practices. This not only provided regional information about SWD activity but allowed us to compare the level of SWD control from the Crop-Adapted Spraying approach.
In 2018 the comparison included up to 16 other sites that were berry and tender fruit.
In 2019 the comparison included 10-12 sites (depending on the week) and they were berry and tender fruit sites.
In 2020 the comparison included 4 other sites (blueberries, raspberries and cherries).
2020 & 2021 – Covid 19 and Heavy Rain
In agriculture, every year is an adventure, but 2020 and 2021 were exceptionally difficult and the circumstances should be considered when deciphering the results. Covid-19 has had a significant impact on global agriculture.
In 2020, fearing a reduction in the availability of seasonal labour, the operation pruned their bushes heavily. This was done to reduce the yield in order to make harvest manageable.
In 2021, labour was once again secure. Given the heavy pruning the year previously there was no need to prune again, so the crops densified. This coincided with abnormally high levels of precipitation to create significant anthracnose issues. Additional fungicide applications took place that raised costs, but the grower maintained CAS-optimized rates and sprayer settings.
Quantitative Results
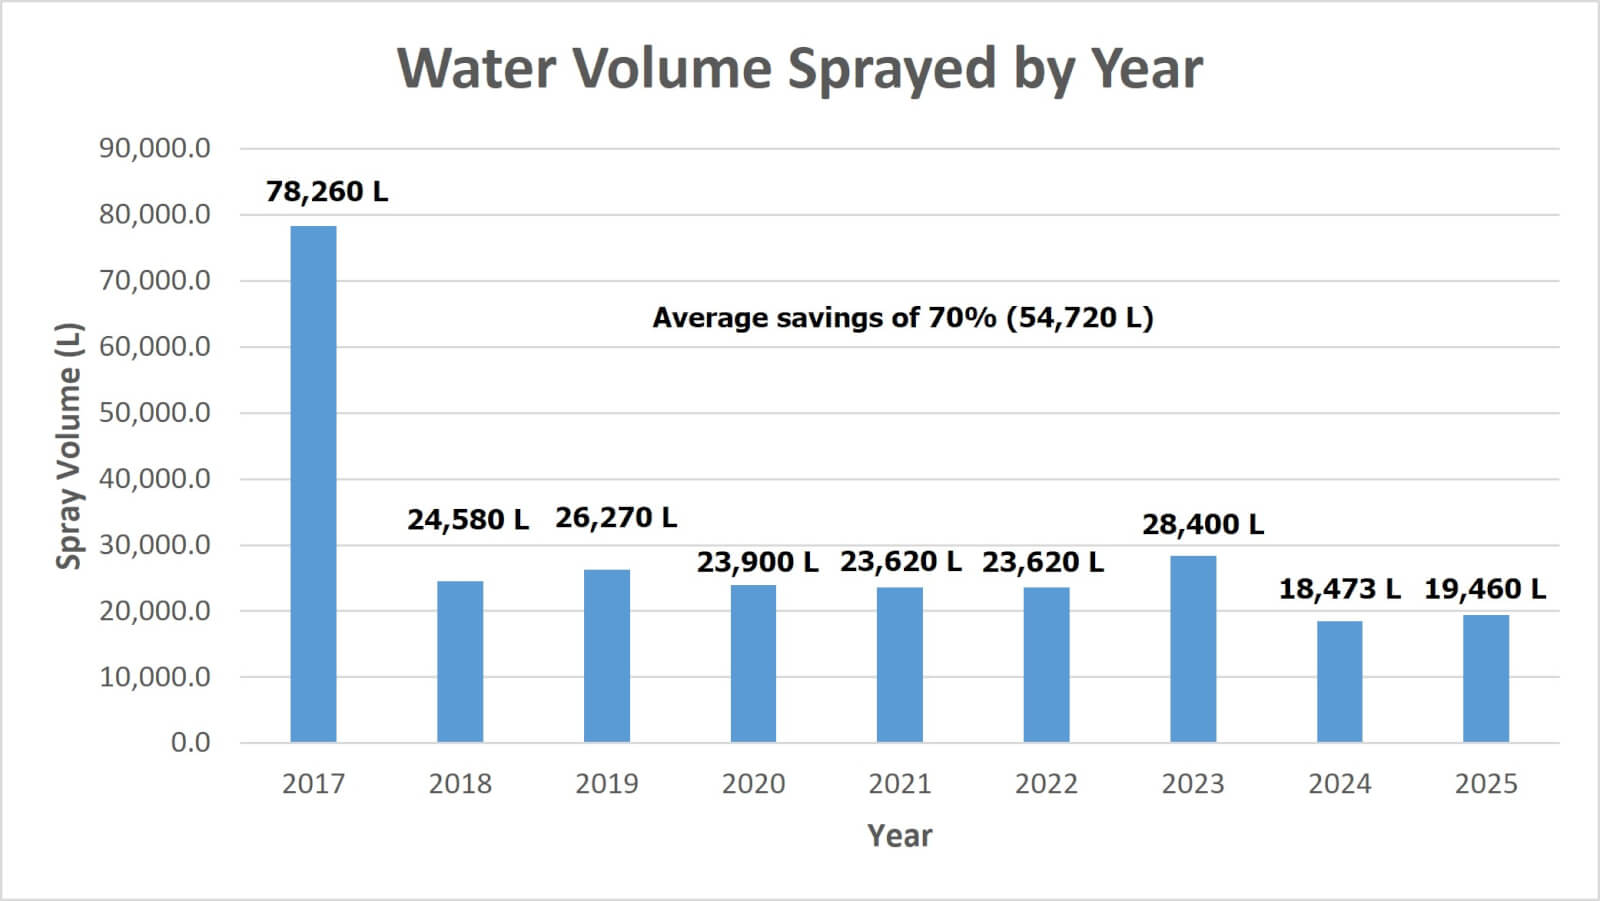
Prior to replacing their sprayer, and adopting CAS, the operation sprayed about 78,260 L/yr. Their average savings in spray volume (water) has been 54,720 L/yr, or 70%.
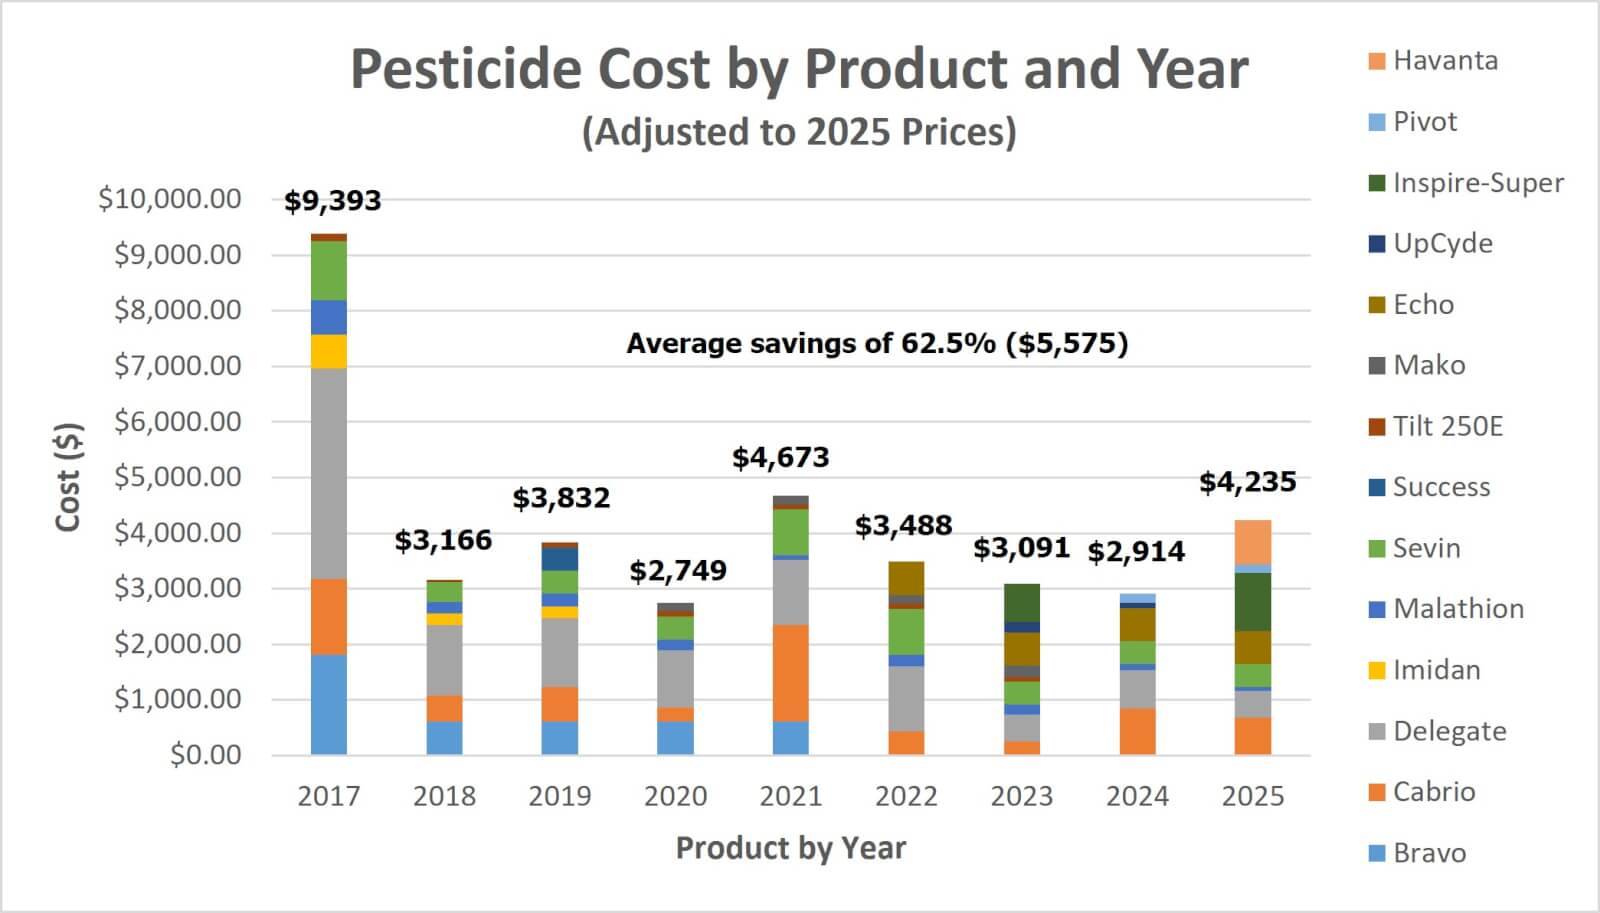
In terms of pesticide savings, we compare each year to the 2017 baseline. In order to make for a fair comparison, we update pesticide prices each year using current costs. Therefore, the 2017 total has increased by about $2,600.00 (wow). Their average savings represents $5,575.00 CAD/yr or 62.5%.
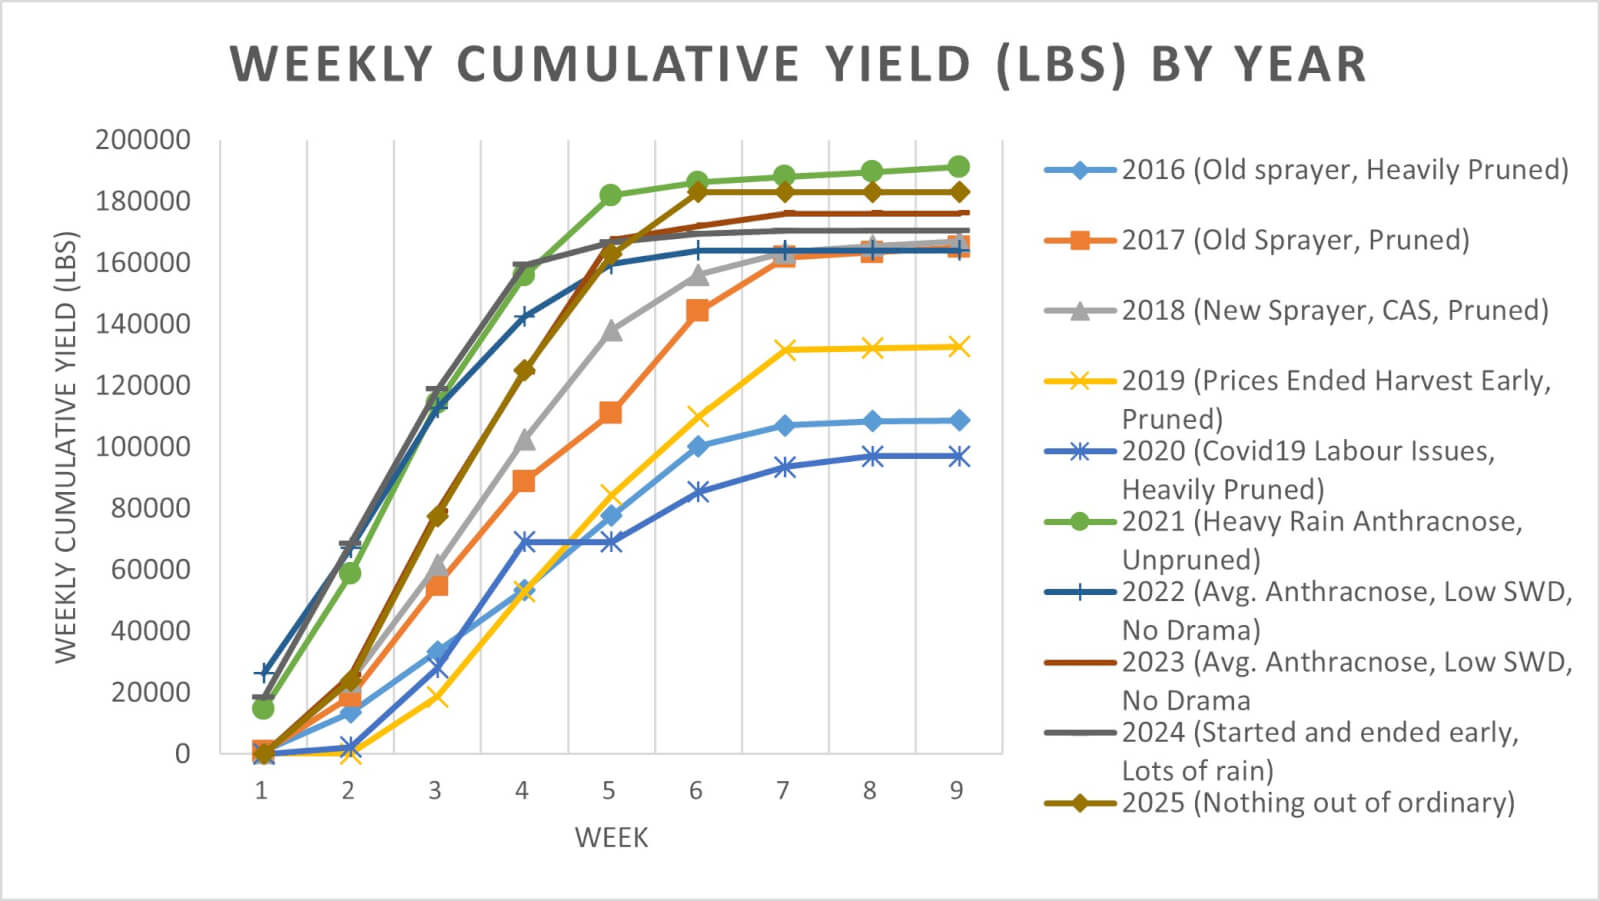
Yield is more difficult to interpret due to mitigating circumstances in 2019 and 2020:
In 2016, prior to any changes, they harvested 12,076 flats (about 9lb of fruit each).
In 2017, following the canopy management changes, harvest increased to 18,335 flats (~50% increase).
In 2018, using CAS, harvest was essentially unchanged compared to 2017, which was excellent.
In 2019, harvest started a month late compared to previous years. Further, blueberry prices were low, and the operation elected to stop harvesting a month early. However, when those issues are factored in, the harvest was comparable.
2020 was particularly challenging for agriculture and with the possibility of reduced labour due to the pandemic, the operation elected to prune heavily and reduce their yield.
2021 saw unpruned bushes (following the heavy pruning in 2020) and abnormally high levels or precipitation which created anthracnose issues. As a result, more applications were made than any other year on record, but maintained the CAS-optimized rates and sprayer settings.
2022 was (thankfully) fairly typical. Low SWD, average anthracnose and no drama.
2023 was very much like 2022 with low SWD, average anthracnose and no drama.
2024 saw a LOT of rain. The season started and ended early, but yields were par. “Pivot” replaced “Tilt”.
2025 was pretty average all things considered. No drama whatsoever. “Inspire-Super” was added to product list.
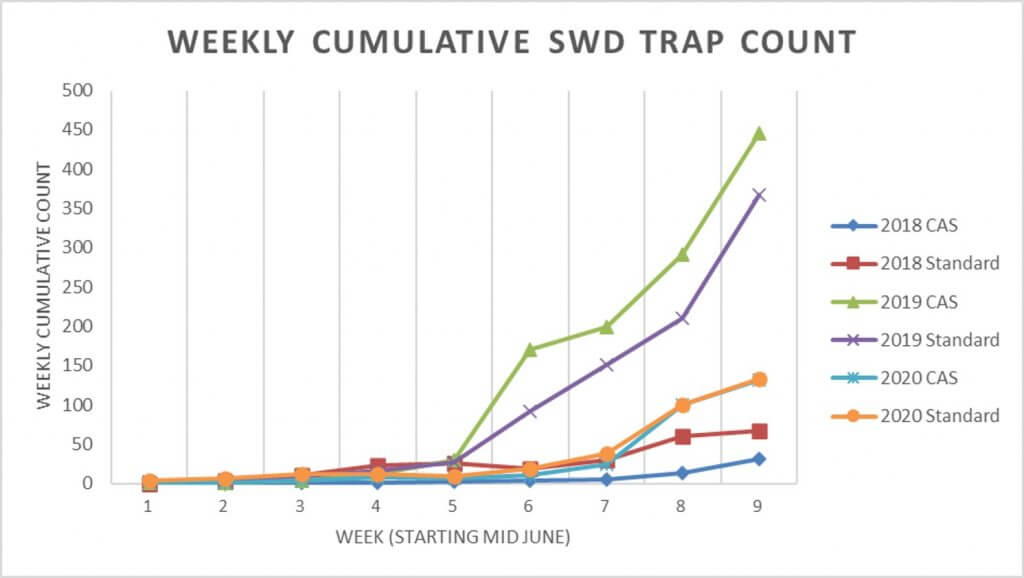
Trap counts for SWD were only performed during three years of the CAS study, so we are only able to present 2018-2020 data. It should also be noted that while the presence of SWD in an operation represents an impact on yield, there is not necessarily a correlation between the number of SWD captured the amount of damage.
In 2018 and 2020, average counts were higher in the surrounding operations employing standard practices (STD) compared to the CAS trial. In 2019, average counts were higher in the CAS trial. When total average counts are compared, the difference is negligible. Berries were tested regularly by the growers and the damage due to SWD was within acceptable limits. It should also be noted growers monitored and reported satisfactory disease control throughout the study.
We have not applied any statistical rigor, but the trend suggests that the level of control provided by the CAS method was comparable to conventional methods. This conforms with our previous results in Ontario apple orchards and similar evaluations of optimized application methods world wide.
Qualitative results
Beyond the quantifiable results, the growers reported qualitative benefits:
Customers of the U-pick portion of the operation regularly enquire about pesticides. The operation’s reduction in pesticide use became a positive speaking point and aligned with the grower’s philosophy about reduced environmental pesticide loads.
While many blueberry growers experienced a market shortage of certain fungicides in 2018, this operation returned unused product to the distributor.
Growers reported less early-season disease damage, which saved considerable time on the packing line because there was less fruit to cull. Disease levels rose to typical levels later in the season, but there was still a net savings in labour.
Conclusion
The success enjoyed in this berry operation was a result of several canopy management and crop protection changes. This is a situation where the whole equaled more than the sum of its parts – it could only be achieved by making holistic changes to the operation. At the end of three years the growers themselves stated:
“Based on my experience losing multiple crops to SWD, I can say with absolute certainty it works. <The results are> superior to what I expected. What we are doing is successful.”
Here’s a narrated PowerPoint presentation of this study (includes data up to 2020):
The monitoring portion of this project was funded by Niagara Peninsula Fruit and Vegetable Growers Association, Ontario Grape and Wine Research and Ontario Tender Fruit Growers in collaboration with private consultants.
I’ve experienced a few spectacular failures trying to build niche sprayers. Until now, I haven’t had a reason to write much about them. But I decided the contrast, and confession, would be a fun way to set the scene for a discussion about an excellent niche sprayer.
Failed Attempts
First, the ill-fated “Hops Sprayer”. We used an adjustable ladder to position 20 feet of arborist guns between hop rows. The nozzles could be raised and engaged to match the growing crop canopy. While it left decent coverage on the adaxial surfaces, we quickly realized it needed air-assist to get under the leaves and battle high winds at the top of the trellis. It’s since been cannibalized for parts, and the rusted remains haunt me whenever I drive by the outdoor storage area at our ag research station.
The Hops Sprayer. A 3 point hitch, vertical boom that could adapt to match canopy height.
Later, encouraged by a minor success ducting a backpack mist blower with PVC and Coroplast, I tried building an air-assisted spray cart for a floriculture operation. It featured commercial, high-volume radial fans paired with hollow cone nozzles positioned in front of the air outlets. With respect to GreenTech and Croplands Equipment in Australia, I tried to build a bargain-basement SARDI-style head.
When it wasn’t threatening to tip over, it managed decent coverage over almost 2 meters. Almost.
As it turns out there’s a very good reason engineers use computational fluid dynamics to design air-assisted sprayers. We were ultimately beaten by an uneven greenhouse floor crowded with obstacles, a stiff canopy of geraniums, and the inverse square law, which states: “The farther away an object is from an effect, the less change can be observed in the object”. This rig now has a new life circulating hot air in a boiler room.
And I once built an air-assisted, tow-behind sprayer to spray troughs of tabletop, hoop house strawberries. That unit laid down an excellent, uniform spray on all foliar surfaces, but it was frustrating to use. There was almost no clearance in the hoop house, which changed height with the topography, and the alternator couldn’t keep the battery sufficiently charged to run the pump and fans. I felt we could overcome these small difficulties, but sadly the operator ended this experiment halfway through the season. I can only assume the sprayer is now an interesting piece of lawn sculpture.
This sprayer had potential, but limited resources prevented it from getting beyond the beta stage.
The Micothon M2
Despite my inability to build a decent air-assisted sprayer, I have always maintained that air-assist is the secret sauce for efficient, uniform spray coverage. Lucky for me, Great Lakes Greenhouses (GLG) agreed. No stranger to innovation, the company recently purchased a first generation, air-assisted Micothon M2 greenhouse sprayer and invited me to come see it. This was a proper sprayer designed by engineers, and not a delusional plant physiologist, so I was excited to assess and calibrate it. This article will describe what we learned and perhaps in some small way, validate my failed attempts.
A quick walk around before we got to spraying.
The M2 features a vertical boom design supported by a portable tender unit, but that’s where the similarities to a classic “tree” sprayer end. Rather than riding on the hot water pipes, or tipping onto two wheels like a hand cart, this version rides on self-leveling wheels. It is drive-assisted but still has to be guided by an operator, like a self-propelled walk-behind lawn mower.
Drive-assist, self-levelling wheels.
The mast features 18, three-position nozzle turrets (nine to a side). GLG requested a bespoke spring-loaded break-away section at the top of the boom. This allowed the top nozzles to “duck” under an annoying section of greenhouse infrastructure that would have otherwise prevented it from being positioned between the rows.
A spring-loaded, break-away boom section (with guard) to prevent impact damage.The break-away section in action.
The air is generated by a centrifugal fanpowered by a Honda motor. The air travels up the ducted mast to a manifold of narrow air outlets. When the sprayer is moving, the air outlets precede the nozzles, which initially seemed wrong as the spray would be released outside the air stream. But, upon closer inspection, we saw that the air outlets are not only angled up by 45 degrees but are also angled back so the air can transect the spray.
Air outlets and nozzles – front view.Air outlets and nozzles – side view.
It was suggested that the blade of air acts like an airfoil, creating an area of low pressure and sucking small droplets into the airstream. This is Bernoulli’s principle and it describes how wings create lift. Personally, I think it behaved more like a Venturi. I’m open to debate since, as evidenced by my attempts at building a sprayer, I’m no engineer. What matters is that we didn’t see any droplets hanging in the air as the sprayer passed. It works.
Calibration and Optimization
We followed the same greenhouse sprayer optimization protocol I’ve outlined in this article. Go give it a quick read and come back so I won’t have to reiterate why we took the steps we did.
Travel speed and air settings
The sprayer was set to speed “3” of a possible “5”, as recommended by Micothon. Travel speed dictates dwell time, which is the duration the air is focused on the target. Observers stood in the drive alley and in the two adjacent alleys to see how the air moved leaves. The upward angle of the outlets combined with the volume produced by the centrifugal fan wafted and twisted leaves on their petioles. This created sufficient movement throughout the canopy, but not so much that it caused the canopy to louver shut. It was a Goldilocks situation so there was no need to alter anything.
Preparing to guide the Micothon M2 through the cucumbers under red LED lights. This image gives perspective of canopy height, density and the sprayer clearance.
Pressure and nozzles
The tender system regulator was set to 41.5 bar (600 psi) and that pressure dropped to 5.5 bar (80 psi) according to the gauge on the sprayer. While we didn’t test it, I’m certain the pressure at the furthest (aka highest) nozzle would have been closer to 5 bar (~70 psi). With observers in place, we started spraying water using the Albuz 025 (lilac) hollow cone tips.
We saw the highest nozzle positions were spraying over the canopies and did not need to be on. We also saw drip points form at the tips of the leaves and the bottom of the cucumbers. There was evidence of yellowed (possibly damaged) tissue at the leaf tips, suggesting they were often sprayed to drip. This is wasteful and tends to redistribute deposits in undesirable ways. While it’s hard to avoid on the waxy, vertical cucumbers, it can be prevented on the leaves.
Note the drip point formed at the bottom of the fruit. This is hard to avoid, but can at least be minimized.
We turned off the top nozzles, swapped to Albuz 02 (yellow) hollow cones, moved to an unsprayed canopy and tried again. Effectively this was a 20% cut in water and product, but there were no more drips on leaves and less evidence of coalescing deposits. The cucumbers still had drip points, but without an adjuvant that was the best we could do. That’s assuming there would be value in spraying the fruit in the first place – these sprays were targeting the foliage.
Coverage
With the subjective part of the assessment complete, it was time to quantify spray coverage. Water sensitive papers were oriented co-planar with the leaves and essentially parallel to the ground. We clipped them 2-3 cm below the leaves by affixing them to the petioles. This way they would move with the leaf and represent a very challenging target (reminiscent of a sucking insect on the abaxial leaf surface).
This is a difficult target to hit. The spray must get up between the leaf and upper side of the water sensitive paper, which is not in line-of-sight of the nozzle.
We divided the canopy into quarters, placing one target in each section. This spanned the height of the canopy, but we also positioned them along the canopy depth: One on each of the four plants in the row. This left us with a diagonal cross-section. Read it again – you’ll get it.
Then we sprayed the row from one side and inspected the results. We saw excellent coverage on the abaxial surfaces of the two plants closest to the sprayer. We expected that. But we were pleasantly surprised to see the spray got in under the umbrella-like leaves and deposited on the adaxial surfaces. This was not line-of-sight for the nozzles, and there wasn’t much room between the paper and the underside of the leaves, so this was clearly the result of air-assisted droplets.
There was also respectable coverage on the two plants on the far side of the row. These targets were greatly improved once we travelled down that alley and saw the cumulative coverage. This is why you should (almost) never perform alternate row spraying.
Abaxial side of the water sensitive papers. From left to right, papers ascended from the lower quarter of the nearest plant to the upper quarter of the farthest plant in the row.Adaxial side of the water sensitive papers. From left to right, papers ascended from the lower quarter of the nearest plant to the upper quarter of the farthest plant in the row.
Compared to a tree
Since I was in the neighbourhood, we decided to see what a conventional, hydraulic tree could do by way of comparison. Frankly, there was none.
A typical greenhouse tree. Note the 1/4 turn drain near the pressure gauge, the lack of check valves, and the uneven distribution of the nozzle positions (i.e. more at the top) likely intended to direct more flow higher in the canopy.
The tree was nozzled with Albuz 04 (red) hollow cones angled upwards. There were only a few check valves, so it leaked when it was turned off and had to be drained at the end of each row using a quarter turn valve. Coverage was generally excessive (i.e. coalesced droplets and lots of run-off) and non-uniform (we randomly missed both adaxial and abaxial surfaces).
Run-off was so pronounced that it washed the dye off the water sensitive papers.
We re-nozzled to my favourite load out: TeeJet TwinJet fans alternating back and forth by 45 degrees from centre. Using 03’s (blue), we observed improved uniformity, but still saw misses and suspected we were still using too much water. When leaves are drenched they get heavy, causing them to hang lower and obscure the other parts of the plant. This is the contradiction that limits a strictly hydraulic system: Pressure motivates droplet movement, so you need slightly larger drops and more volume. However, too much water causes run-off and weighs leaves down, obscuring the rest of the canopy. Catch 22.
I proposed getting a set of 02 (yellow) tips in the hopes there would still be enough spray for better uniformity. I hope they tried it.
A few beefs about the M2
There’s always room for improvement. Before you think I’m selling these sprayers, here are a few observations from the owners and from what we saw that day. No deal breakers, just some nice-to-haves:
The diesel exhaust from both the sprayer and the tender cart is not ideal. Applicators wear respirators, and the greenhouse fans tend to dilute the exhaust, but a battery system (perhaps like a drone) would be preferable to power the drive electrically.
There was a latency with the self-leveling wheels and with air build-up in the tower portion of the sprayer. You simply need to be patient before you start down a row.
The tower section gets hot to the touch, likely because of the position of the exhaust pipe.
The alternator on board recharges the battery, but if you let it sit the battery is depleted (sounds like the same trouble I had with my sprayer, which is somehow gratifying).
I’m sure you’re asking “How much?”
Well, at the time of writing, it was almost $70,000.00 CDN, but don’t judge it too harshly! Bear in mind that our assessment saw a reduction of 20% water and crop protection product that would otherwise have ended up on the greenhouse floor. Not only is that a big savings in water and inputs, but it’s fewer refills and it produced far better spray coverage that a hydraulic system. While improved coverage is not always linked to improved efficacy, they certainly go hand in hand. And when we’re considering “softer”, biorational greenhouse chemistries, improved coverage is the best bet we have for pest control.
All in all, this was an excellent sprayer that I hope is the first of many to grace Ontario’s greenhouses.
Thanks to Great Lakes Greenhouses for the invitation, and thanks to all the other grower cooperators (names withheld to protect the innocent) that took a risk on building budget, niche sprayers with me. Sometimes, you just have to throw money at it.
Targeted spraying is a technology that enables the site-specific application of plant protection products and liquid fertilizers based on sensor readings. Some of the latest machines incorporate computer vision and processing capabilities that can distinguish between different types of weeds and crops based on multiple adjustable criteria.
The Swiss-made ARA Sprayer by Ecorobotix, has recently generated significant interest among Ontario growers. This article provides a technical overview of the machine, including a detailed explanation of its main features and capabilities.
The Sprayer
The sprayer is a two-component system, mounted directly onto the front and back of a tractor. The front unit consists of two separate tanks: one dedicated to the chemical solution and the other to fresh water, which can be used for rinsing or refilling the chemical mixture tank. The front component also includes the pump and processing unit (Figure 1).
Figure 1- Front-mounted unit.
The boom section is mounted via three-point hitch to the rear of the tractor (Figure 2). The shrouded boom folds for transport and storage and features 156 individually controlled nozzles (Figure 3).
Figure 2- Rear unit deployed.Figure 3- Closeup of the boom.
The unit can be controlled and monitored from a tablet or smartphone connected through the machines’ own Wi-Fi. External data connection through internet is only required for occasional maintenance and updates but not for regular field operations. Regardless of the complexity embedded in the smart operating system, the interface is intuitive and easy to manage. Most of the parameters are automatically optimized by the software (Figure 4).
Figure 4- Tablet interface.
Capabilities
Since the intelligent vision system acts as the central controller for each individual nozzle, it enables a wide range of operating modes and potential applications. Depending on user needs, the system can process information and respond in various ways. The following list outlines the currently available and tested features, which may be expanded in the future.
Banded Spraying
In this mode, parallel bands of variable width are sprayed, which might include or exclude the crop (Figure 5), depending on the objective. The lines are defined based on AI detecting a planting pattern, which will lead to the automatic definition of the spraying swaths.
Figure 5- Banded application options: in-row or inter-row.
Size-Exclusive Spraying
This option allows targeting the spray based on the plant size. It can either be used to:
Detect and spray weeds larger than a small emerging crop.
Detect smaller emerging weeds in an advanced-stage crop. Weeds similar in size or larger than the crop will be missed in this case. (see figure 6 – left).
Spray only the crop with fertilizers or pesticides when no-specific algorithm has been developed to differentiate it from the weeds. The crop must be significantly larger or smaller than the weeds for this mode to work efficiently. (see figure 6 – right)
Figure 6- Only plants smaller (left) or larger (right) than a specified target are sprayed.
Green on Brown Spraying
The machine will spray all detected green material (Figure 7). This is particularly useful for improving chemical use efficiency in stale seedbed and insecticide applications. It also offers an interesting option to reduce the risk of herbicide carryover in pre-plant, post-weed-emergence control, especially when weed cover is low and the product may persist in the soil long enough to affect the crop.
Figure 7- Green on brown spray.
Green on Green Spraying (Six Scenarios)
The vision system and processing capabilities can identify the crop, distinguish it from weeds, and selectively target either, regardless of plant size. Additionally, a variable safety buffer can be defined to determine how close a spray can be applied to the nearest crop leaf. If this feature is inactive, any overlapping weeds will be sprayed, even if the herbicide contacts the crop. If active, the sprayer will avoid targeting weeds that are closer than the defined safety buffer distance, which can be set up to 16 cm (6.3”).
The parameters can be configured to cover six difference scenarios:
1. Selective herbicides when no safety buffer is required
All weeds will be sprayed, regardless of their proximity to the crop. If they’re very close, the crop might receive part of the spray (Figure 8). This mode is suitable for selective herbicide applications.
Figure 8- Herbicide application with zero safety buffer.
2. Non-selective herbicides when the contact with crop canopy should be minimized
In this case, depending on the potential damage caused by the chemical contacting the crop, a variable buffer can be programmed. Only weeds that can be sprayed while maintaining the defined buffer distance from the crop will be targeted (Figure 9). Inevitably, weeds in very close proximity or overlapping with the crop will be missed.
Figure 9- Weed target spray with a safety buffer.
3. Crop-targeted spray
The machine will detect the crop and will not spray anything else (Figure 10). This can be useful for insecticide or foliar fertilizer applications.
Figure 10- Crop-targeted spray.
4. Application of weed pre-emergence herbicides post-crop-emergence
In this case the entire surface, except the crop canopy is sprayed (Figure 11). It can be utilized to spray herbicides with soil residual activity post crop emergence.
Figure 11- Pre-emergent herbicide application excluding the crop/
5. Monocots vs dicots weeds differentiation
This mode is limited only to onion fields for now. It can be configured to spray only monocots weeds (grasses, sedges) or only dicots weeds (broadleaf). This can be useful to increase the efficiency of post-emergence broadleaf or grass selective herbicide applications.
6. Specific weeds targeted
In this mode only the target weeds will be sprayed. As of now, it’s only available for thistles, docks, and common ragwort. It can be used when a specific herbicide is used to target hard-to-control species.
Speed and Accuracy
For all applications, the company claims to have a spray accuracy of 6 cm by 6 cm (2.4”x2.4”). The speed of operation will be dependent on the weed size. The larger the weed size, the lower the recommended speed to allow for an optimal spray coverage of the weeds, increasing the treatment efficacy. The speed operating range is 0 to 7.2 km/h (0-4.5 mph).
Weed coverage or density does not affect the maximum recommended speed, as the machine can process images at such high rates that it is capable of scanning and spraying 100% of the area when moving at full speed. In other words, the processing unit does not need to slow down to detect, differentiate, and target weeds, even when they are present at very high densities.
Ecorobotix claims the machine can cover 2.8-3.2 ha (7-8 acres) per hour under typical conditions and can run 24/7 independent of light conditions.
Crop Portfolio
As of August 2025, the company has developed the following algorithms for specific crop recognition:
Vegetable Crops:
onion
carrot
lettuce
endive/chicory
beans
spinach
broccoli (beta)
cauliflower (beta)
leek (beta)
other cabbages (beta)
potatoes
sweet corn
Field Crops:
sugar beet
rapeseed (canola)
corn
soy (beta)
cotton (beta)
wheat (beta).
For the crops not listed, the equipment can still be used but not with the features that required crop identification for targeted sprays.
Technical Specifications
Minimum weed size required for weed detection: 4 x 4 mm.
Maximum plant height: 40 cm.
Minimum crop size for proper identification: at least two true leaves.
Minimum tractor power: 90 HP
PTO: 540 RPM, 4 HP (3 kW) max
Three-point hitch: cat 2 front and back.
Weight:
Front unit: 705 lb or 320 kg (empty), 2,645 lb or 1,202 kg (full)
Rear unit: 2,257 lb or 1025 kg
Dimensions (Figure 12):
Front unit: 5’7” x 4’7” x 5’7” (W x D x H)
Rear unit: 21’4” x 8’10” x 4’3” (W x D x H)
Figure 12- Dimensions.
Cost of Purchase and Operation
At the time of writing, the purchase cost for a complete unit is around $300,000 USD, depending on the algorithms purchased and shipping fees. In the following years, there is an annual fee associated with the operating system maintenance and development. The basic subscription includes algorithms for three crops, as well as access to all beta-stage models currently in development. Additional crop algorithms can be purchased. For accurate pricing, contact their Canadian partner, Univerco.
According to the manufacturer, the equipment does not require regular replacement of expensive components beyond standard sprayer preventative maintenance. While some components are standard and readily available, the company also keeps a regular stock of specialized parts at its warehouse in Pasco, WA, available for immediate shipping. Comprehensive service and maintenance support is provided locally by Univerco.
Testimonial
Wendy Zhang is the head agronomist for Keejay farms. She oversees more than 5,000 acres of diverse vegetable crops, predominantly carrot and onions. In her own words, the machine is “easy to operate, very accurate, and fast enough for a large-scale farm.” She also highlighted substantial savings on chemicals and the significant advantage of being able to safely spray close to the crop using products that cannot be broadcasted due to the risk of unacceptable crop damage.
The most important benefit, she says, is the ability to apply treatments very close to the crop canopy, using effective rates and chemistry without compromising crop safety. No other practical tool offers this capability. A clear demonstration of its effectiveness is that no other spray equipment is currently being used for their large onion operation.
The Grower Magazine published an excellent article about this machine, featuring other grower testimonials.
Thanks to Olivia Soares de Camargo, Business Development Manager at Ecorobotix, for providing much of the information used in this article.