Site-specific treatments have long been a goal in agriculture. It makes sense to provide inputs or treatments at rates that reflect the local situation. And to a large degree, those capabilities have been available for fertility and seed inputs for some time, with input zones reflecting soil types or topography.
But the sprayer world has not seen as much site-specific treatment. One reason is that pest maps are time-consuming to generate and their usefulness may be short-lived. Or perhaps weeds are fairly ubiquitous, and it usually makes sense to treat an entire field. Another reason could be that sprays are relatively inexpensive compared to fertilizer or seed.
For spraying, we need to re-define site-specific.
While traditional zone maps (corresponding to, say soil type and/or elevation or slope position) allow unique treatments on a scale of acres, new sensors have allowed sprayers to basically leapfrog this approach and treat each square foot uniquely. These sensors identify plants directly and create an immediate treatment response.
The idea, and technology, has and been around agriculture since the early 1990s, with the Concord DetectSpray and later the Trimble WeedSeeker. For various reasons, these two never became widespread in North America, although a significant market formed in Australia and New Zealand. New cutting edge technologies are about to change this.
Green on Brown
Two main manufacturers have occupied the traditional Green on Brown Optical Spot Spraying (OSS) space, the Trimble WeedSeeker and WEEDit. Both have been available for over 10 years and are well established and proven reliable. WeedSeeker uses the Normalized Difference Vegetation Index (NDVI) principle to detect green on a non-green background. It employs one sensor per nozzle and the nozzle is either on-or off based on what the sensor detects. The WEEDit system is manufactured in the Netherlands by Rometron (https://www.weed-it.com/), and is widely adopted for use in Australia and South America. It is now making inroads into North America. The most recent version is named Quadro.
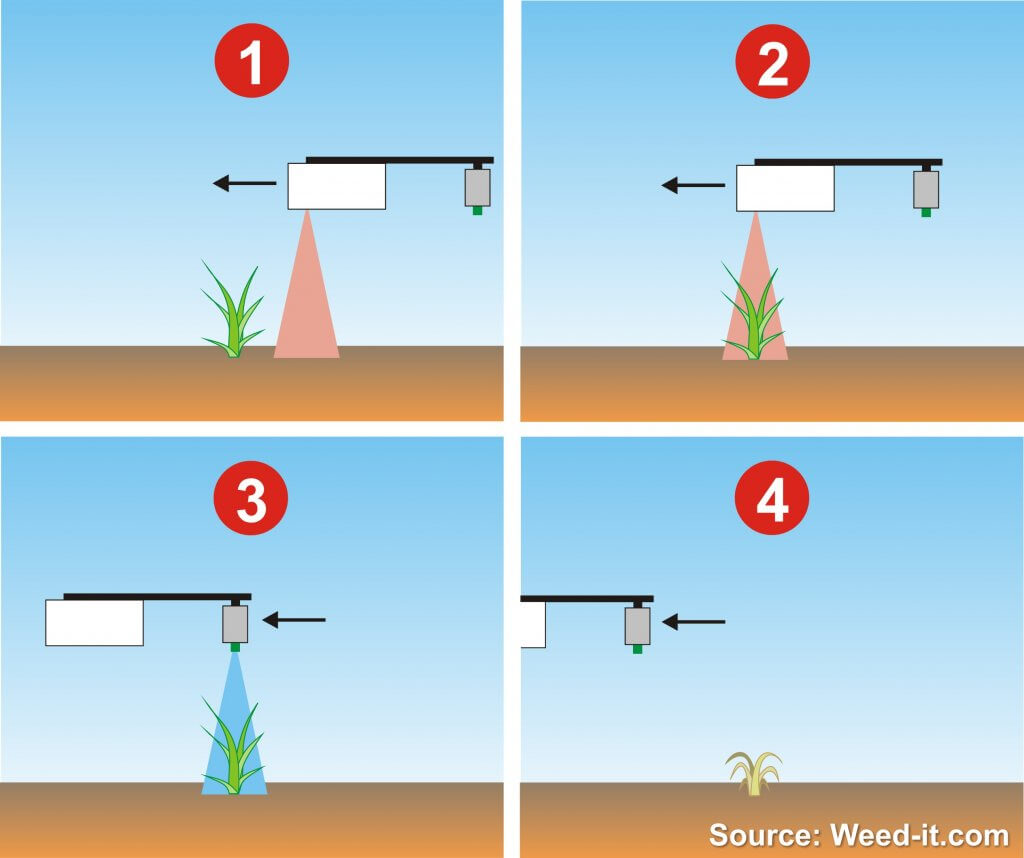
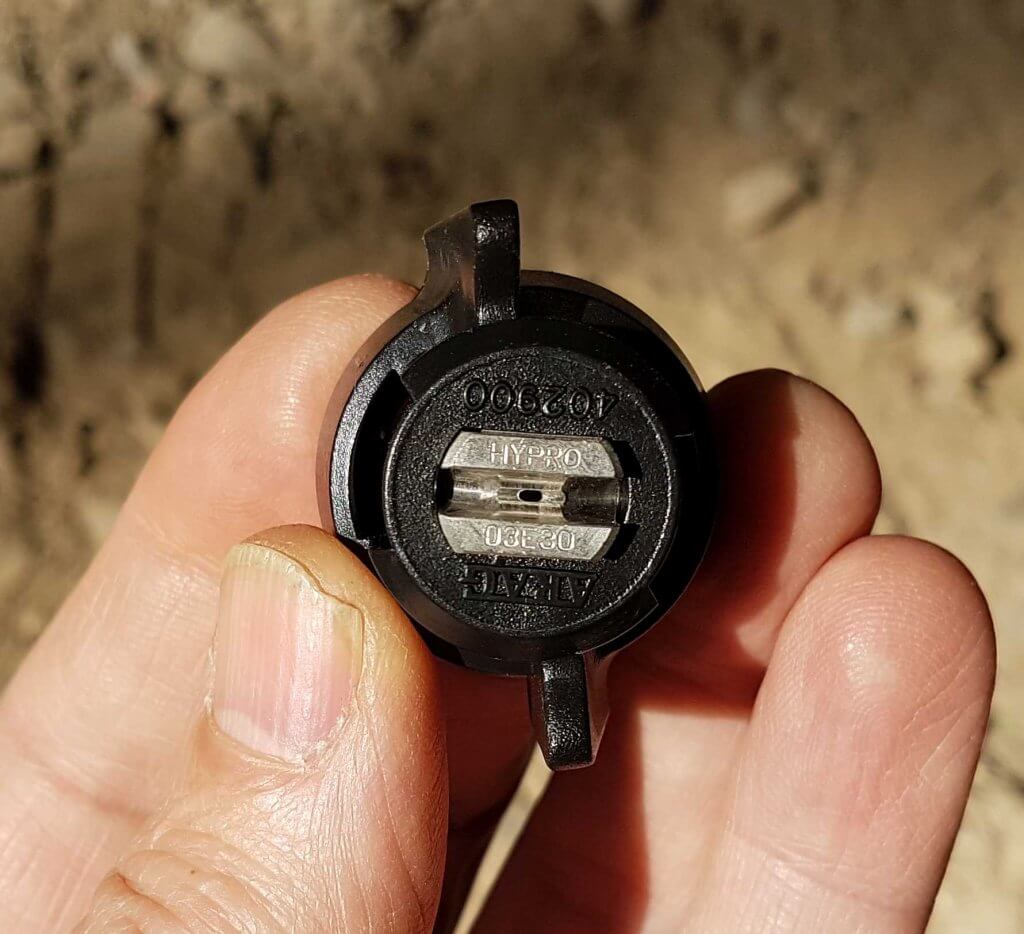
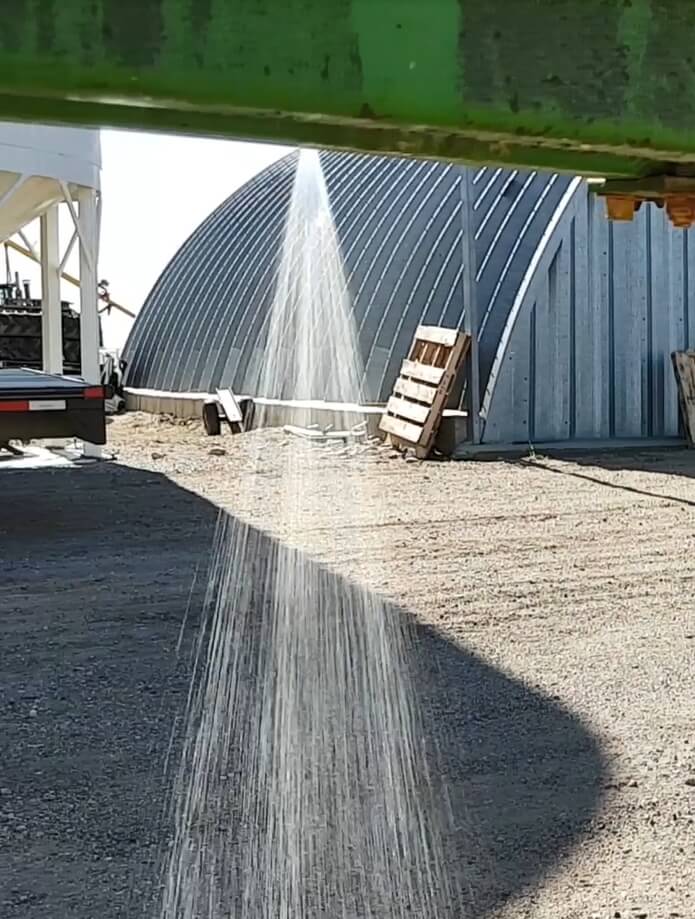
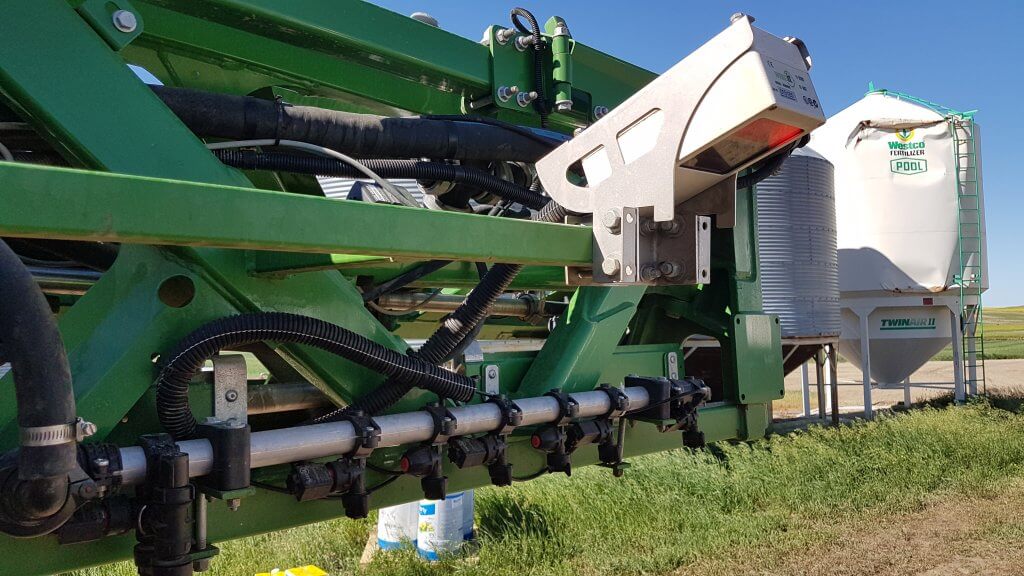
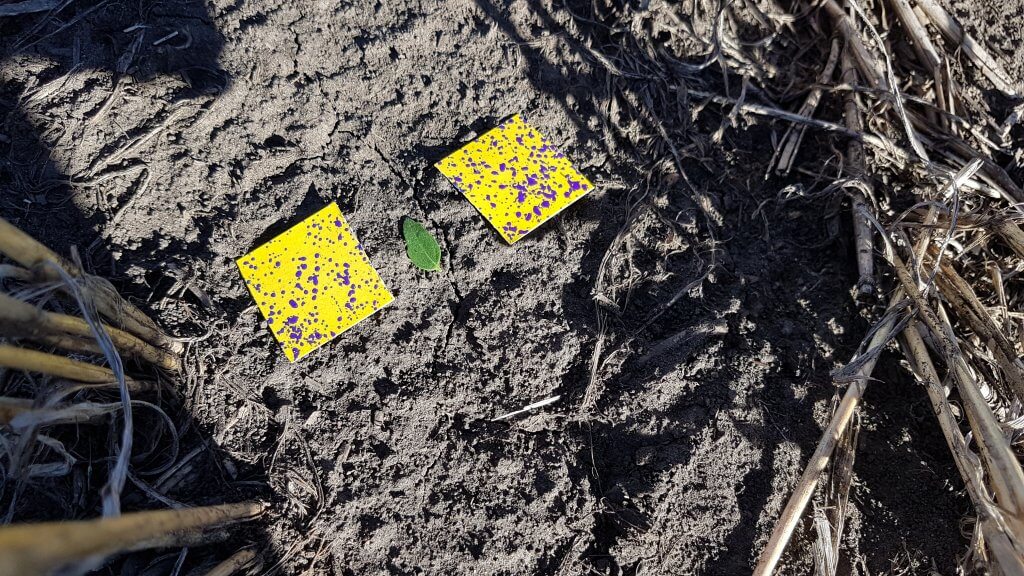
WEEDit spray booms contain sensors placed at 1 m intervals. These scan the ground ahead of the boom, identify the presence of plants, and trigger the nozzle in line with the plant. The newest Quadro sensor contains four channels so that its resolution is actually 25 cm (10″) wide. The boom therefore contains a nozzle every 25 cm, and this nozzle has a correspondingly narrow fan angle that treats just this space.
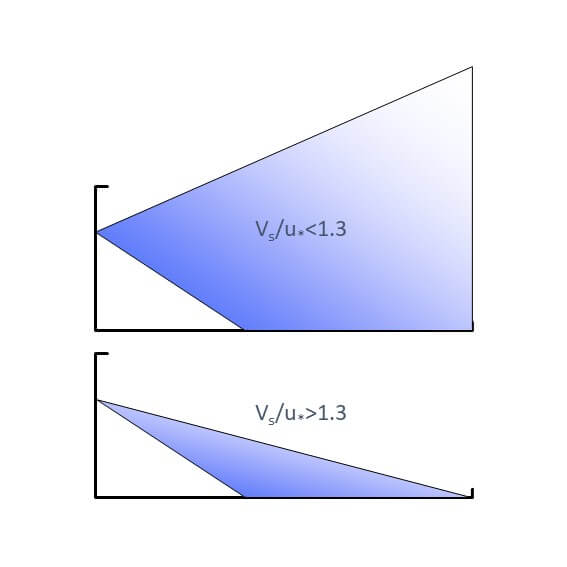
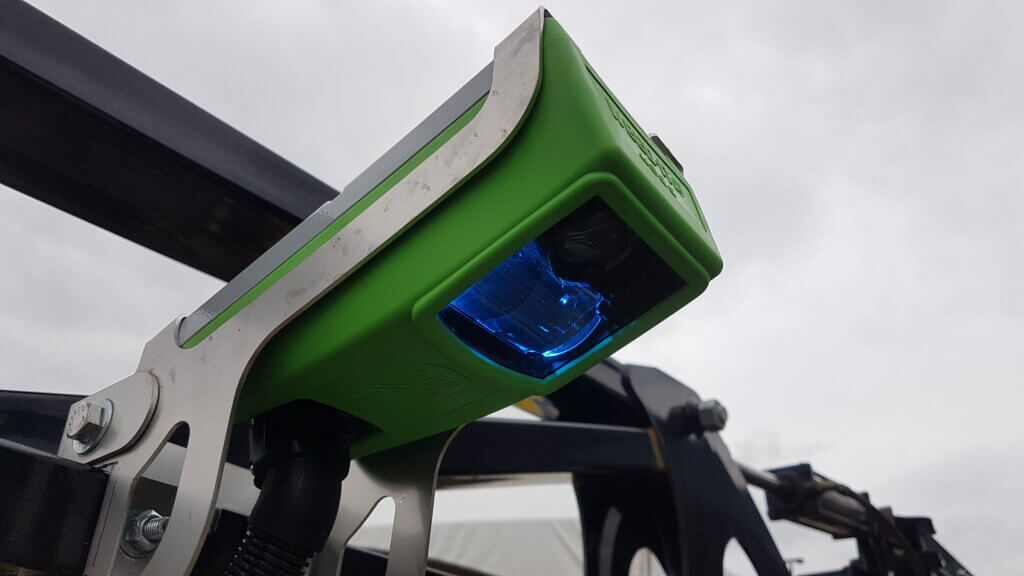
The detection principle is based on the quality of light that is reflected from living plant tissue compared to everything else. A red (older generation) or blue (newest generation, Quadro) light is emitted, and chlorophyll-containing plants reflect a unique wavelength that differentiates them from ground or dead plant material.
The response time of the system is very fast. Triggered by small solenoids, a sprayer travel speed of up to 15 mph is possible when the sensor looks 1 m ahead. Furthermore, the software allows the user two important controls: first, the sprayed distance before and after a detected plant can be buffered between 5 and 20 cm, resulting in a sprayed patch between 10 and 40 cm long. This could be useful when boom heights fluctuate and placement of the sprayed patch shifts accordingly. Second, the user can select from among four sensitivity settings. Higher sensitivity can detect smaller weeds but will also result in more false results.
One reason the system has been successful in the southern hemisphere is the long growing season that may require multiple spray passes outside of the crop each year, and in which the weeds are relatively large at treatment time and therefore easier to detect.
In North America, the pre-seed spray window is relatively narrow and weeds may be very small or just be emerging. The risk of a miss due to non-detection is therefore greater. Fortunately, the WEEDit system has a feature that addresses this risk.
The solenoids that trigger an individual nozzle are pulse-width modulated (PWM). This means that the application rate is adjusted according to travel speed via a duty cycle. And it offers an innovative capability: The entire boom can be programmed to spray a defined fraction of the full dose, to a maximum of 50%, as a background broadcast rate (called “Dual Mode” or “Bias”). The smallest weeds that escape detection are likely to be susceptible to this lower dose. Larger weeds are then detected and sprayed with an individual spot spray at the full dose. Dual Mode is typically set to about 25%; overall savings are less, but control is improved for those very early season situations.
A WEEDit Quadro boom can also be operated in “Cover Mode” for broadcast spraying where it functions as a full PWM system with turn compensation.
Currently, several hundred WEEDit sprayers are operating in Australia, and they’ve been available in Canada and the US since 2017. in 2019, Croplands, an Australian sprayer manufacturer owned by Nufarm, started representing WEEDit in Canada. It is available as a retrofit on existing booms, and can be ordered with a WEEDit Millennium aluminum boom that contains mounting brackets and wiring harness channels. Savings compared to broadcast spraying range from 65 to 85%.
In early 2021, John Deere announced its entry into the Green on Brown space with See & Spray Select™. This system is built around the ExactApply nozzle body and uses RGB cameras to differentiate green plants from non-green background colours. It will be in fields in 2022 according to John Deere. Similar RGB-based systems are in development by other manufacturers. Although their performance has not been compared side by side with WEEDit or WeedSeeker, initial specs suggest that the RGB systems are slower and are less able to detect small plants. Nonetheless, the future looks very promising.
In 2021, Hardi Australia announced a new product, called GeoSelect. This system does not have boom-mounted sensors, and instead sprays according to a prescription map developed by a drone. The advantage of this system is that the amount of herbicide needed is known in advance of spraying, and the knowledge of weed distribution in the field can allow for a more efficient coverage plan to be used. This system allows for spraying under any light condition, and adjusts for boom sway to ensure accurate placement. Drone map development is the responsibility of the applicator.
Green on Green
Green on Green spraying, which detects weeds within a crop and differentiates them from that crop, is advancing and the earliest commercial releases are now available in Australia, offered by a partnership between Bilberry and Agrifac (WeedSmart podcast here), as well as Bilberry and Goldacres with Swarmfarm. Others, notably the SmartSprayer from Amazone in partnership with Xarvio and Bosch and Greeneye Technology are entering field testing with commercial sized units in 2021 and 2022, respectively.
Opportunities for Optical Spot Spraying
Taken as a whole, optical spot spraying offers a number of opportunities for weed management.
Cost Savings: OSS has an appealing rate of return on investment. On a 5000 acre farm, a pre-seed treatment of glyphosate plus tank mix for resistance management may cost $10/acre, or $50,000 per year. At an average savings of 75%, that represents $37,500 per year. Add other non-crop uses, such as post-harvest, and savings increase. With eventual weed recognition in-crop, virtually all herbicide treatments are candidates for such savings.
Herbicide Resistance Management: Delaying the onset of herbicide resistance requires the use of multiple effective modes of action in a tank mix. Cost is a deterrent to this practice. With OSS, these tank mixes become affordable.
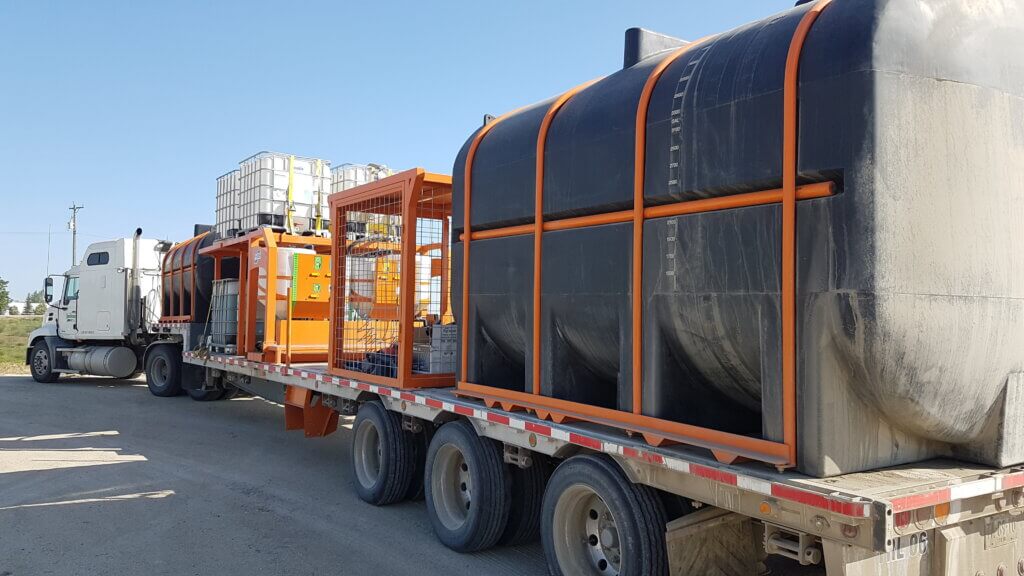
Efficiency: With 75% product savings, a tank of product will last longer. The time lost to hauling water and product, as well as filling the sprayer, will decrease. For example, WEEDit users are spraying a full day on a single load. Or they may choose to use a much smaller load, decreasing equipment weight.
Pre- and Post-Harvest: Whether for desiccation or weed control, site-specificity of late season sprays can also be based on living tissue. Only regions in the field requiring the desiccant are treated. Perennial or late-season weeds are selectively controlled pre-harvest. Since herbicide rates in these applications are typically higher, savings are significant.
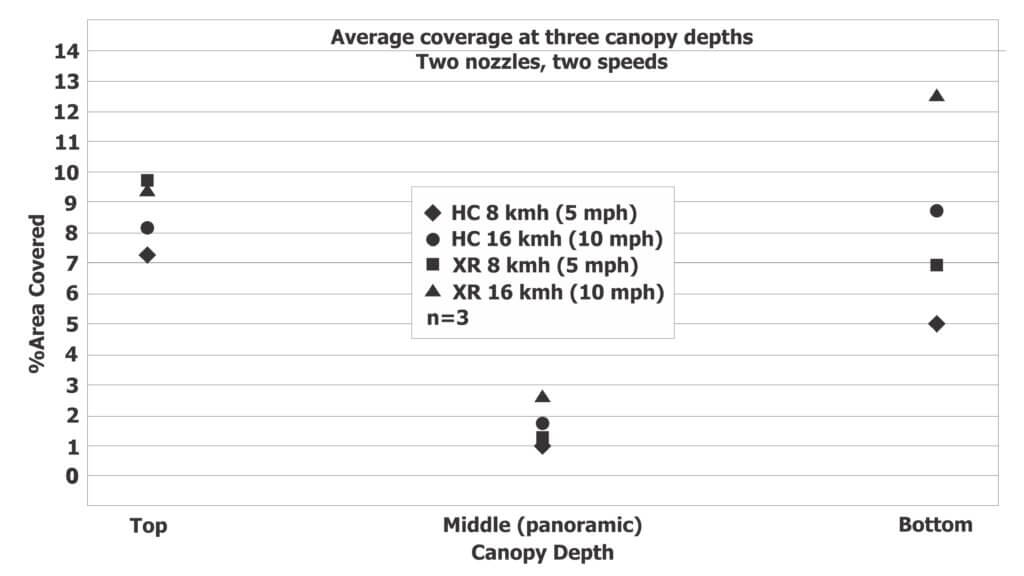
High value crops: Row crops requiring multiple fungicide applications per season, such as potatoes, can benefit from OSS. Sprays applied prior to canopy closure can thus avoid gaps between plants, saving product.
Producer Innovation: One user of the WEEDit system in Saskatchewan developed an innovative use. Having missed a pre-seed spray, the applicator was faced with large weeds in a 1-leaf RoundupReady canola crop. By turning down the sensitivity of the system so the canola crop did not trigger the sensors and turning on Dual Mode, he was able to broadcast spray the field at a low glyphosate dose (sufficient to control the small weeds) and then apply a full dose to the larger weeds, triggered by the sensor.
Equipment Innovation: Since individual zones or weeds require unique doses or products, technologies like direct injection, remote nozzle switching, multiple smaller tanks and booms, and PWM will make more sense and grow. But the whole concept of detection and treatment can be moved away from pesticides to mechanical control or other techniques such as lasers, as does Carbon Robotics.
License to Farm: OSS makes intuitive sense not only to applicators, but also to the public at large. Showing and using these technologies demonstrates stewardship practices that are easy to communicate and understand.
Artificial Intelligence Scouting
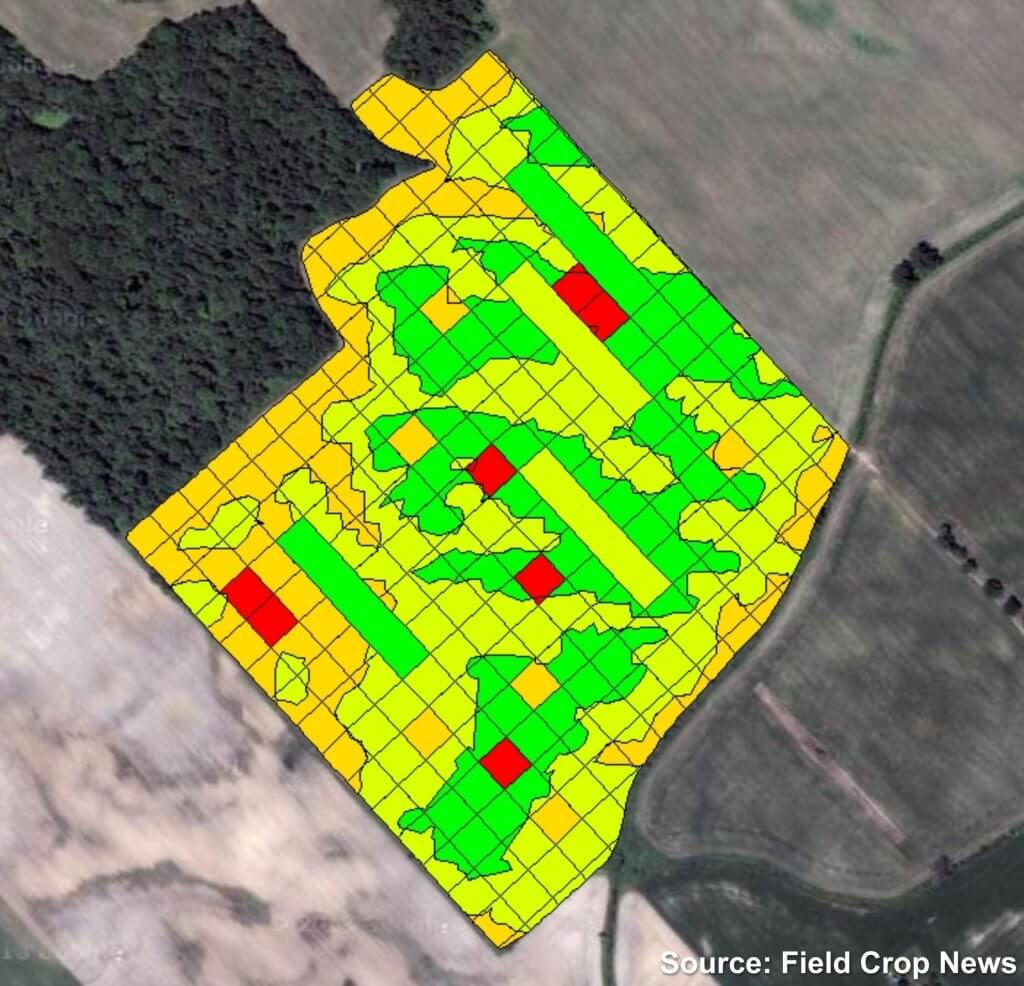
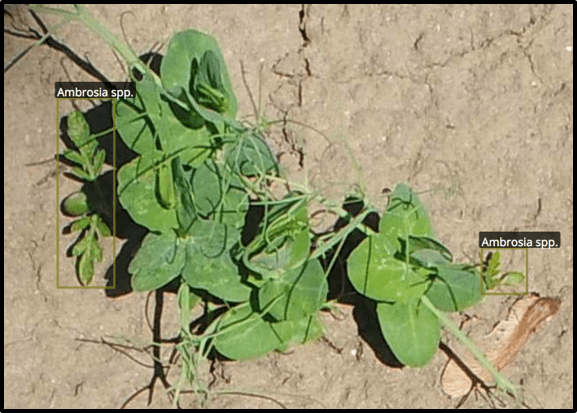
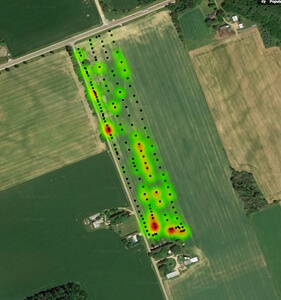
Another approach is pioneered by several companies, for example Dronewerkers in the Netherlands (https://www.dronewerkers.nl/english/) Taranis (http://www.taranis.ag/), and Xarvio (https://www.xarvio.com). These companies have developed plant recognition algorithms that are currently able to identify over 100 different species. Each species can be divided into several growth stages. Taranis has launched a business in North America that scouts fields by high-resolution drone imagery, and then provides customers with maps that highlight potential agronomic issues such as weeds, disease, or insect damage.
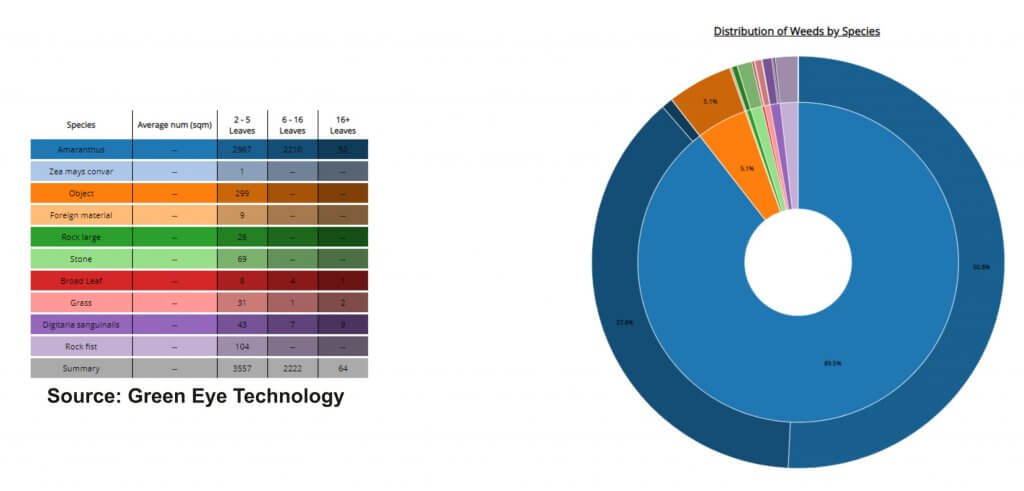
Resolution of the output can be species-specific (lambsquarters vs redroot pigweed), or by coarser resolution (broadleaf vs grass). The resulting output then shows the plant density at each location.
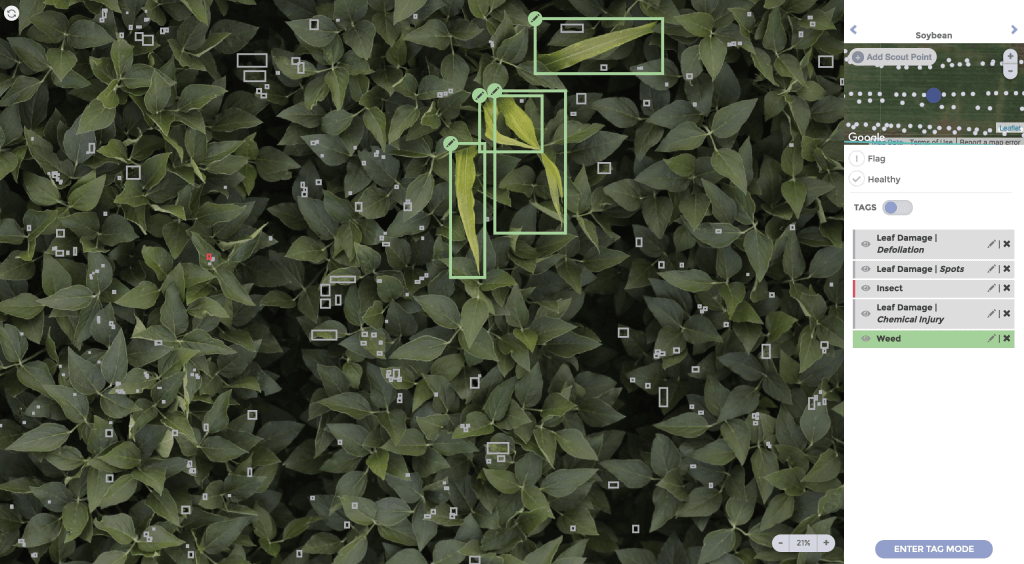
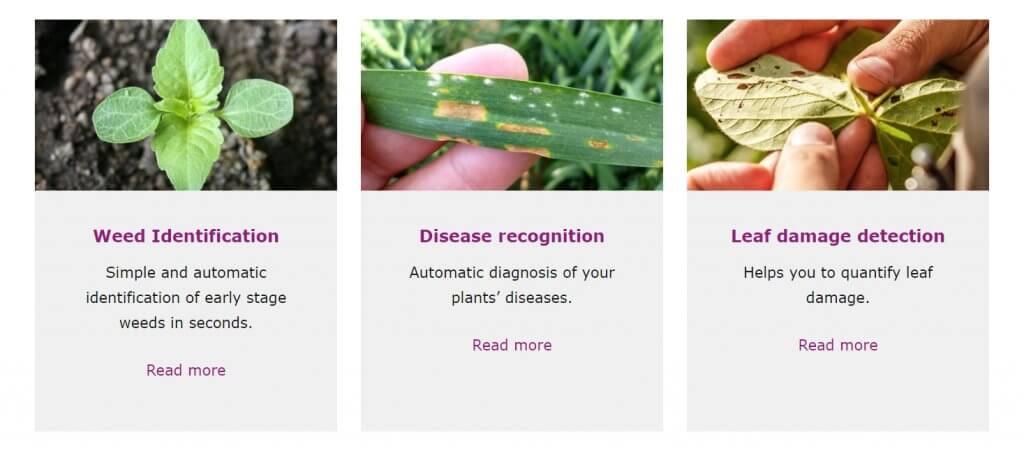
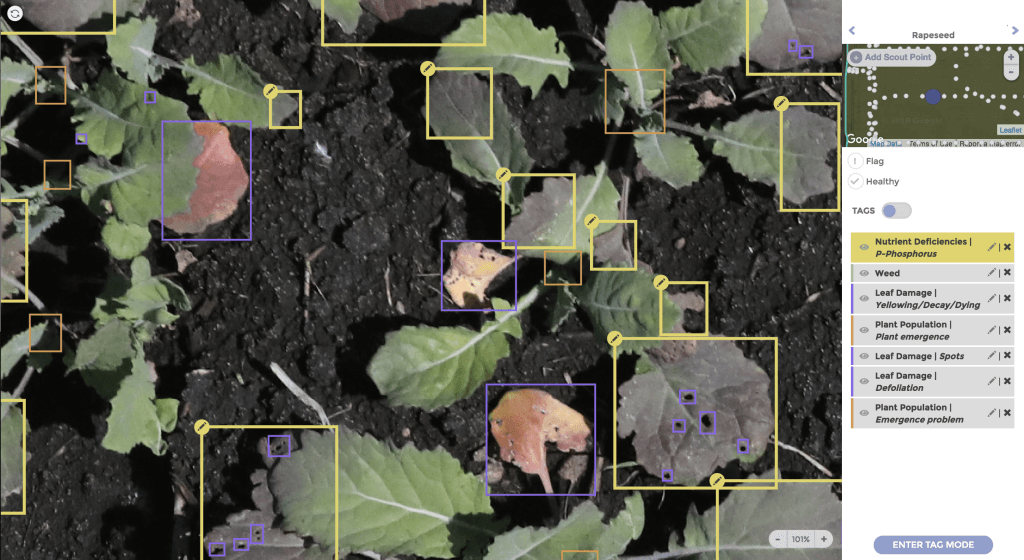
Xarvio Scouting is a product in their Field Manager line (https://www.xarvio.com/en-CA/Scouting). App-based, the agronomist or producer takes pictures of their crops and the app is able to recognize weeds, diseases, insect feeding damage, as well as nitrogen status. The app is aware of other users in the area and basically crowd-sources emerging agronomic issues as they arise, communicating them back to the user.
The agronomic value of this information is clearly very high. Imagine knowing the distribution of weeds by species before and after treatment. Although we can already assess this when we walk fields, by conducting the task via drone we are measuring on a wide scale, permitting an accurate quantification of the treatment effect so its value can be assessed. This level of measurement intensity was not possible before. Yield loss models for time of removal of certain weeds at certain growth stages can be applied across the entire field, and economic analyses allows follow-up treatments to be tailored to specific portions of the field.
Or imagine following specific patches of weeds over time, to monitor the effectiveness of a certain cultural practice, or be alerted to the establishment of a resistant population while it’s still feasible to contain it.
When this information is converted to a prescription map, rate and tank mix composition (or cultural controls) could be varied as necessary by zone, or weeds could, in the future, be sprayed individually. Perhaps future autonomous robots could be deployed more efficiently.
Development and improvement of these technologies is ongoing rapidly. Finally, we may have all the pieces that can bring site specific weed, disease, and insect management to market.