Sprayer math can be intimidating, but the effort gives solid value. When combined with a calibrated sprayer you reap the following benefits:
- Estimate how long a job will take.
- Estimate how much spray mix is required.
- Estimate how much crop protection product must be ordered for the season.
- Populate spray records which allow you to review practices, respond to enquiries and satisfy traceability requirements.
There are many ways to perform sprayer math, and you need only look to local pesticide safety courses, industrial catalogues, and extension resource centres for examples. If you’re already comfortable with your current method, don’t mix and match with others. Sprayer math is a series of related calculations that employ constants to keep the units straight. It’s all or none.
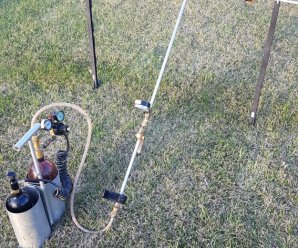
Walkthrough
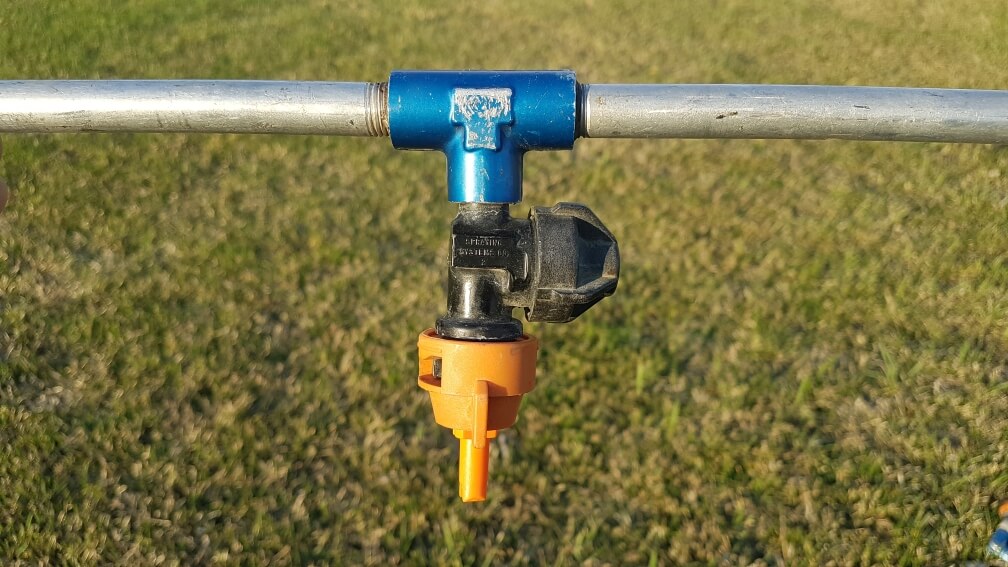
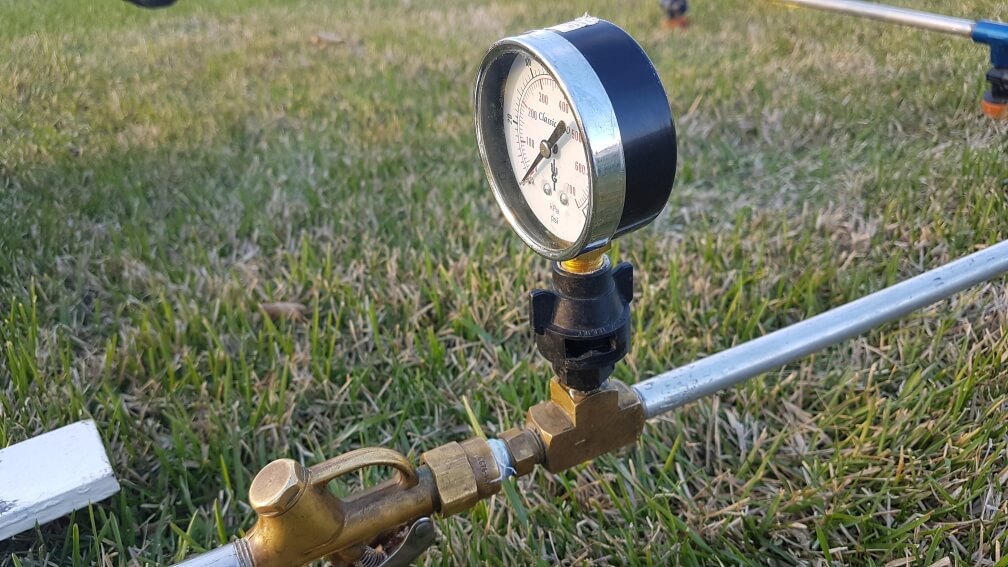
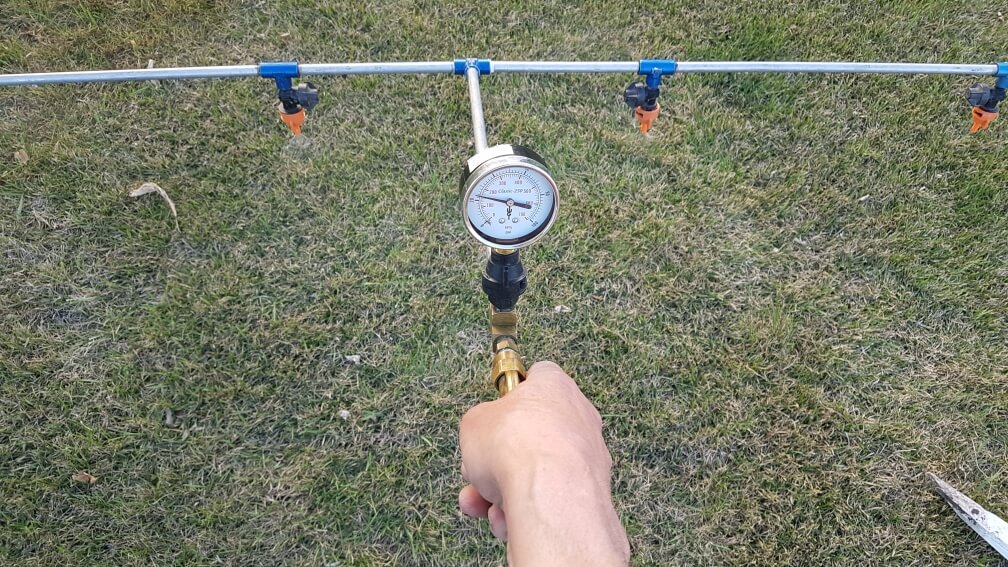
Let’s start with the classic, US Imperial formula for calculating the required nozzle output. In other words, you want to know which nozzle size you need to get the volume-per-planted area you’re aiming for. This is the bread-and-butter formula that seems to be needed most often, so that’s why we list it first.
In order to determine nozzle size (gallons per minute), you’ll need to know your target volume (gallons per acre), your average travel speed (miles per hour) and your nozzle spacing (in inches). The number “5,940” is a constant that handles all the unit conversions. It is what it is.
GPM = [GPA x MPH x W] ÷ 5,940
Of course, this formula can be adjusted to allow you to solve for any factor, as long as you’re only missing one piece of information. Algebra is all about solving for X, or in other words, determining some unknown variable. I know, it’s been a long time since you learned this in school and it doesn’t come easily to most. I propose brushing up on the basics using a series of three great YouTube videos from “Mathantics“
As we noted earlier, you can do a lot more with sprayer math than just pick the ideal nozzle. But before we continue, a warning: If you live where units are strictly US Imperial, or strictly Metric, then Canada’s odd hybrid “Mock-tric” units can get a little confusing. The rest of this article attempts to be globally-relevant by including examples of both Metric and US Imperial formulae, but watch out for unit conversions. If at any time you don’t see the units you’re looking for, you can consult our exhaustive list of unit conversion tables.
Grab your calculator or favourite smart phone app – it’s math time!

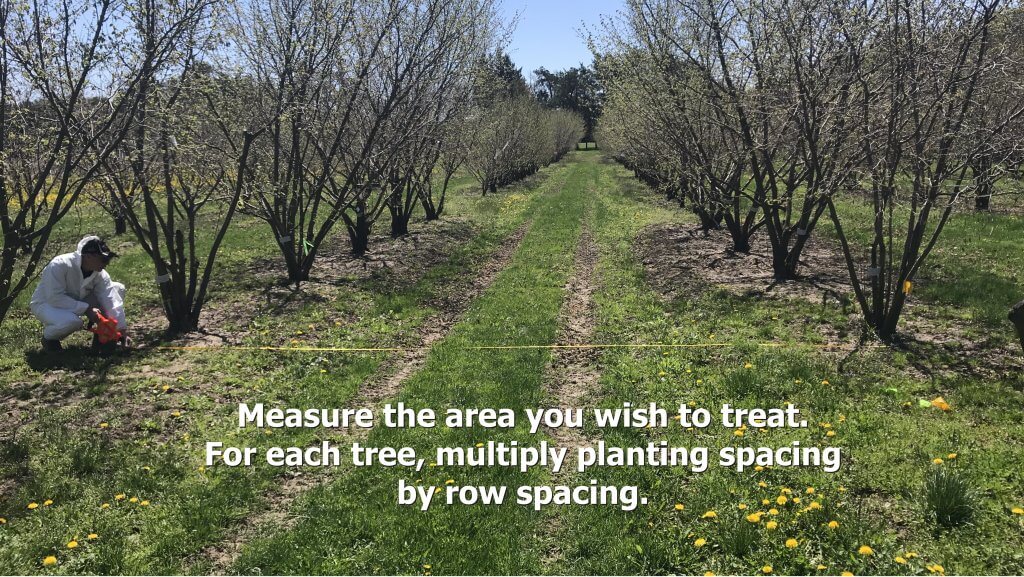
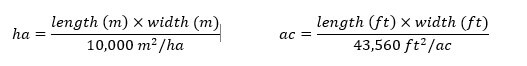
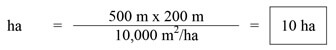
Step 1 – How large is the area you need to spray?
Multiply the length of the area you plan to spray times the width. If you are using metres, then divide the product by 10,000, which is the number of m2 in a hectare (ha). For feet and acres, divide by 43,560 which is the number of ft2 in an acre (ac):
Step 2 – How much product is needed to spray the area?
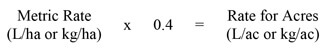
Consult the rate(s) shown on the label. In Canada, rates are often based on planted area (E.g. hectares). In Australia and New Zealand, they may be based on row length (not covered in this article). If you measure your area in acres, you’ll have to convert the rate by multiplying by a constant: 0.4.
Now multiply the area you want to spray (step 1) by the rate (step 2).

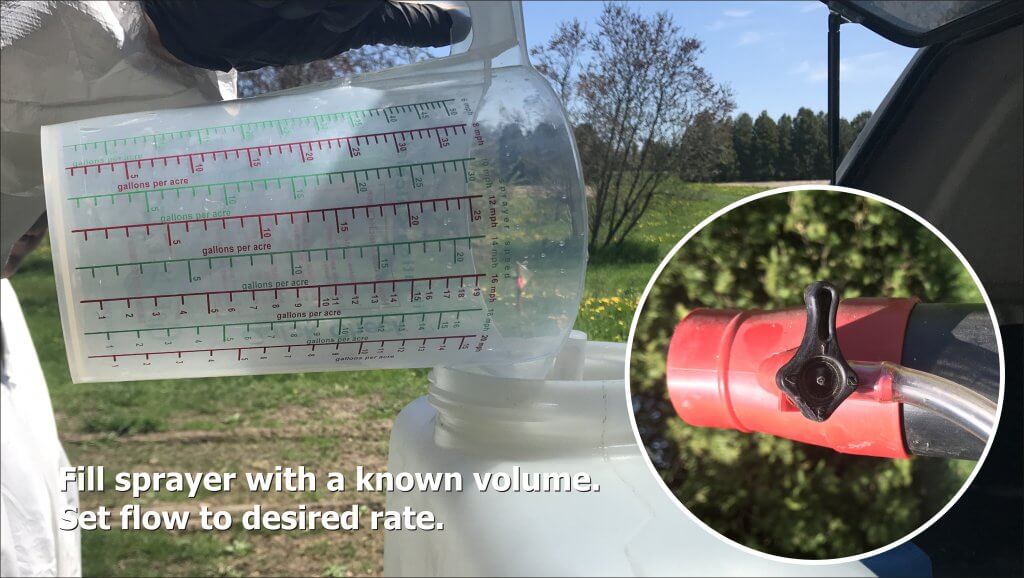
Step 3 – How far can you go on a full tank?
You know your sprayer output (determined through calibration) so you divide that into your tank size. Watch your units:

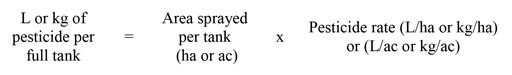
Step 4 – How much pesticide per tank?
Multiply the area that can be sprayed per tank (Step 3) by the pesticide rate (Step 2). Again, watch your units:
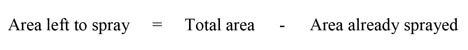
Step 5 – How much area is left to spray?
Just subtract what you’ve already sprayed from the total area.
Step 6 – How much pesticide in the last, partially-full tank?
Multiply the area you have left to spray (Step 5) by the pesticide rate (Step 2). Yes, watch your units:

Step 7 – How much spray mix will I need for the partial tank to finish spraying the total area?
Multiply the area you have left to spray (Step 5) by the sprayer output (determined through calibration). Guess what? Watch your units:

Sample problems
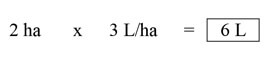
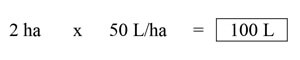
Time to test your knowledge. Let’s suppose you want to apply a product rate of 3 L/ha to your blueberries. You calibrate your sprayer and determine your output to be 50 L/ha. Your tank holds 400 L of spray mix. Your planting is 500 m long and 200 m wide.
Q1 – How large is the area you need to spray?
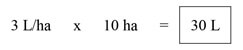
Q2 – How much product is needed to spray the area?
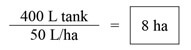
Q3- How much area can be sprayed on one tank?
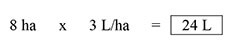
Q4 – How much product should be added to a full tank?
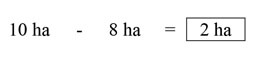
Q5 – After the tank is empty, how much area is left to spray?
Q6 – How much product to add to the last, partially full tank?
Q7 – How much spray mix will be needed to finish spraying?
Exceptions
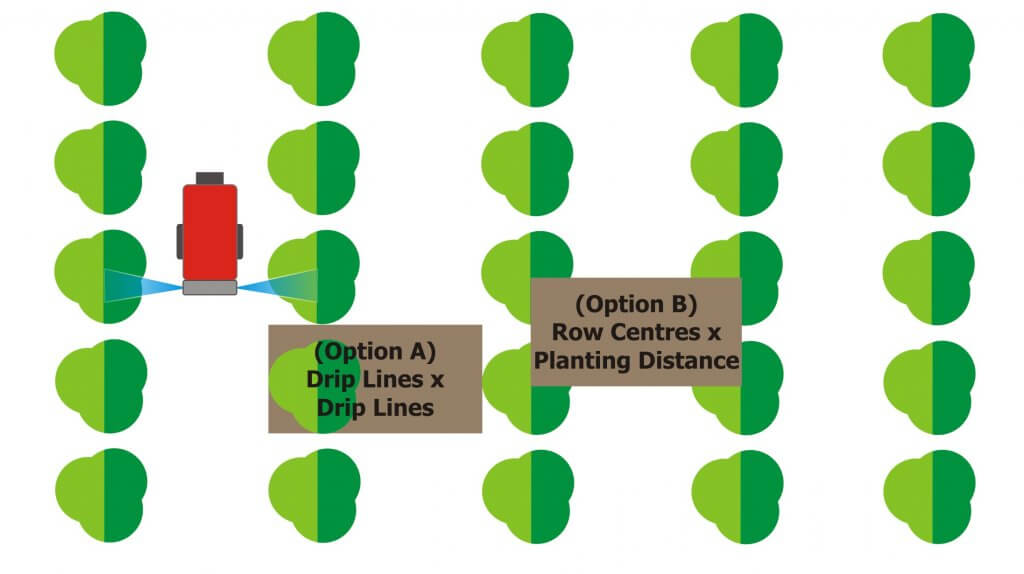
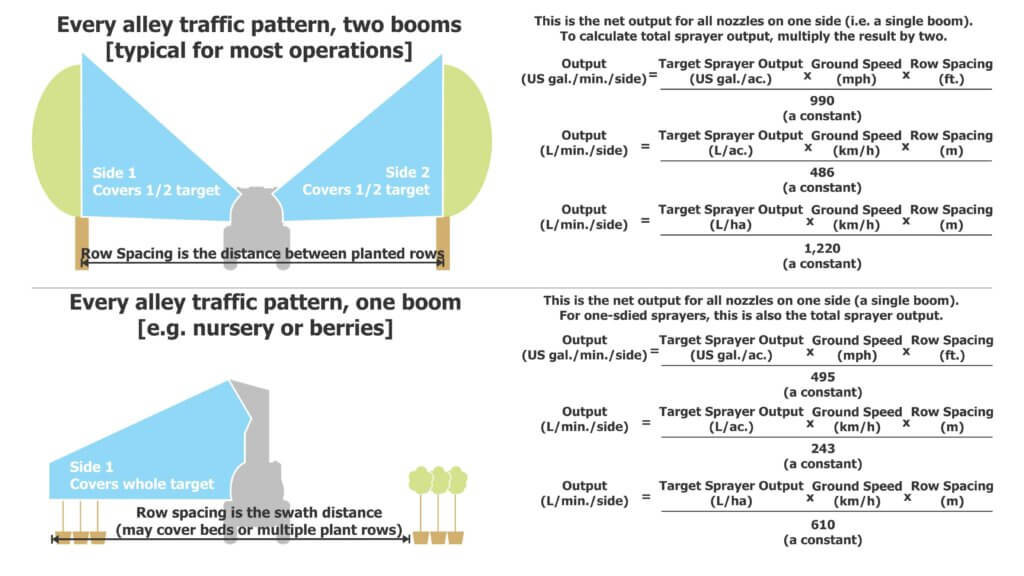
Certain situations aren’t covered in this article. If you are spraying a greenhouse, the math is different. If you are performing a banded application, the math is different. And, if you’re an airblast operator trying to reconcile why a pesticide label uses planted area rather than canopy volume for its rates, you’re in for a lot of additional reading. Some of that latter process can be summed up in this infographic:
When you find a method that works for you, write it down and keep it with your spray records. Happy spraying!