Timing trumps most things in crop protection. A great spray applied at the wrong time isn’t nearly as valuable as a mediocre spray at the right time. So how do we improve our ability to get things done at the right time?
Often, we try to win races by driving faster. In our last article, we looked at driving speed and concluded that faster speeds can lead to more drift and less uniform deposition. Driving slower can be viewed as a sort of insurance policy: You may not notice the benefits right away, but on days when that extra bit of performance is required, you’re covered.
So how do you get the job done quickly if you can’t drive faster? To answer, we have to look to other opportunities for boosting productivity.
Recently, we used our and tried to capture all the elements of a normal spray operation that affect timeliness. These were:
travel speed
boom width
tank size
water volume
field length
number of headlands
turning speed
fill time
First, we identified a reasonable base condition. For the sprayer, that was a travel speed of 14 mph, a 90’ boom, an 800 gal tank, a 10 gpa water volume, and a 20 minute fill time. Then, we set up a typical field situation, which was spraying a half-mile run on a quarter with two sprayed headlands and a turning speed of 8 mph. Finally, we changed one factor at a time to determine its relative importance.
Before we discuss the results, let’s make it clear that just because changing some of these factors improves productivity doesn’t mean we’re recommending them! For example, adequate water volume remains an important input that improves coverage and permits the use of low-drift sprays. Larger tanks increase compaction and take more power, and so forth.
Here’s what we found:
All productivity values were expressed as acres per engine hour. For this reason, our numbers will be lower than what a typical sprayer monitor reports, most of which calculate acres per spraying hour.
For the base condition, the sprayer spent 15% of its driving time turning, and 37% of its on-field time stationary (i.e. filling or cleaning). For every hour spent on the field, less than half the time (48%) was spent spraying. This resulted in an average productivity of 82 acres/h.
Increasing the spray speed to 18 mph increased average productivity to 93 acres/h, but it also increased the proportion of time spent turning and loading, resulting in just 40% of the field time spent spraying.
Decreasing the loading time from 20 to 10 minutes reduced the proportion of field time spent stationary to 23%, covering 100 acres/h at 14 mph. Surprisingly, this was the productivity-winner, resuling in 62% of on-field time spraying.
We discovered other powerful productivity factors, and chief among them was boom width. A 33% increase in boom width from 90’ to 120’ gave a productivity boost to 94 acres/h, close to the same result as increasing the travel speed to 18 mph earlier. Similar side effects occurred: more time turning, and a greater proportion of time filling, as we saw with faster travel speeds.
Boom width seems to have some room for growth. Many smaller European counties use wider booms than we do in North America, for example. With gps guidance and large fields, we have excellent conditions for their implementation.
Two other factors that had similar effects to fill time were water volume and tank size. Less water and larger tanks increased productivity by decreasing the fill frequency, with effects similar in magnitude to speeding up the fill time. Decreasing the water volume from 10 to 5 gpa increased productivity to 100 acres/h by decreasing the proportion of time the sprayer was stopped from 37% to 23%. Increasing from an 800 to a 1,200 gallon tank increased productivity to 94 acres/h, again by decreasing the proportion of time spent filling to 28%.
Taken together, a sprayer with a 120’ boom, a 1,200 gal tank, applying 10 gpa and filling in 10 min had an average productivity of 132 acres/h. And this was achieved without driving faster than 14 mph. If you can string two quarters together and drive a whole mile before turning, that number rises to 145 acres/h, a surprisingly large 13 acres/h gain.
The perspective of minimizing downtime extends to other tasks, too:
Be more prepared for the job by reviewing the product label in advance, noting the correct mixing order.
Keep extra nozzles, clamps, and nozzle bodies in the cab.
Don’t clean plugged nozzles, replace them.
Use low-drift nozzles so a small increase in wind doesn’t shut you down.
Ensure all the products needed are on the tender truck (e.g. pesticide, adjuvant, tank cleaner, anti-foamer, etc.).
Consider switching to 3” plumbing (pump rates of 300 – 400 gpm are possible).
Make sure your inductor won’t be the limiting factor. For example, product pumps can be awfully slow when the product is cold. It might be worthwhile to explore a venturi system.
Speeding up the fill process is a good idea, but be careful with certain products. Dry materials such as the sulfonyl ureas (e.g. Refine, Express SG, etc.) and some fungicides (e.g. Astound, etc.) require time to hydrate in water so they mix properly. Some operators pre-hydrate these in a smaller tank, while others get an extra tank to pre-mix whole loads and simply transfer them over.
Also think about the time spent cleaning the sprayer. Thoroughness is important, but perhaps there are efficiencies to be gained there as well, like never letting a sprayer sit after spraying. We’ve written about continuous rinsing, for example, to improve cleaning speed and effectiveness.
So, the quicker we can spray, while ensuring a quality job, the more effective our crop protection practices will be. We encourage you to use our to determine your best configuration.
Got a productivity tips to share? Let us know! And remember: In spraying, the race is won in the pits.
Factor
Base
Drive Faster
Fill Faster
Spray Wider
Less Water
Bigger Tank
New Sprayer
Travel Speed
14 mph
18 mph
14 mph
14 mph
14 mph
14 mph
14 mph
Fill time
20 min
20 min
10 min
20 min
20 min
20 min
10 min
Boom Width
90 ft
90 ft
90 ft
120 ft
90 ft
90 ft
120 ft
Water Volume
10 gpa
10 gpa
10 gpa
10 gpa
5 gpa
10 gpa
10 gpa
Tank Size
800 gal
800 gal
800 gal
800 gal
800 gal
1200 gal
1200 gal
Field Length
0.5 mile
0.5 mile
0.5 mile
0.5 mile
0.5 mile
0.5 mile
0.5 mile
Time Turning
15%
19%
15%
20%
15%
15%
20%
Time Loading
37%
42%
23%
42%
23%
28%
19%
Time Spraying
48%
39%
62%
38%
62%
57%
61%
Acres/h
82
93
100
94
100
94
132
To work with the productivity calculator, click here.
Airblast sprayer operators must know their average travel speed to calculate how much pesticide and time is required to complete a spray job. Note that it’s an average, not a constant, because travel speed is significantly affected by ground surface conditions (e.g. slippage), grade (e.g. hills) and the weight of the rig (e.g. as spray mix is depleted).
The pursuit of productivity and the unchallenged status quo of traditional spray volumes, blinds many operators to the fact that travel speed is a critical factor in focusing air energy on the target canopy. As long as droplets are small enough to be entrained and directed by the air, we believe that optimizing the fit between air energy and the target canopy leads to the most frugal and effective use of spray mix and should therefore dictate travel speed. If that speed proves to be painfully slow, or terrifyingly fast, then a mismatch is revealed between the sprayer design and the operational conditions and the overall spraying strategy should be reconsidered.
This article describes a method for modelling an ideal travel speed. It can be used as a sanity check for existing operations or for those seeking to evaluate the fit of a new airblast sprayer. However, this method can only approximate travel speed. A true optimization of sprayer settings will require fine tuning using the ribbon method and, ultimately, coverage feedback from water sensitive paper (see here and an older article here). We’ll begin with how to measure average travel speed.
How to measure average travel speed
Beware the tractor speedometer or rate controller that monitors wheel rotations; both can be fooled by changes in wheel size, tire wear or slippage. GPS or radar-based speed sensors are the most accurate method.
Those that prefer a manual method can follow this classic protocol for determining average travel speed:
Go to a row that is representative of the terrain in your planting. Measure out a distance of 50 m (150 ft) and mark the start and finish positions with wire marker flags.
Fill the sprayer tank half full of water.
Select the gear and engine speed in which you intend to spray. If using a pull-behind sprayer, ensure the PTO is running or you could introduce errors.
Bring the sprayer up to speed for a running start and begin timing as the front wheel passes the first flag. This is far easier when there are two people.
Stop the timer as the front wheel passes the second flag.
Stay out of any ruts and run the course two more times.
Determine the average drive time for the three runs (i.e. the sum of all three times in seconds divided by three).
Finally, calculate travel speed using one of the following formulae, depending on preferred units:
Ground Speed (km/h) = Average drive time for 50 m (s) ÷ 13.9 (a constant)
Those that prefer a less accurate but convenient hack can download any smartphone speedometer app that can calculate an average (similar to a runner’s GPS wristwatch). Fill the sprayer tank half full and drive a representative section of your operation with the fan on and the spray off. Consult the phone for your average speed for each pass. Take a screen shot and email it to yourself as a time-stamped component of your spray records.
The “Air Displacements” method
Dwell time
Airblast sprayers use fans to move a volume of air at a certain speed, often measured in m3/hr or ft3/min. Imagine that volume of air as a three dimensional shape extending from the air outlet over a distance. Likewise, imagine the void between the sprayer outlet and the target canopy as a three dimensional shape penetrating roughly halfway into that canopy (assuming we intend to spray every row).
How long must the sprayer dwell in one spot before it pushes all the intervening air out of the way and replaces it with spray-laden air? If the sprayer drives too slowly, it will wastefully push spray through and beyond the target (i.e. blow-through). If the sprayer moves too quickly, the spray will not have an opportunity to penetrate the target canopy and most certainly not reach the highest point. This concept of focusing air energy using travel speed is called Dwell Time.
We want to calculate the volume of air the sprayer generates, compare that to the volume we want displaced, and then determine how fast we must drive to optimize the fit. We can do all this with a tape measure, an anemometer, and a partner to record the data and do a little math.
1. Measure air outlet area
With the sprayer safely off, measure the area of the air outlet(s) on one side of the sprayer. We’ll use a Turbomist 30P Low Drift Tower (below) as an example. There are two air outlets that are 5 cm wide by 150 cm high for a total area of 0.075 m2 on each side. Be sure to look inside the outlet for any irregularities like baffles or obstructions intended to block air. Subtract those areas from the total. Don’t worry about small things like nozzle bodies.
For rectilinear outlets: Height (m) x width (m) = Area (m2)
For circular outlets: 3.14 x radius2 (m) = Area (m2)
The air outlet on this Turbomist 30P Low Drift tower sprayer is 5 cm wide by 150 cm tall for a total area of 0.075 m2.
2. Measure air speed
First, a few safety warnings: High speed air is loud and can carry debris, so always wear ear and eye protection and respect the hazards inherent to working with air-assist sprayers. Only use an anemometer rated for at least 160 km/h (100 mph) (e.g. here). Do not use a handheld weather meter such as a Kestrel because the impellor could be destroyed and become dangerous shrapnel.
Use an anemometer rated for at least 160 km/h (100 mph) (e.g. here). Do not use a handheld weather meter such as a Kestrel because the impellor could be destroyed and become dangerous shrapnel.
Bring the fan up to speed and holding the meter about 25 cm (10 in.) from the outlet, measure the air speed at several locations along the air outlet both vertically and horizontally. We calculate an average speed because many air outlets do not produce uniform air speed or volume along their outlets. For this example, we measured four locations along the air outlet on both sides of the sprayer and saw significant differences. We did this both in low and high gear (see table below).
High Gear
High Gear
Low Gear
Low Gear
Location Along Outlet
Left Side (m/s)
Right Side (m/s)
Left Side (m/s)
Right Side (m/s)
Top 1/4
41.1
80.3
42.9
24.6
Upper
34.9
32.2
26.4
30.8
Lower
30.8
30.0
24.0
26.4
Bottom 1/4
33.5
40.2
26.8
31.3
Average
35.1
45.7
30.0
28.3
Anemometer readings from the low drift tower sprayer outlets, on left and right side, in high and low fan gear. Four readings from bottom to top to determine the average. Readings taken 25 cm from edge of outlet and PTO set to 540 rpm.
Multiple air outlets
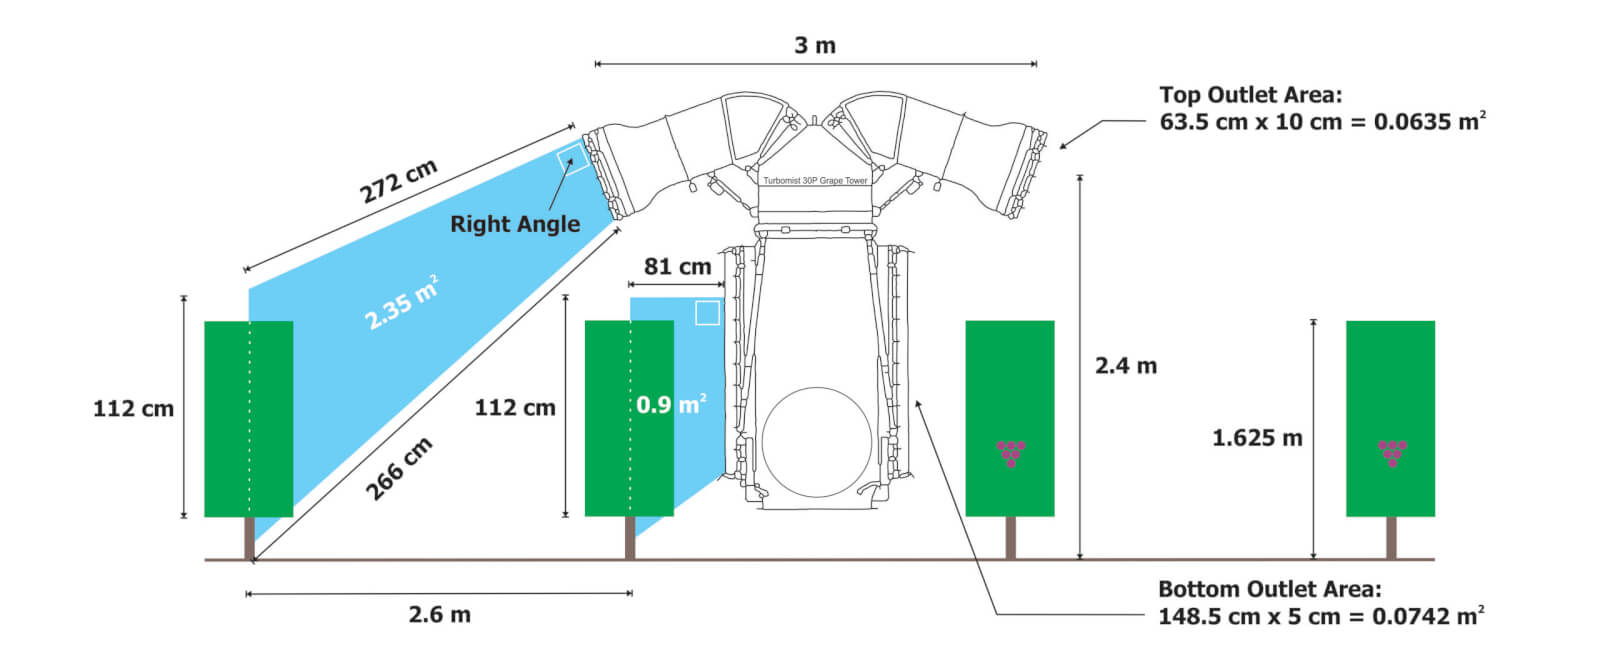
Before we continue with the method, let’s change sprayers to this Turbomist 30P Grape Tower (below). The design is intended to spray adjacent rows from the vertical outlets (5 cm x 150 cm = 0.075 m2) along the tower. The upper, inverted outlets (10 cm x 63.5 cm = 0.0635m2) throw spray over the adjacent rows and cover the outside rows. The intention is to improve productivity by covering four rows of grape (or possibly three) per pass.
The Turbomist 30P Grape Tower Sprayer is a multirow system intended to drive every third or fourth row.Lower, vertical ducts are 5 cm x 150 cm = 0.075 m2Upper, inverted ducts are 10 cm x 63.5 cm = 0.0635m2
However, when we consider this design through the Air Displacement lens, it’s almost like having two sprayers performing two jobs simultaneously. The vertical outlets and the upper, inverted outlets are different shapes. Further, their position (distance and angle, as the top outlets are angled back more aggressively) relative to their respective target canopies are significantly different. How fast must this sprayer drive to optimize the fit? Do we have to compromise coverage and incur drift and waste from one set of outlets to accommodate the other set? The manufacturer has worked to address this potential issue by partitioning the majority of the air energy to the top outlets, but let’s see how that affects travel speed.
3. Total volumetric flow
Having already measured the outlet area, we then measured average air speed (see table below).
High Gear
High Gear
Low Gear
Low Gear
Location Along Outlet
Left Side (m/s)
Right Side (m/s)
Left Side (m/s)
Right Side (m/s)
Top Outlet
27.0
26.5
27.0
26.0
Bottom Outlet
12.0
13.0
10.5
12.5
Average anemometer readings (n=4) for top and bottom outlets, on left and right side, in high and low fan gear. Readings taken 25 cm from edge of outlet and PTO set to 540 rpm.
Now we can use these two values to determine how much air the sprayer generates by calculating total volumetric flow. We first have to convert air speed from m/s to m/h to make the units work, so just multiply it by 3,600. Then we multiply that by the outlet area and we get the table below.
Average air speed (m/s) x 3,600 (a constant) = Average air speed (m/h)
Average air speed (m/h) x Outlet area (m2) = Total volumetric flow (m3/h)
High Gear
High Gear
Low Gear
Low Gear
Location Along Outlet
Left Side (m3/h)
Right Side (m3/h)
Left Side (m3/h)
Right Side (m3/h)
Top Outlet
6,172.0
6,058.0
6,172.0
5,944.0
Bottom Outlet
3,240.0
3,510.0
2,835.0
3,375.0
Total volumetric flow for top and bottom outlets, on left and right side, in high and low fan gear, with PTO at 540 rpm.
4. Target volume to displace
Now that we know the volume of air the sprayer generates, let’s determine the volume of air we need to replace with that spray laden air. This is really the only tricky bit because you have to picture a cross section and then measure the shape. See the illustration below.
For the bottom outlet, it’s simple. The outlet is 81 cm from the grape panel and the grape panel is 112 cm high. We calculate the area of a rectangle by multiplying length by width, so:
Length (cm) x Width (cm) = Area (cm2)
However, the sprayer design makes the top outlet’s job trickier to figure out. This isn’t a rectangle, it’s a “quadrilateral”. We get this odd shape when either the sprayer outlet or the target canopy are significantly taller than the other. Fortunately this one has a right angle so we don’t have to brush off our high school trigonometry textbooks. Instead, we can lean on the internet using this link and plug in the values. As we can see below, the cross sectional areas spanning from the outlets and the middle of the target canopies are 0.9 m2 for the bottom outlet, and 2.35 m2 for the upper outlets.
This gives us a cross sectional area, but we need to convert that to a volume so we can compare the air generated to the air needed. To do that, we multiply the cross sectional area by 100 m, representing how much air would be needed over 100 m of row length. The formula and the results are presented below.
Cross sectional area (m2) x 100 m of row length = Target displacement volume (m3)
Outlet
Target Displacement Volume (m3)
Top Outlet
235.0
Bottom Outlet
90.0
Target displacement volume for each outlet over 100 m of canopy row.
5. Displacement rate
We see the target displacement volumes for each outlet are significantly different. Assuming the air from the upper outlet maintains its integrity and reaches its target canopy without being blown off course, it must produce enough air energy to fill more than twice the displacement volume of the lower outlet. We can see from the earlier calculations that it does produce almost twice the total volumetric flow. But is it enough? To know we must calculate the Displacement Rate for each outlet. Let’s just focus on the left side of the sprayer in high gear.
Displacement Rate (displacements/h) for left side of sprayerin high gear
Top Outlet
26.25
Bottom Outlet
36.0
Displacement rates for the outlets on the left side of the sprayer in high gear.
So we see that the outlets at the top of the sprayer, if stationary, could displace the target volume of air 26.25 times an hour. However, the lower outlet would displace its target volume 36 times in that same hour. We see that we might have a problem. But this is for a stationary sprayer and not a sprayer in motion. The last step gives us what we came here for.
6. Ideal travel speed
We can now determine the ideal travel speed for this sprayer using that same 100 m row length.
[Displacement rate (displacements/h) x 100 m of row length] ÷ 1,000 (a constant) = Ideal travel speed (km/h)
Outlet
Ideal travel speed (km/h) based on left side of sprayer
Top Outlet
2.6
Bottom Outlet
3.6
Ideal travel speed for each outlet on the left side of the sprayer in high gear.
As we stated at the beginning of this article, this is only a model. It doesn’t account for canopy density and assumes the spray laden volume of air produced by the sprayer can reach the target intact over a given distance. However it does indicate that there is a potential issue that will lead to either over spraying the adjacent row (slower travel speed) or under spraying the distant rows (faster travel speed) which could lead to waste, drift and poor coverage.
In the image below, we chose to drive close to 2.6 km/h in high gear. No effort was made to adjust the liquid flow (i.e. change the nozzles) so there was too much spray volume here, but we can see the losses on the left (upwind) side, and the blow-through three rows over on the right (downwind) side. Leaving aside the excessive liquid volume, we could drive faster or reduce the fan gear to reduce the blow-through on the adjacent rows, but we may go too fast (or reduce the rate of air displacement) for the upper outlets to reach the target. We can already see the integrity of the upper-left outlet breaking down as it sprays into the wind.
Testing a travel speed. No effort was made to adjust liquid flow, which is excessive here. Cross wind was from the left to the right in the image. Photo by Corey Parker (Instagram: _parkerproductions)
Take home
An ideal travel speed for an airblast sprayer is more than just being productive. The spray must reach and penetrate the target. If this requires dangerously high speeds, or if you simply can’t move slowly enough, it suggests a problem with the spraying strategy. Changes will have to be made to the sprayer, the target canopy, or even the weather conditions you’re willing to spray in. Getting the job done quickly should not compromise the quality of the job. Use this method to re-evaluate your practices, or to assess the capabilities of candidate sprayers if you’re considering a new purchase. Be sure to confirm what this model is telling you using some coverage indicator, such as water sensitive paper.
Calculator
Now that you’ve read through the process, you can try this online calculator designed to make the process a little easier. The embedded illustrations are there for general guidance, and may not reflect the sprayer design, but the calculations work. Recognize that while this calculator will provide an idealized travel speed based on the data entered, it cannot judge whether the outcome is realistic. Obviously a recommendation to drive 25 km/h is unrealistic, but it does alert the user to the fact that the sprayer is overpowered. Try it out!
Dr. David Manktelow, Applied Research and Technologies Ltd., is gratefully acknowledged for patiently explaining the concept of “Air Displacements” to the author.
There’s a certain deer-in-headlights expression that creeps onto a sprayer operator’s face when we discuss nozzle selection. We sympathize with our field sprayer clients given the variety of brands, styles, flow rates and spray qualities they must choose from. And PWM has made the process even more complex. However, airblast operators face an additional challenge; Unlike horizontal booms, vertical booms often distribute the flow unevenly to reflect relative differences in the distance-to-target and the density of the corresponding portion of target canopy. We discuss the broader, iterative process of nozzling an airblast boom here, but in this article we focus on the topic of flow distribution.
An overwhelmed operator trying to nozzle a boom.
The question of “which rate goes where” is still debated. It’s led to diagnostic devices called Vertical Patternators which show the profile of the spray. Operators can use these to visualize their distribution… but they are few and far between. For the rest of us, deciding on the best distribution begins with understanding how the practice evolved.
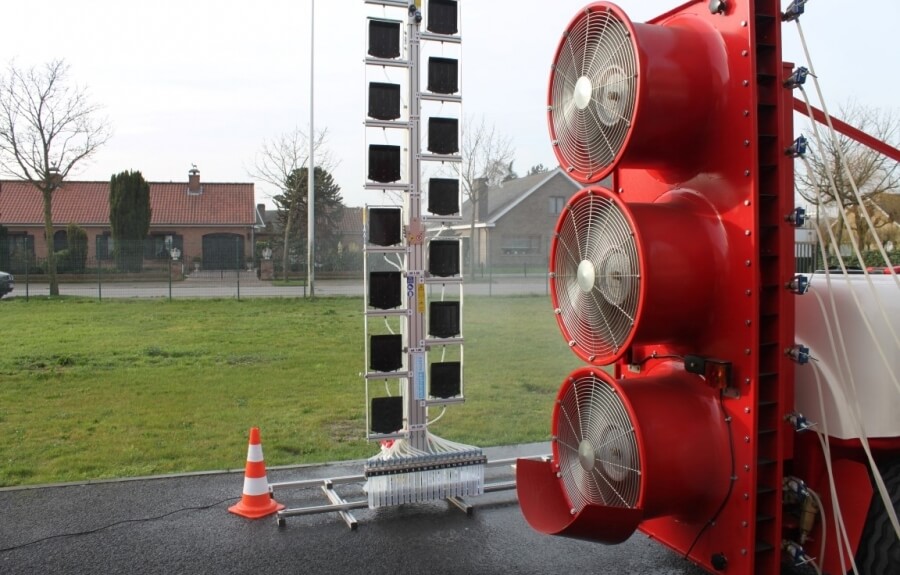
The AAMS vertical patternator. The mast moves back and forth across the swath of a parked sprayer. Each black collector intercepts the spray at different heights. The fractions collect in the tubes at the bottom to show relative volume.A blurry shot of an OMAFA-built vertical patternator. The sprayer parks in front of the screens, which intercept spray. It’s collected in troughs and runs into columns that show relative volume.
1950s
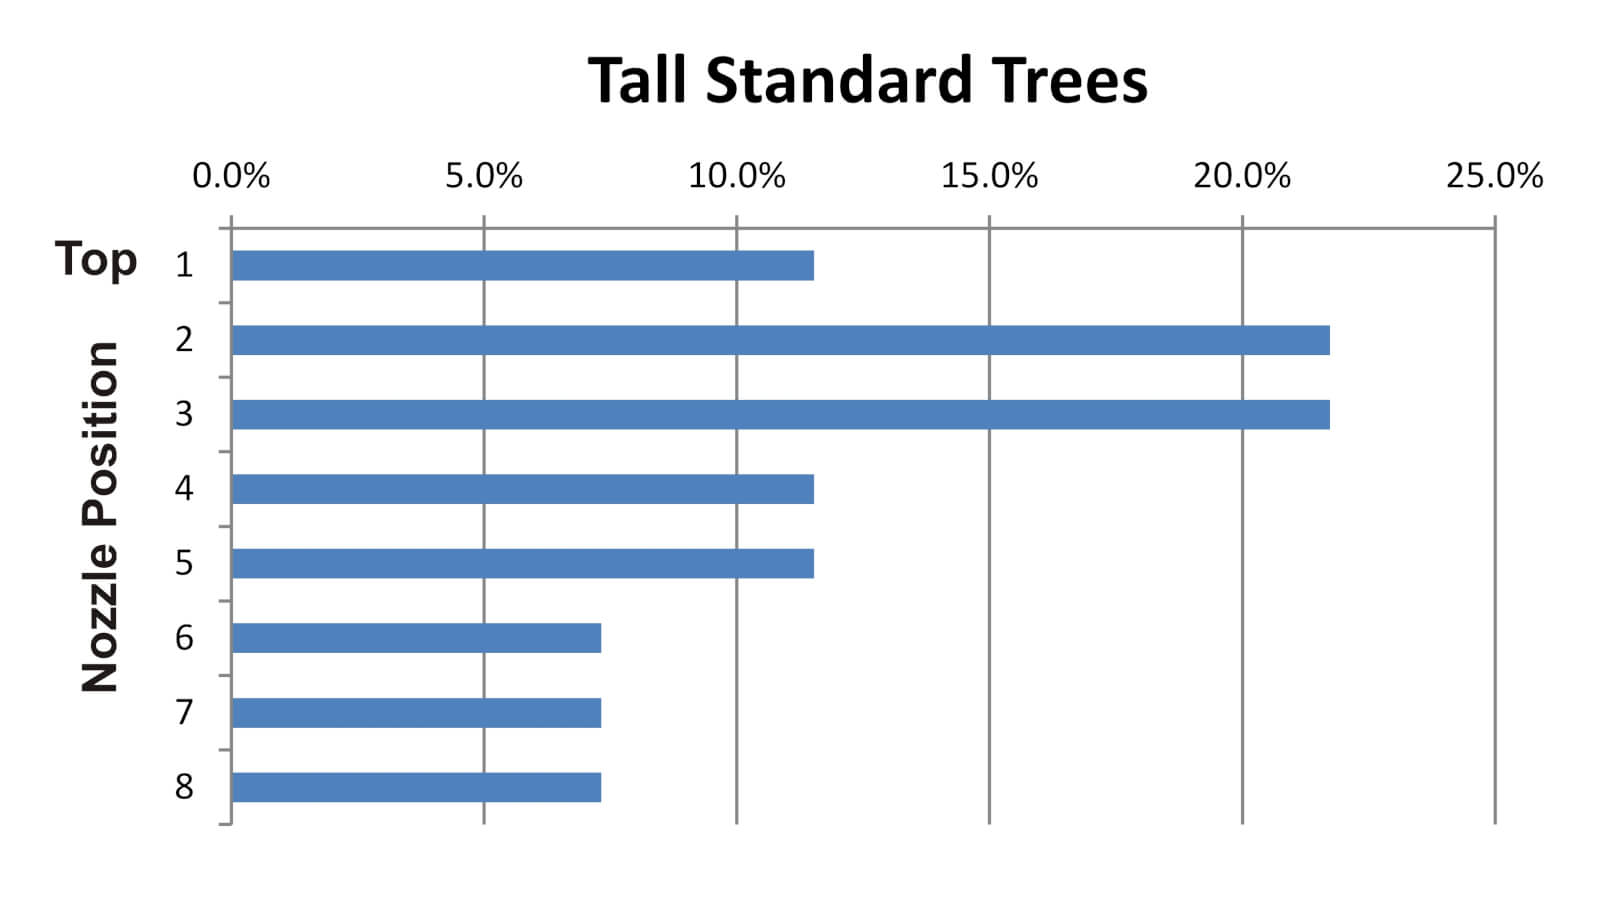
In the 1950s, the mantra was to blow as much as you could, as hard as you could, and hope something stuck. At the time, John Bean promoted a method called “The 70% Rule” whereby operators used full-cone, high volume disc-core nozzles to emit the vast majority of the spray from the top boom positions. John Bean provided a slide-rule calculator to help operators configure booms to align the top nozzles with the deepest, densest portion of the 20-25 foot standard trees they were trying to protect. Back then, most airblast sprayers were engine-driven low-profile radial monsters capable of blowing to the tops of those trees. The practice persisted into the 60s and was encouraged by Cornell University (Brann, J.L. Jr. 1965. Factors affecting the thoroughness of spray application. N.Y. State. Arg. Exp. Sta. J. paper no. 1429).
The profile of the spray would have looked something like the following graph:
1970s
In the 70s, extension specialists began advising operators to tailor the distribution to match the orchard spacing, tree architecture, canopy density and weather conditions. we reached deep into our archives for the Ontario Ministry of Agriculture and Food’s 1976 publication entitled “Orchard Sprayers” to see what we used to tell airblast operators.
The 1976 update of Ontario’s 1971 “Orchard Sprayers” guide. A trove of hard-earned knowledge that still has relevance today. I love that the Minister’s name, and not the author’s, is on the cover. Let’s set the record straight: R. W. Fisher, D. R. Menzies and A. Hikichi, based in Vineland and Simcoe, Ontario.
Here’s a synopsis of what was advised:
Choose a tree size and shape that is typical of your orchard and park the sprayer at the normal spraying distance from it.
Find one or two middle nozzle position(s) and air deflector or vane settings that direct the spray up through the top-inside of the tree. This is called the “middle volume zone”.
Find rates that will give a large output in this middle volume zone, and smaller outputs for positions above and below.
The total output must still add up to the target volume.
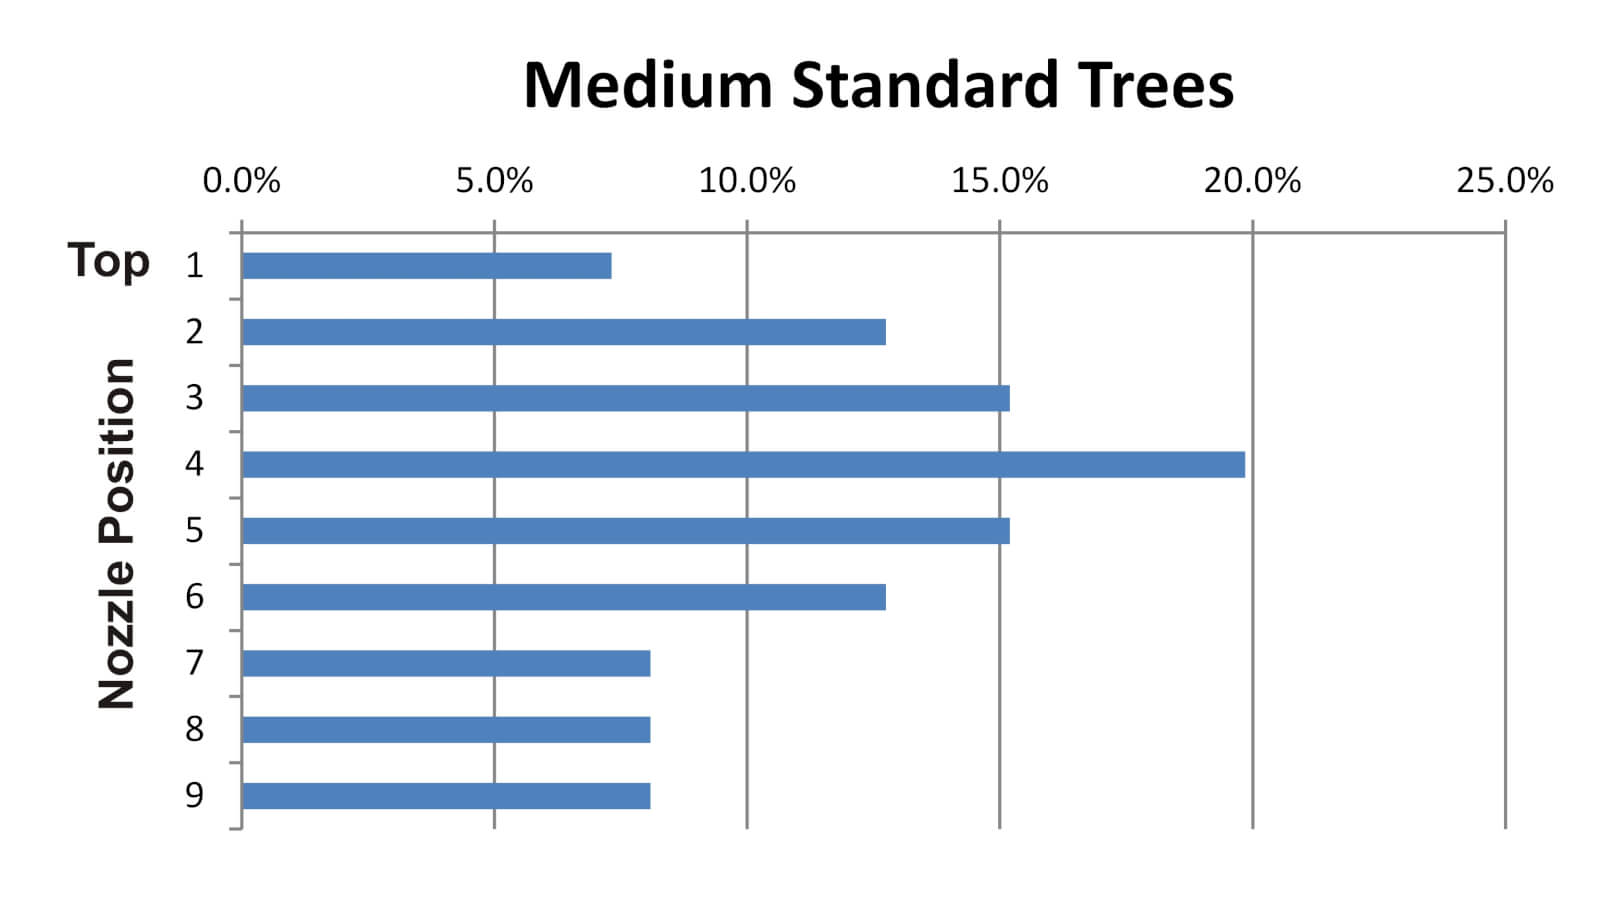
It seemed operators were getting away from high rates in the top positions and instead shifting the distribution to match the canopy shape and density. If we were to follow these recommendations, the spray profile would look something like this:
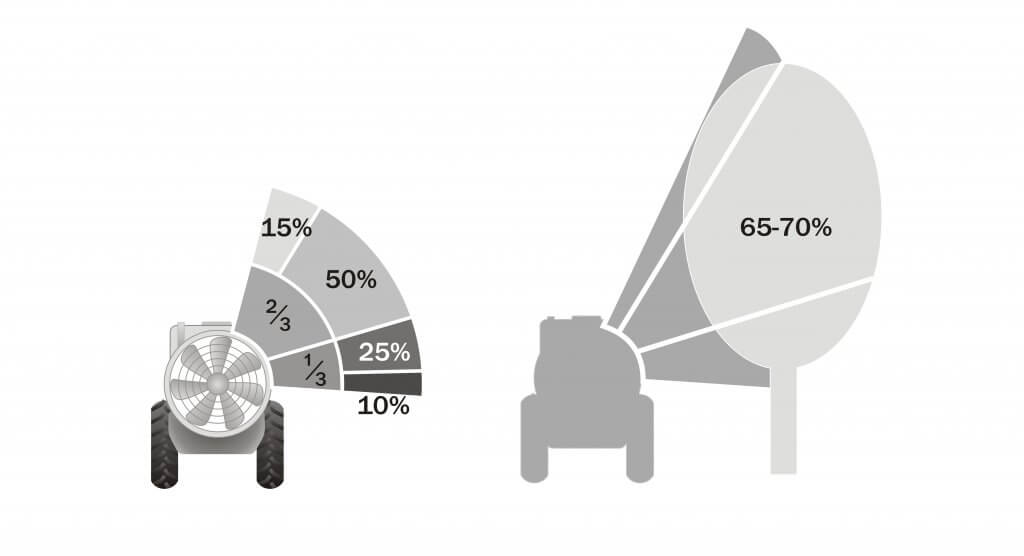
Later, Agriculture Canada’s 1977 publication entitled “Air-Blast Orchard Sprayers – A Operation and Maintenance Manual” had similar advice. Here we find the “2/3 boom rule” as the authors state: “To ensure good distribution through the trees, about two-thirds of the spray should be emitted from the upper half of the manifold.”
1980s
Operators followed this approach well into the 80s, as they endeavored to aim the majority of the spray into the densest part of the canopy. Many can relate to the following illustration that divides the boom, which I modified from an array of period factsheets. The fractions represent the portion of the available boom. The percentages indicate the relative volume. Of course, it matters how large and how far away the target is for either the 2/3-boom or 70% rule to make sense (the middle volume zone is shown receiving 65-70% in the silhouette).
1990s-2000s
The 2/3 or 70% rules still work for standard nut and citrus trees, and perhaps for large cherry trees, but pome and tender fruit orchard architecture is densifying at this point in time. In the 90s and 00s we started transitioning from semi-dwarf into trellised, high density orchards.
Leaping to 2005, Ohio’s Dr. Heping Zhu et al., found that a high density orchard is effectively sprayed by the same rate in each nozzle position. They wrote: “[Historical] recommendations are to use a larger nozzle at the top of each side, with the capacity of the top nozzle at least three times greater than other individual nozzles. However, results in this study with three different spray techniques showed that spray deposit was uniform across the tree canopy from top to bottom with the equal capacity nozzles on the air blast sprayer.”
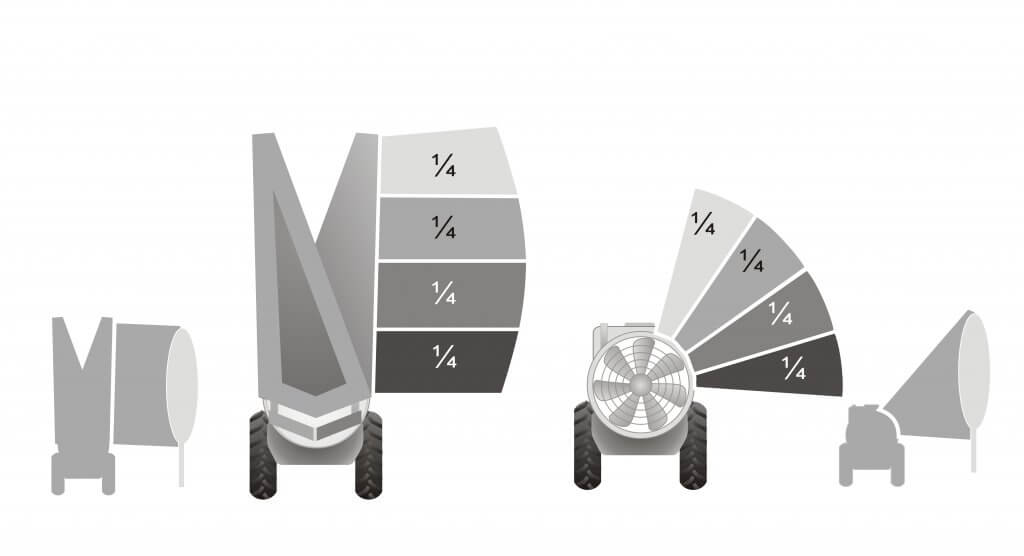
What a pleasant surprise to simplify our lives! If we can use an even distribution for dense, nearby trees, it follows that any vertical crop with the same width and density located close to the sprayer (e.g. cane fruit, trellised vines, etc.) would benefit from even distribution:
Today (2020s)
So, how do we do it today? There is still no simple answer; Conditions change, not all sprayers are the same, and not all applications have the same target. Let’s build on what history has taught us and establish a process to achieve better coverage uniformity and reduce waste.
No matter the crop, the operator must first adjust air settings. Air volume and direction play the most critical role in transporting a droplet to (and into) a target canopy. Too high an air speed will cause spray to blow through the target, rather than allowing it to deposit within. Aim the air just over, and just under, the average canopy. Ensure there’s enough air to overcome ambient wind and to push the spray just past the middle of the target canopy.
It should be noted that we assume the operator is spraying every row. With certain exceptions, alternate row middle spraying is not generally recommended. Not only can it compromise coverage on the far side of the target, it makes it far harder to match the nozzling on a single-row sprayer and is a sure-fire way to increase drift.
Next, determine which nozzles are not needed (e.g. spraying the ground or excessively higher than the top of the canopy). Remember: hollow cones overlap very close to the boom and spread as much as 80°. Airblast sprayers rarely if ever need the lowest positions and unless spraying overhead trellises they may not need the highest either. Turning off the highest, and most drift-prone, nozzle positions in high density orchards is illustrated in the logo I was asked to create for Washington’s short-lived Pound the Plume awareness campaign in 2017.
Then, finally, we decide on distribution. If the crop is nearby and relatively narrow, you can try even distribution. If you elect to distribute the spray unevenly to better match the variable-width target, or compensate for distance, aim half the overall output at the densest part of the canopy (the middle volume zone). Consider how the following factors might influence your choices:
High humidity means more spray will reach the target, and vice versa. This is because all droplets are prone to evaporation. We have heard it said in hot, dry conditions (described by Delta T), a droplet can lose ½ its diameter every 10 feet. As they evaporate they get lighter, meaning they are less subject to their original vector and the pull of gravity, and more subject to deflection by wind. The use or coarser droplets, and/or humectants, can help, but higher volumes can help too – they increase the odds of some droplets hitting the target and actually humidify the air to slow evaporation.
Windspeed increases with elevation, so spray is most likely to deflect at the top of canopies where they have already lost size (and momentum and direction). Early in the season when there is little if any foliage, wind speeds are higher overall. This is why we advise adjusting air settings using a ribbon test before considering boom distribution – you need enough air volume, aimed correctly, to get the spray to the top.
The denser and deeper a canopy, the more spray is filtered and unavailable for coverage. This is why you will always achieve more coverage on the adjacent, outer portion of a canopy versus the interior. In semi dwarf apple orchards we have seen the coverage drop by half for every meter of canopy. Finer spray can penetrate more deeply because there are more droplets and they move erratically, whereas coarser droplets move in straight lines and impact on the first thing they encounter. Higher volumes will improve penetration and overall coverage, but there is a diminishing return and runoff will occur more quickly leading to more waste.
Further to the last point, remember that it’s the air that propels the spray, not the pressure. Higher liquid pressure can propel coarser droplets further, but has little effect on finer droplets. imagine throwing a golf ball and a ping pong ball into a light headwind and envision how they fly. Plus, the higher the pressure, the finer the mean droplet diameter.
Confirm Your Work
To know how all these factors play out, you must use water sensitive paper (or some other form of coverage indicator) to diagnose the results. Remember, the goal is uniform coverage and for most foliar products, we want to achieve a minimum coverage threshold of 10-15% and a droplet density of 85 deposits per cm2 on at least 80% of the targets.
Taking the time to match your output to the target has the potential to greatly improve coverage and reduce waste. Nozzle body flips and quick-change nozzle caps make the process of switching nozzles between blocks fast and easy. It’s worth it.
Grateful thanks to Mark Ledebuhr, Gail Amos and Heping Zhu who edited, corrected and contributed to this article.
Crop spraying is one of the most important and highly skilled jobs undertaken on any arable farm, but it is facing increased public scrutiny. This is why it is vital that the kit you use as a means to apply pesticide to crops is in prime working order and is set up correctly to deliver the product safely and accurately to its target. Optimum sprayer set up will help to maximize the efficacy of applied products, reduce spray drift and keep machinery in good condition.
For this best practice guide to sprayer set up, Farmers Weekly teamed up with former Farm Sprayer Operator of the Year Iain Robertson. Mr. Robertson is assistant arable farm manager at David Foot Ltd, a 2,200ha mixed farm south of Dorchester in Dorset, growing wheat, barley, beans, oilseed rape and maize as forage for the farm’s three dairy herds. The machine used for this guide is a Bateman RB26 self-propelled sprayer and while most of these checks and tests are universally applicable to all sprayers, it is also important to refer to the handbook of the manufacturer of your specific machine.
Watch the video tutorial with Mr. Robertson and then see the step-by-step guide below for more detail.
Pre Start Checks
Before firing up the engine, the first thing to do is your pre-start checks – that means checking your machine’s vital fluids like fuel, hydraulic oil, hydrostatic oil, engine oil and coolant levels. If yours is a self-propelled sprayer, chances are you’ll need to get up on to the back of the machine to check some of these.
“While I’m up on the back of the sprayer I also have a quick look in the top of the tank to make sure that it is nice and clean and the tank rinse nozzles have worked properly – cleanliness is next to godliness,” says Mr. Robertson. Next, move on to the tires. Use a pressure gauge to check all tires are at the correct pressure and refer to the manufacturer’s guidelines. If you’ve got a trailed sprayer, don’t forget to check the tractor tire pressures as well.
Aim for tires to be run at the lowest pressure recommended for the load to be carried. This will help with boom height and stability and also helps tires act like a shock absorber to ride out bumps. If using a trailed sprayer, use a spirit level to ensure that the drawbar is level. Mr. Robertson says he tries to work around the machine in a methodical, clockwise manner to ensure that he doesn’t miss anything.
Coming to the pumps, check that they have got enough oil, check that any tool boxes have enough spare parts and any equipment needed and make sure you are carrying a spill kit with absorbent granules and a spade in case the worst happens and there is a spillage. Make sure all parts are lubricated daily and that any grease nipples are cleaned before and after use to avoid them collecting dirt and blocking.
Check all hydraulic hoses, spray lines and air lines for any signs of wear that could result in problems while operating.
It’s best to run the sprayer at a minimum of 5 bar to check for leaks. Also check the spray tank is fixed down securely, all straps and bolts are tight.
Boom checks
Once opened out, check the boom has good movement in the x- and y-axis. All machines are different so check with your manufacturer as to how the boom is set up. Mr Robertson’s Bateman has tie rods and stock bots that can be adjusted to set the boom up to ride well.
Check the tie rod nearest the back of the machine is slightly loose when moving and that the front rod is tight. Next, check for up and down movement by gently pushing the boom down by about 50cm and letting go. The boom should return to the central position without too much bouncing around.
“We want a little bit of movement but not excessive so that you can ride over the bumps as you go along without over- and under-dosing the crop,” says Mr. Robertson. Boom height is one of the most critical factors when spraying and the ideal height is 50cm above the crop. One of the easiest ways to work this out is by using a cable tie that is cut off at the correct length to use a visual aid from the sprayer cab.
Don’t forget to measure from the tip of the nozzle to the crop, not the spray line.
Good sprayer cleanliness is important, so make sure the system is rinsed through at the end of each day with clean water to make sure there’s no residue left in the boom. If your machine’s boom doesn’t have recirculation, remember to take the end caps off occasionally and flush out the whole boom.
Nozzle checks
Check that the nozzles are aligned both vertically and horizontally, according to the NSTS guidelines. Loosen clamps to adjust any nozzles that need realignment.
Check the nozzle output at least twice a year by running the sprayer with clean water at 3 bar pressure. Time the output of each nozzle for 30 seconds. If nozzles have been used previously, it’s best to check their output against that of a new pair. Mr Robertson advises using a measuring cylinder rather than a jug to measure the flow rate as a jug is less accurate “because you get a bigger variation over the wider surface area”.
With an 03 nozzle running for one minute at 3 bar pressure, the output should be 1.2 litres/minute as a rule of thumb but refer to the nozzle manufacturer’s output chart for the expected flow rate. “An easy way to remember this is: at 3 bar your nozzle size multiplied by four will give you your target litres/minute output. It works for all nozzle sizes.” If the output varies more than 4% of the average, or if the spray pattern visually doesn’t look correct, you need to change the nozzle set.
After checking the output, cross-reference this figure with the rate controller – you may need to adjust the flow figures to ensure that the two correlate. If a nozzle becomes blocked while spraying, Mr. Robertson says he will swap it for a new one and then clean it later using a toothbrush or airline. Never blow through a nozzle with your mouth.
Nozzle choice
The choice of nozzle is highly dependent on the sort of job you’re doing. “Timing is crucial but using the right nozzle at the right time will make the job so much easier, cut drift and mean that you’re getting more of the product where you want it to go. If you aim at it you will hit it,” says Mr. Robertson.
His nozzle of choice is an 03 size and he prefers to use the Defy 3D nozzle alternated forwards and backwards across the boom for pre-emergence work and T0 applications as well as the T3 ear spray. “In less than optimum conditions I may prefer to use the Amistar/Guardian Air, a fine induction nozzle. I would use this at T1 and T2 and also in sub-optimum conditions.” This nozzle has a 3-star Local Environmental Risk Assessment for Pesticides (LERAP) rating and is 75% drift reducing.
A water volume of 100 litres/ha is a good rate for spring fungicide application. It provides enough coverage for good disease control and allows maximum efficiency from the sprayer.
Forward speed
The third and final part of reducing spray drift is forward speed. Depending on nozzle size and water volume, aim to travel at 12kph.
Mr Robertson says he finds that this speed gives a good overall output and means you don’t get shadowing or turbulence behind the machine.
Tips and tricks
One of the biggest risk of contamination is at fill up. “A fantastic, cheap trick that I learned through Farm Sprayer Operator of the Year is to take a 200 litre plastic drum and cut it in half to create two drip trays to catch any spillages under the induction hopper and the tank overfill.” This eliminates point source contamination, he says.
“Finally, there’s a plethora of information out there on the internet, loads of good apps to download. The technology is there to help us do the best job possible and make our job as safe as possible.”
A Veteran Applicator’s Questions about Pesticide Handling
Time and again, after years of working with dozens of different chemicals, I would wonder to myself “How dangerous is this chemical?”, “Is glyphosate as safe as they say it is?”, “How do I find out what type of safety gear I need while handling this chemical?”
Beyond the agrichemical dealer, ag. consultants, and university or government ag. extension specialists, a quick internet search reveals many sources of pesticide information. Collectively they identify the active ingredient(s) in formulated products, they detail which pests are best controlled by the pesticide, and they provide instruction for application. But it’s more difficult to find consistent, practical information about safe pesticide handling. Sometimes it’s excessive to the point of being impractical (try finding actual “chemical proof” gloves), and sometimes it’s minimal and vague – it depends where you look. No matter the level of precaution, pesticide safety is time consuming and involves some fussing, but it is the hallmark of responsible pesticide use. Just as we ensure that we are applying “safe rates” when spraying chemicals, we must also ensure we are respecting our own well-being while handling chemicals.
In Canada, the Pesticide Regulatory Directorate (PRD) is charged with protecting human health and safety by monitoring pesticides that are sold in this country. According to the Federal Pest Control Products Act all pesticides sold in Canada must be registered with the PRD. There’s a very nice overview of how that process works here. It is during this registration process that pesticide handling precautions are identified for the label. Further classification may take place under provincial acts.
All pesticides are designed to disrupt, repel, control or kill living organisms, but when it comes to safe handling, insecticides receive the most attention. This is because herbicides and fungicides target biochemical pathways that only exist in plants or fungi. However, most pesticides can be hazardous if they are not handled correctly. The handling precautions that appear on the label are based on five factors.
Five factors that affect handling precautions:
1. Pesticide Family
This factor is the broadest way to categorize potential risk to the handler. Generally, herbicides and fungicides are considered safer than insecticides, but there are notable exceptions. Do not rely solely on the pesticide family when making decisions on pesticide handling.
2. Pesticide Mode of Action
The mode of action gives further detail into how a pesticide should be handled. Modes of action that inhibit biochemical pathways that exist in the target pest, but not in mammals (people, in particular), have lower acute toxicities. Examples include herbicides that inhibit enzymes involved in amino acid synthesis or in photosynthesis – these enzymes do not exist in mammals. However, once again, there are always exceptions. Do not rely solely on mode of action when making decisions on pesticide handling.
3. Pesticide Formulation & Route of Entry
Pesticide formulation affects how a product can potentially be absorbed into the body. Emulsifiable Concentrates (ECs), for example, have higher rates of absorption than solutions or dry products. When it comes to the route of entry, dermal contact is considered safer than inhalation or ingestion. However, not all parts of your skin are created equal, and the point of dermal contact on the body matters a great deal.
4. Pesticide Toxicity
Taken collectively, the first three factors form the overall toxicity of the pesticide. The level of toxicity cannot be predicted – it has to be tested. The LD50 (defined below) values that are reported for a pesticide come from standardized experiments such as animal feeding. Although the chosen species (usually white rats for mammalian endpoints) are known to be similar to humans in their response, there is still the possibility of error. Nevertheless, toxicity forms an important basis for establishing handling precautions.
5. Operator Exposure
People handle toxic substances every day. Household bleach, for example is surprisingly toxic, and yet it can be readily found on kitchen shelves in many homes. The risk of being harmed by a toxic product can only be determined by the likelihood of exposure. While it is possible someone might accidentally consume a hazardous dose of bleach, it’s improbable. Exposure does not just refer to a single exposure to a substance – repeated exposures to small doses of a toxic substance can have a cumulative effect. The goal when handling any pesticide is to minimize exposure, but it becomes even more critical when that pesticide is highly toxic. Together, exposure and toxicity form the basis for risk.
Risk = Hazard x Exposure
Studies have shown that exposure is greatest for handlers of agricultural pesticides during the mixing and loading phase of spraying. During this phase, the risk to the handler may be increased due to:
physical stress
the denial of risk
a negative opinion of personal protective equipment (PPE)
The main method of pesticide exposure is dermal, and many of the surfaces on a piece of equipment are already contaminated.
Health effects of pesticides: Acute and Chronic
Acute: short term
High exposure, resulting in immediate reaction due to a high dosage of pesticide exposure. The severity depends on the toxicity of the molecule and entry into the body (dermal, oral, eyes, etc.). The most common acute reaction is skin irritation, although in certain cases respiratory, digestive, and neurological systems may be affected. Organophosphate (e.g. Lorsban, Malathion) and carbamate (e.g. Sevin, Lannate) insecticides inhibit the cholinesterase enzyme, which is found in humans and affects nerve function. Frequent users of these insecticides undergo regular blood tests to ensure their levels are normal.
Chronic: long term
Chronic affects are more prolonged as they are usually due to lower doses of pesticide exposure over a longer period of time. Although some rare cancers and disruption of the reproductive system have shown to be related to this type of exposure, when the general population and farming population have been compared in studies, the farming population has shown an under-representation in the majority of cancers. In the cases were reproductive malfunctions were observed, a different cause of the malfunction, such as genetic offset, was most often observed in these situations. However, cancer types such as skin cancer and brain cancer were overrepresented in the farming community. A study in France has shown that the onset of neurological disorders in Agriculture communities shows a strong connection between Parkinson’s disease and exposure to pesticides.
Label Information
The majority of information needed to safely handle pesticides is found on the label. Pesticide labels are legal documents, meaning they can be enforced by the federal government. The problem is that most sprayer operators rarely look at the label as they are not very reader friendly and easy to skim through. Most pesticide boxes even have the recommended rate, or acres/case on the side of the box now, so there is even less reason to look at the label.
LD50– the dose of pesticide in mg per kg of the test animals body weight that is lethal to 50 percent of the group of test animals. For example, if the pesticide has an acute oral LD50 value of 1000 mg/kg, and the test animals each weigh 1 kg, then 50 percent of the animals would die if they each ate 1000 mg of pesticide at once. A 100 kg animal would need to ingest 100,000 mg (100 g) of the pesticide for the same effect. LD50 is often expressed by the route of entry – dermal, inhalation, acute oral (ingestion) are the main examples.
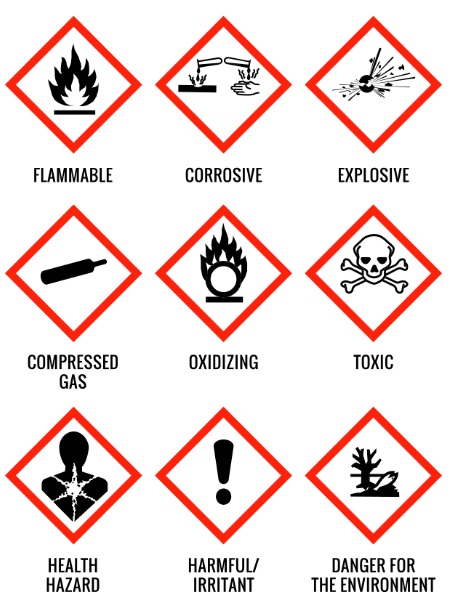
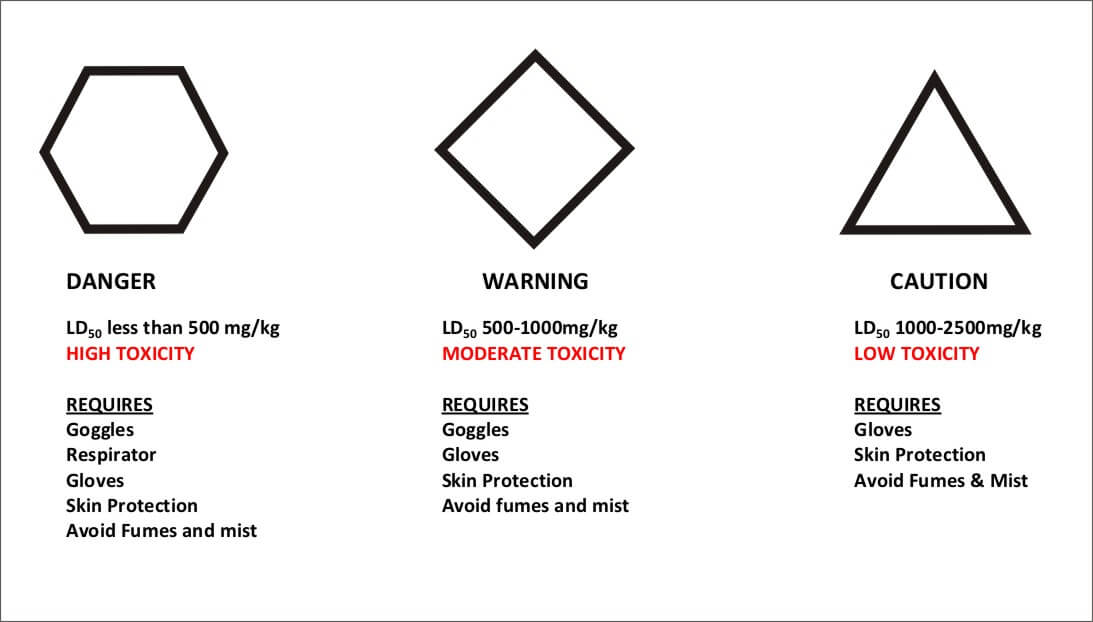
Degree of Risk and Hazard Symbols
Two Factors that Determine the Appropriate Level of PPE
The Hazard Rating (above) incorporates the minimum protection generally required for a substance with the rating.
The Label Recommendations will usually give the additional specific protective clothing and equipment needs for an applicator.
Degree of Exposure
This increases as the length of each pesticide application increases. As the number of pesticide applications increases, the time between exposures decreases. If an operator becomes exposed to spray, dust or fumes the degree of exposure increases. Essentially, more protective wear is needed as the degree of exposure becomes greater.
Knowledge
This encompasses all of the above information. In order for a pesticide applicator to avoid injury or the chances of adverse effects on the body, a pesticide applicator must be knowledgeable about pesticides. It can be overwhelming for an applicator to sort through all of the information on the label or on-line regarding pesticides. So much so, that most often applicators avoid the information altogether. Ongoing training and learning will ensure that they are effective in their work. Many aspects of pest control change continuously, as new studies are conducted on the effects of pesticide exposure.
A Safety Data Sheet (SDS) is available for each pesticides registered, and these are usually linked on manufacturers’ websites. It can be eye-opening what types of toxicity tests are done, and what the results are.
Denial that pesticides can potentially cause harm is also a major flaw in the behaviour of applicators. Maintaining a safe work environment and practicing personal safety will reduce the chances of an applicator experiencing serious injury throughout their farming career.
Unknowns
There is very little certainty in toxicology. For one, most testing is done using acute oral and dermal dosing. Basically, toxicologists expose test animals to the neat active ingredient and watch what happens. There is a lot of missing information – what about formulant like solvents, and surfactants? What about synergies in tank mixes? Some, but not all of these, undergo testing. We also have much less information on chronic (long-term) effects, and can only simulate these in quasi long-range tests. In addition, toxicological methodologies and statistical approaches can vary, and we should not be surprised that some reports disagree, and that there are outright conflicts between toxicologists and epidemiologists (scientists that study patterns of health in populations). Regulators are aware of these shortcomings and often use safety factors to account for them. But those of us that use these products regularly, the message is simple: be cautious, and protect yourself.
Avoid Cross-Contamination
Disposable nitrile gloves are the product of choice for handling pesticides. But one of the most common problems with the use of gloves is cross-contamination. You’re handling product with your gloves on, touching containers, hoses, valves, and couplers. When you’re done, you climb back into the cab where you take off your gloves. Later, someone climbs up into the cab to talk to you, using the railing and operating the door handle without gloves. Guess what’s on their hands? Even later, you put away the hose without gloves and return to the sprayer. Now it’s on the steering wheel and all the levers. There are a few solutions:
Double-glove so you can take the dirty outside glove off and still be protected.
Wipe down surfaces that you might touch with gloved or bare hands daily.
If using non-disposable gloves, avoid lined gloves and rinse the insides out daily.
Learn More
If you would like to learn more about pesticide safety, or to obtain pesticide application training, the Pesticide Applicator License can be obtained from the Ministry of Agriculture. This course offers in depth, valuable safety information for applicators, as well as general knowledge for pesticide applicators. The Pesticide Regulatory Directorate provides workers, employers, and the general public with a wide range of pesticide information. The PRD can be contacted from anywhere in Canada toll free at: 1-800-267-6315
Download this Quick Reference Guide for commonly used herbicides. Print, laminate and post it at the fill station or pesticide storage area for easy reference. Also, grab a copy of Health Canada’s “Stay Safe when using Pesticides” factsheet.